A single average hides most of what your survey data has to say. Two teams can both average 7 hours of sleep while one clusters tightly around 7 and the other swings between 4 and 10. Descriptive statistics, the standard deviation, variance, standard error and their relatives, tell those two stories apart. This article walks through one real dataset, the Employee Wellbeing Study sample survey (300 respondents), and shows exactly where each number appears in PaperSurvey and how it maps to our free Standard Deviation Calculator and its siblings.
The scenario
An HR team asked "How many hours of sleep do you get on a typical work night?" as a Number question (2 digits). Of the 300 people who responded to the survey, 291 answered this question. The team wants to know not just the average, but how spread out the answers are and how much to trust the mean.
Add the Descriptive Statistics widget
The full breakdown lives in a single analysis widget. The Statistical Deep-Dive view is built for you automatically and already contains one, but you can add it to any view:
- Open your survey and go to Analysis, then open a view (or click + New View).
- Click Edit, then Add to open the Add blocks drawer.
- Under Advanced stats, pick Descriptive Statistics.
- In the inspector, choose the question under Questions. The widget accepts Number, Range, NPS, single-choice and single-choice grid questions (grid rows are offered individually).
- Use the Statistics to show checkboxes to trim the list. Every statistic starts ticked, so untick the ones you do not need. At least one must stay selected. A per-widget Time range field is also available; the view's own filter bar handles response filters but has no date selector.
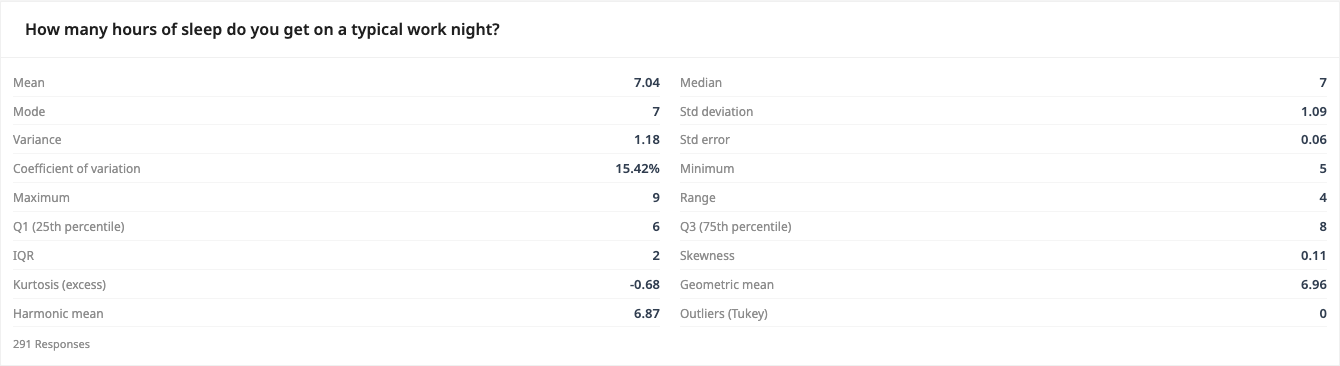
For the sleep question the widget reports: Mean 7.04, Median 7, Mode 7, Std deviation 1.09, Variance 1.18, Std error 0.06, Coefficient of variation 15.42%, Minimum 5, Maximum 9, Range 4, Q1 6, Q3 8, IQR 2, Skewness 0.11, Kurtosis (excess) -0.68, Geometric mean 6.96, Harmonic mean 6.87 and 0 Tukey outliers, across 291 responses.
The numbers are always computed from the latest responses whenever the view loads or a filter changes, so the widget stays current without any manual refresh step.
Spread: standard deviation and variance
The two spread rows answer "how far do answers typically stray from the mean?". Here the standard deviation is 1.09 hours, and the variance is its square, 1.18. A typical respondent is within roughly an hour of the 7.04 average, which is a tight distribution.
PaperSurvey uses the sample formulas (dividing by n-1), which is the right default when your respondents are a sample of a larger population. There is no population toggle in the widget, and displayed values are rounded to at most two decimal places. If you need the population version, or more precision, paste the exported values into the Standard Deviation Calculator, which has a sample/population toggle, or the Variance Calculator for the squared form.
Precision: standard error
The Std error row (0.06 here) is the sample standard deviation divided by the square root of n, so 1.09 divided by the square root of 291. It answers a different question than the standard deviation: not "how spread out are people?" but "how precisely have we pinned down the mean?". With 291 answers, the true average sleep of this workforce is very likely within a fraction of an hour of 7.04.
This matches the default sample mode of the Standard Error Calculator. The widget does not compute confidence intervals, so when you need one, take the mean and standard error into the calculator or your stats package and build the interval there.
Comparing variability across different scales
Standard deviations from questions on different scales cannot be compared directly. The Coefficient of variation row rescales the spread as a percentage of the mean (sample SD divided by mean, times 100), so you can put two questions side by side.
Add a second Descriptive Statistics widget for another question and compare the CV rows. In the Staff Experience Survey sample, the 0-10 NPS question has a mean of 7.53 with a standard deviation of 2.33, a CV of 30.89%, about twice the relative variability of the sleep question's 15.42%. Staff agree far more about their sleep than about recommending the workplace.
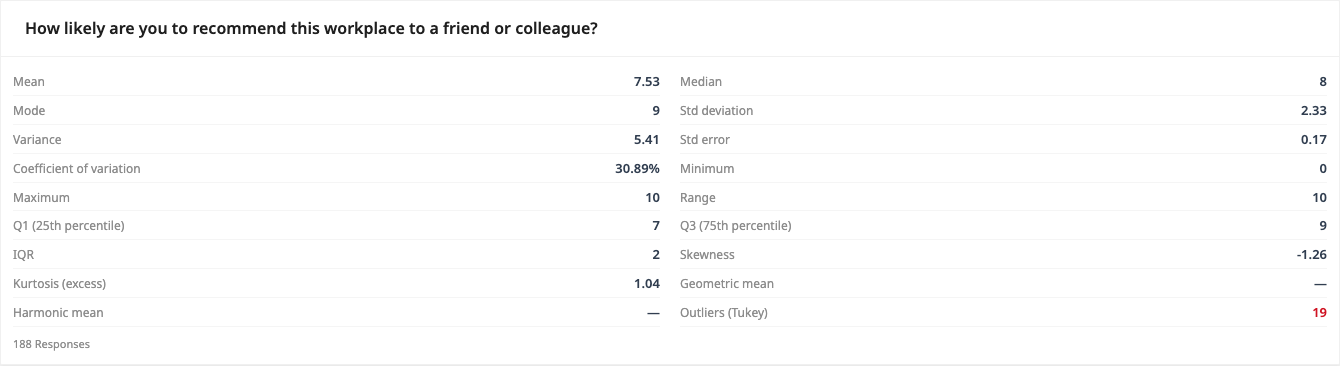
Treat CV as a rough guide on rating scales: it is only strictly meaningful for ratio data with a true zero, it becomes unstable when the mean is near zero, and the widget shows no result at all when the mean is exactly zero. The Coefficient of Variation Calculator applies the same formula if you want to check a subset by hand. The same Descriptive Statistics widget on the NPS question also illustrates why you look past the mean: a skewness of -1.26 and 19 Tukey outliers flag a long tail of low scores that the 7.53 average smooths over.
Special means for special data
Two more rows cover cases where the arithmetic mean is the wrong kind of average:
- Geometric mean (6.96 for the sleep question) is the right average for growth-like or ratio data. It only exists for strictly positive values, so if any response is zero or negative the row shows a placeholder instead of a number. The Geometric Mean Calculator follows the same positive-values-only rule.
- Harmonic mean (6.87) is the right average for rates. It shows no result if any response equals 0, though negative values are allowed. See the Harmonic Mean Calculator for worked examples.
Note the ordering: harmonic 6.87, geometric 6.96, arithmetic 7.04. The three always line up this way for positive data, and the gaps widen as the data gets more spread out. If your Number question needs fractional answers, turn on the Decimal switch in the question editor, which adds two decimal places, including two extra digit boxes on printed paper forms.
Quick single-number tiles and the Results footer
For dashboards that only need one headline number, the Add blocks drawer's Stats category has a Mean widget ("Average (mean) value across all numeric responses.") and a Standard Deviation widget ("How spread out responses are from the mean.").
The Results subtab under Analysis also prints a small footer under numeric charts with Mean, Std Dev and Median.
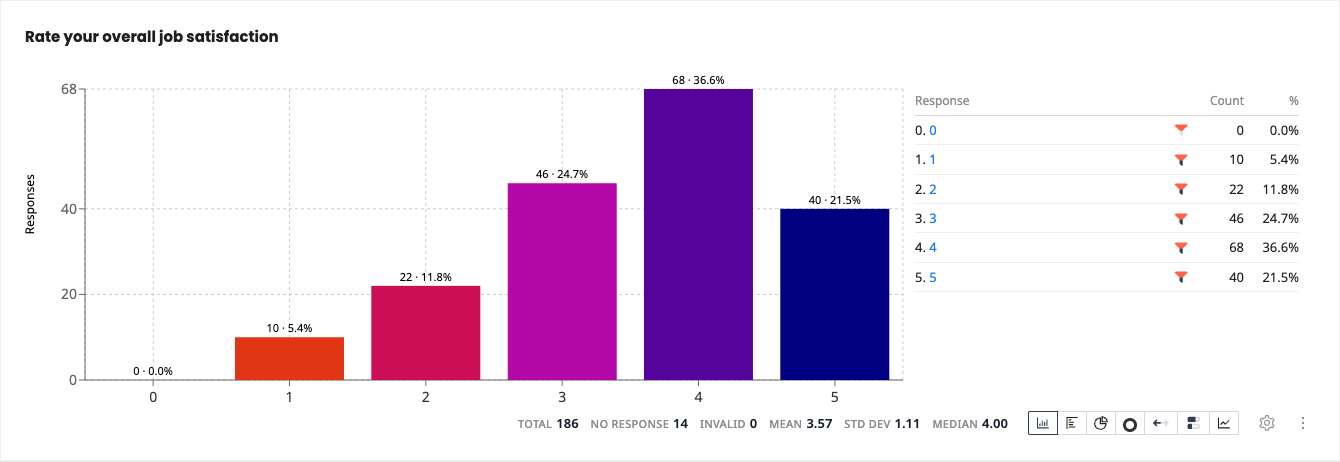
The footer and the widget will not always agree exactly, by design. The footer's standard deviation is population-based and the footer excludes values of 0 or below, while the Descriptive Statistics widget uses sample statistics on all numeric answers. For the job satisfaction question above the footer reads Mean 3.57, Std Dev 1.11, Median 4.00 across 186 responses. When precision matters, trust the widget.
There is also a shortcut from any numeric chart on Results: open the chart's ... menu (its tooltip is Actions) and pick Analyze as then Descriptive Stats to save a preconfigured widget into a view. The option appears once your survey has at least one analysis view, and with several views each entry becomes a submenu where you choose the destination.
Choice questions and what the widget analyzes
For single-choice questions and single-choice grid rows, the widget runs on each option's numeric recode value, the code you can edit per option. That makes descriptive statistics on a 1-5 agreement item meaningful, but check your recode values first if the options are not naturally ordered. Multiple-choice questions are not supported here.
When you need more than the widget shows
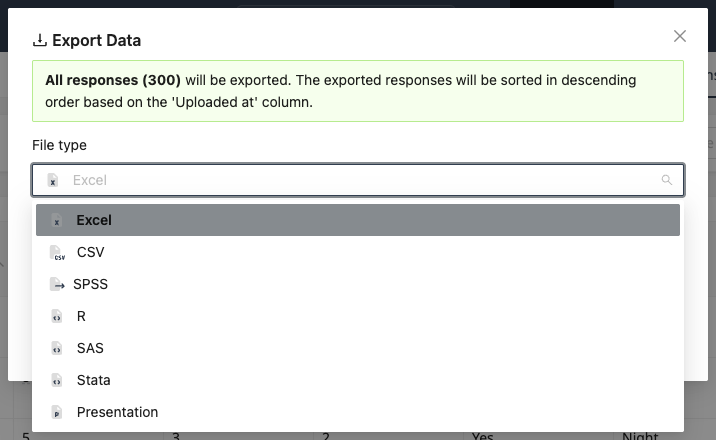
Population variance, confidence intervals at custom confidence levels, or any statistic beyond the 18 in the catalog follow the same workflow: collect with PaperSurvey, export, then compute. Open the Responses tab, click Export, and choose a file type: Excel, CSV, SPSS, R, SAS, Stata or Presentation. The SPSS .sav file carries numeric codes with value labels, and the R export bundles the data with a ready-made import script, so the columns land in your stats tool analysis-ready. From there, our free calculators or SPSS/R take over.
Next steps
- Creating an analysis dashboard to arrange descriptive statistics widgets into a shareable view
- Filtering data in analysis to compute the same statistics for one department or time period
- Exporting survey data for the Excel, SPSS and R workflow in detail
- Standard Deviation Calculator to try the formulas on your own numbers