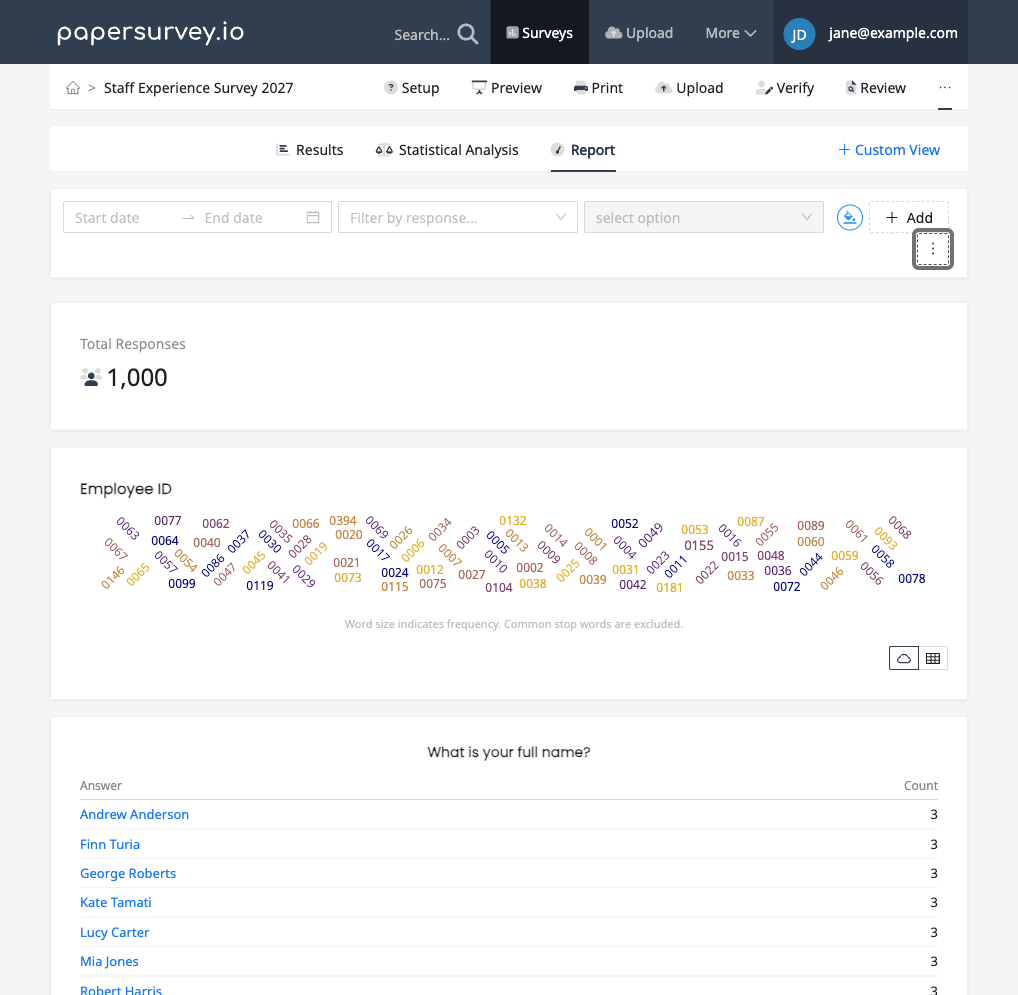
Analysis dashboards let you visualize survey responses with charts, summaries, and cross-tabulations. You can build multiple dashboards per survey to focus on different aspects of your data.
Creating a new dashboard
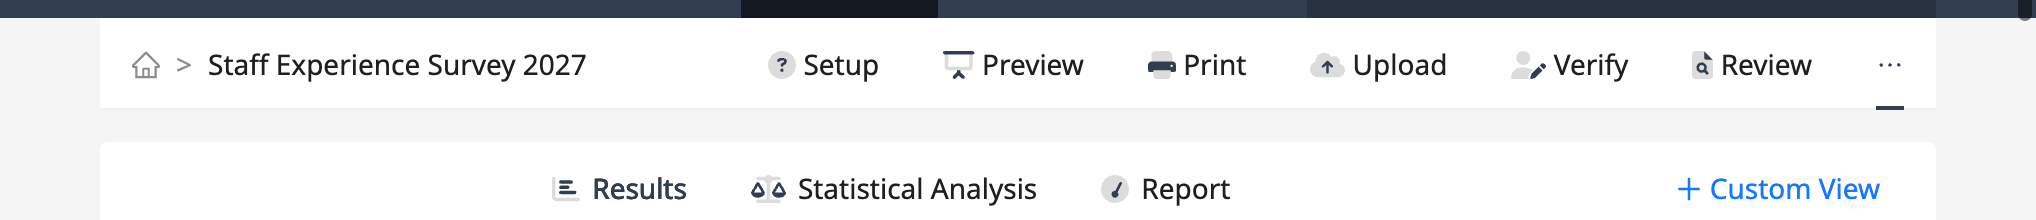
- Open your survey and go to the Analysis tab
- Click New View
- Give your dashboard a name, pick an icon, and choose whether to start blank or from a template such as Smart Report
Templates prefill the view with a ready-made set of widgets based on your survey's questions. Depending on the questions in your survey, templates like All Questions, CX Dashboard, Statistical Deep-Dive, and Assessment Report are also available. Each view appears as its own tab at the top of the Analysis section, next to the built-in Results and Compare Responses tabs.
Adding widgets

Click Add in the dashboard toolbar to open the block library and add a visualization to your dashboard. Each widget displays data from one or more questions in your survey. You can also send any chart from the Results tab to a view by opening the chart's actions menu and choosing Save to View.
Available widget types include:
- Bar chart - Compare response counts across options
- Horizontal bar chart - Same as bar chart, laid out horizontally
- Pie chart - Show proportions of each response option
- Likert bar - Visualize agreement scales and rating distributions
- Stacked distribution - Compare distributions across groups
- Cross-tabulation - Analyze relationships between two questions
- Over-time chart - Track response patterns over a date range
- Statistics widgets - Averages, NPS, CSAT, standard deviation, and other summary numbers
- Headings and text - Organize your dashboard into sections
For a full list, see Available Chart Types.
Configuring widgets
Click Edit in the dashboard toolbar, then click a widget to open the inspector panel beside the dashboard. From there you can configure it by:
- Selecting the question to visualize
- Choosing the chart type from the available options
- Applying filters to show only specific subsets of data (using the Filtered Chart or Comparison widgets)
- Adjusting display options such as value labels, label format, and sort order
- Changing the widget's width with the Block size control
Rearranging your dashboard
In edit mode, drag widgets by their handle to reorder them on the dashboard. You can also move a selected widget with the up and down arrow keys. Build layouts that tell a clear story from your data, starting with high-level summaries and drilling down into details.
Managing multiple views
You can create as many analysis views as you need. This is useful when different stakeholders want to see different aspects of the data. Each view is independent and can be shared separately.
To switch between views, click the view's tab at the top of the Analysis section.
Next steps
- Sharing Analysis Views to share dashboards with others
- Exporting Charts as PowerPoint to download your dashboards
- Filtering Data in Analysis to narrow your results