Standard Error Calculator
Calculate the standard error of the mean. Paste your sample data separated by commas or new lines.
Learn how to calculate it yourselfEnter your values
Results update as you type.
How to enter your data
Type or paste your numbers into the Data box, separated by commas, spaces, or new lines, for example 12, 15, 15, 18, 22, 30. You need at least two numbers. Leave the Type dropdown set to Sample, which is the usual choice, unless your numbers cover every single member of the group.
Standard error
Check your inputs
Enter valid values to see your result. Use the field hints or open the data guide for help.
The Standard Error Calculator takes a list of numbers, such as test scores or survey ratings, and works out the average, then tells you how close that average is likely to be to the real average you would get if you could measure the whole group. A smaller standard error means your average is more trustworthy, while a larger one means it could easily be off. It also shows you the average (the mean), how spread out your numbers are (the standard deviation), and how many numbers you entered.
Calculate it yourself
Use the three observations 2, 4 and 6 to calculate the standard error of a sample mean.
Follow this worked example, then repeat the steps with your own numbers.
Find the mean and squared deviations
Mean = (2 + 4 + 6) ÷ 3 = 4. Squared deviations = 4, 0 and 4.Calculate the sample standard deviation
s = √[(4 + 0 + 4) ÷ (3 − 1)] = √4 = 2.Here s is the sample standard deviation and n = 3 is the number of observations.
Divide by the square root of the sample size
SE = s ÷ √n = 2 ÷ √3 ≈ 1.155.
This example uses the Sample option. The Population option divides the squared deviations by n when calculating the standard deviation.
Check your answer in the calculatorBuilt into PaperSurvey.io
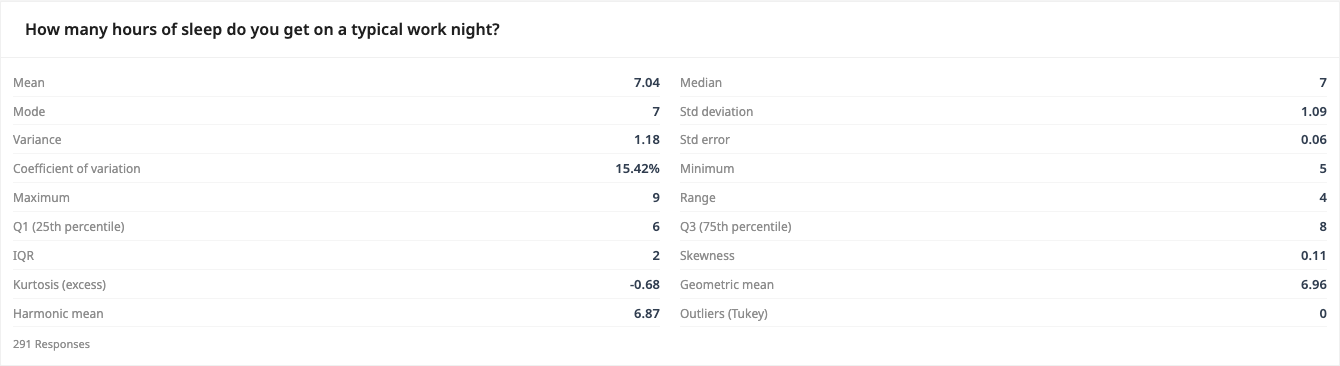
Read standard error alongside the mean and sample size in the Descriptive Statistics widget.
Where it is used
- Teachers: A teacher enters the exam scores of 20 students to see how much the class average might vary if a different class had sat the same test.
- Cafe owners: A cafe owner pastes 40 customer satisfaction ratings to check whether an average score of 4.2 is solid or could easily be higher or lower.
- Market researchers: A researcher enters the ages of survey respondents to report the average age along with how precise that figure really is.
Standard error vs standard deviation
The standard deviation measures the spread of the data. The standard error of the mean measures how precisely the sample mean estimates the true population mean, and it shrinks as the sample grows.
When should you use it?
Use it whenever you have a list of numbers and you want to know how trustworthy their average is. This could be test scores, survey ratings, prices, wait times, ages, or any set of measurements. The standard error is most useful when your numbers are a sample, meaning a smaller group that stands in for a much larger one, such as 50 customers out of thousands. It answers a simple question: if you had measured a different group instead, how much might the average have changed? A small answer means you can rely on your average.
What does the result mean?
The standard error is shown at the top. It tells you roughly how far your average is likely to sit from the real average of the whole group, in the same units as your numbers. Smaller is better, because it means your average is more precise. There is no single good number, since it depends on your scale and units. A widely used guide is that the true average usually falls within about two standard errors on either side of your average. Fewer numbers and a wider spread both push the standard error up.
Mistakes to avoid
Enter at least two numbers, because with only one number the calculator cannot work out a standard error. Do not mix different things in one list, like combining prices with star ratings, as the result would be meaningless. Keep the Type on Sample unless your numbers truly cover every single member of the group, which is rare. Remember that a small standard error does not prove your data is correct; it only shows the average is precise. Finally, do not confuse it with the standard deviation, which measures spread, not precision.
How to use this calculator
- Type or paste your numbers into the Data box, separated by commas, spaces, or new lines.
- Leave the Type dropdown on Sample, or choose Population only if your list covers every single member of the group.
- Read the Standard error shown at the top; a smaller number means a more reliable average.
- Also check the Mean, Std deviation, and n listed underneath to see the average, the spread, and how many numbers you entered.
Worked example
Imagine six customers rated their wait time in minutes: 12, 15, 15, 18, 22, 30. Paste those into the Data box and leave the Type on Sample. The calculator shows an average (mean) of 18.67 minutes and a standard error of about 2.65 minutes. That means the true average wait time is likely within roughly two of those steps either side of 18.67, so somewhere in the region of about 13 to 24 minutes.
Frequently asked questions
What do I type in the Data box?
Type or paste your numbers, separated by commas, spaces, or new lines, for example 12, 15, 15, 18, 22, 30. You need at least two numbers for it to work.
Where do I get these numbers?
They come from your own results, such as survey ratings, test scores, prices, or wait times. Any list of numbers you have measured or collected will do.
Should I choose Sample or Population?
Choose Sample almost every time, because your numbers usually stand in for a bigger group you did not fully measure. Only choose Population if your list truly covers every single member of the group.
What does the standard error number mean?
It shows how much your average could wobble if you had measured a different group instead. A smaller number means your average is more precise and more reliable.
How is standard error different from standard deviation?
The standard deviation measures how spread out your individual numbers are. The standard error measures how precise your average is, and it gets smaller as you add more numbers.
Get Started with PaperSurvey.io Software
Start your 14-day free trial now, no credit card required.