Variance Calculator
Calculate the variance of your data. Paste your numbers and choose sample or population.
Learn how to calculate it yourselfEnter your values
Results update as you type.
How to enter your data
Type or paste your numbers into the box, separating each one with a comma, a space, or a new line (for example: 7, 8, 9, 10, 11). Only include plain numbers, and add a minus sign in front of any negative value. Do not include words, currency signs, or percent signs.
Variance
Check your inputs
Enter valid values to see your result. Use the field hints or open the data guide for help.
The Variance Calculator measures how spread out a set of numbers is. It looks at how far each number sits from the average of the group, and turns that into a single number. A small result means your numbers are bunched close together and are fairly consistent, while a large result means they are widely scattered. If every number is exactly the same, the variance is zero.
Calculate it yourself
Example: calculate the sample variance of 2, 4 and 6.
Follow this worked example, then repeat the steps with your own numbers.
Calculate the mean
Mean = (2 + 4 + 6) ÷ 3 = 4Add the squared deviations
Squared-deviation total = (2 − 4)² + (4 − 4)² + (6 − 4)² = 8Divide by n − 1 for a sample
Sample variance = 8 ÷ (3 − 1) = 4n is the number of values. Variance is measured in squared units.
If these values are the entire population, divide by n = 3 instead: population variance = 8 ÷ 3 ≈ 2.6667.
Check your answer in the calculatorBuilt into PaperSurvey.io
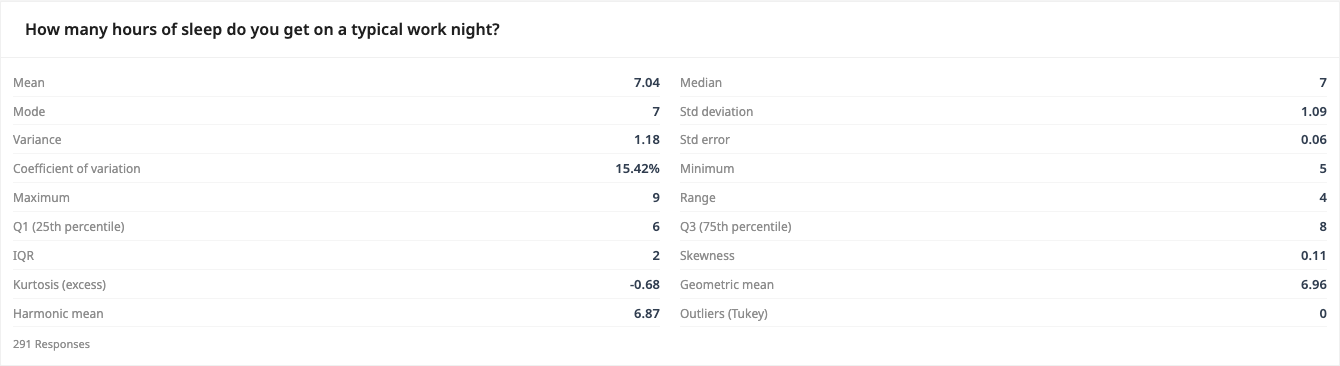
View sample variance alongside standard deviation and other summaries in Descriptive Statistics.
Where it is used
- Teachers: A teacher enters the test scores from one class to see whether pupils performed at a similar level or were spread far apart.
- Small-business owners: A cafe owner types in the number of customers served each day for a week to check how much daily footfall jumps around.
- Customer-service managers: A support manager pastes the star ratings from a batch of feedback forms to see how consistent customer opinions really are.
What is variance?
Variance is the average of the squared differences from the mean. It is the square of the standard deviation. Larger variance means more spread in the data.
When should you use it?
Use this calculator when you have a list of numbers and you want to know how consistent or how varied they are, not just their average. The average alone can hide a lot. Two classes can share the same average score while one is steady and the other is all over the place. Variance shows that difference. It is handy for test scores, daily sales, wait times, survey ratings, or any measurement where you care about how much the values bounce around.
What does the result mean?
The result is a single number showing how far your values typically fall from the average. A larger number means more spread and less consistency. A smaller number means the values are close together. Zero means every value is identical. There is no universal good or bad figure, because the size depends on your own numbers and their scale. To judge it, compare the variance for one group against another similar group, or take the square root of it to get the standard deviation, which is in the same units as your data and is easier to picture.
Mistakes to avoid
Do not mix different things in one list, such as prices and ages, because the result becomes meaningless. Enter your actual numbers, not percentages or rounded guesses, or the spread will be off. Remember that variance is in squared units, so it is not directly comparable to your original values. Watch the sample versus population choice: use population when your list is the whole group, and sample when it is only a portion you are using to estimate a bigger group. Finally, double-check for typos, since one wrong digit can swing the result a lot.
How to use this calculator
- Type or paste your numbers into the box, separating each one with a comma, space, or new line.
- Choose whether your list is the whole group (population) or just a sample of a bigger group.
- Press the calculate button to see the variance for your numbers.
- Read the result: a bigger number means more spread, a smaller number means the values are more alike.
Worked example
Say five students score 7, 8, 9, 10 and 11 on a quiz. The average is 9. Each score sits a little above or below that average, and when you combine those gaps the calculator gives a sample variance of 2.5. That fairly small number tells you the scores were close together and the class performed pretty consistently.
Frequently asked questions
What do I type into the box?
Just your numbers, one after another, separated by commas, spaces, or new lines. For example, type 7, 8, 9, 10, 11.
Where do I get these numbers?
They come from whatever you are measuring, such as test scores, daily sales counts, wait times, or survey ratings. Copy them straight from your spreadsheet, register, or feedback forms.
What does the final number actually tell me?
It tells you how spread out your values are. A small number means they are close together and consistent; a large number means they are widely scattered.
What is the difference between sample and population variance?
Choose population if your numbers are the complete group you care about. Choose sample if they are only a portion you are using to estimate a larger group. Sample gives a slightly larger result.
Why is variance harder to read than standard deviation?
Variance is in squared units, so it does not match your original numbers. Take the square root of the variance to get the standard deviation, which is in the same units and easier to understand.
Get Started with PaperSurvey.io Software
Start your 14-day free trial now, no credit card required.