Coefficient of Variation Calculator
Compare the spread of different datasets. The coefficient of variation is the standard deviation as a percentage of the mean.
Learn how to calculate it yourselfEnter your values
Results update as you type.
How to enter your data
Type your numbers into the box one after another, separating each one with a comma, a space, or the Enter key. You can also paste a whole column of numbers copied straight from a spreadsheet. Enter plain numbers only, with no dollar signs, percent signs, or words.
Coefficient of variation
Check your inputs
Enter valid values to see your result. Use the field hints or open the data guide for help.
The Coefficient of Variation Calculator measures how spread out a set of numbers is, compared to their average. It gives you one figure, usually a percentage, that tells you whether your values stay close together or jump around a lot. A low percentage means your numbers are consistent and steady; a high percentage means they vary a great deal.
Calculate it yourself
Example: express the sample spread of 2, 4 and 6 relative to their mean.
Follow this worked example, then repeat the steps with your own numbers.
Calculate the mean
Mean = (2 + 4 + 6) ÷ 3 = 4Calculate the sample standard deviation
SD = √[((2 − 4)² + (4 − 4)² + (6 − 4)²) ÷ (3 − 1)] = 2Express the spread as a percentage of the mean
CV = SD ÷ mean × 100 = 2 ÷ 4 × 100 = 50%
Use CV for positive measurements with a meaningful zero, such as lengths or costs. A mean close to zero makes CV unstable. Choosing population uses n instead of n − 1 in the standard deviation.
Check your answer in the calculatorBuilt into PaperSurvey.io
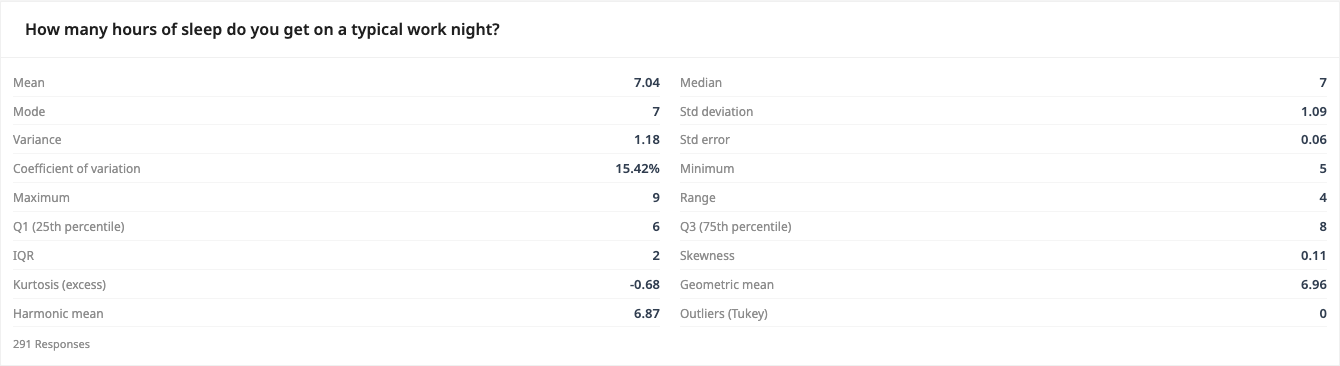
Compare relative spread across suitable numeric survey measures using the coefficient of variation row.
Where it is used
- Teachers: A teacher enters the test scores from two classes to see which class had more consistent results, even though the class averages were different.
- Small-business owners: A shop owner types in the daily takings for a fortnight to check whether sales stay steady or swing wildly from day to day.
- HR and team managers: An HR officer compares the monthly overtime hours of two teams to find out whose workload is more even and predictable.
When to use CV
The coefficient of variation lets you compare variability between datasets with different units or very different means, because it expresses spread relative to the average rather than in absolute terms.
When should you use it?
Use it when you want to know how consistent a set of numbers is, not just their average. It is most helpful when you are comparing two or more groups that have different sizes or different averages, because it puts everything onto the same scale, a percentage. For example, you can compare how steady daily sales are in a large shop and a small shop, or how consistent test scores are in two different classes. If all you care about is the average, you do not need this tool.
What does the result mean?
The result is usually shown as a percentage. It tells you how big the spread in your numbers is compared to their average. A small percentage means the numbers stay close to the average and are consistent. A large percentage means they jump around a lot. There is no single official cut-off, but as a rough guide many people treat under about 10 percent as low, meaning very steady, 10 to 30 percent as moderate, and above 30 percent as high. Lower usually means more predictable.
Mistakes to avoid
Do not use it when your average is zero or close to zero, because the percentage then becomes huge or meaningless. Avoid it with numbers that can be negative, such as profit and loss figures or temperatures, since the result stops making sense. It only works for things measured on a true number scale, like money, counts, time, or weight, not for star ratings that are really just labels. Also, do not compare the result across completely different kinds of things and assume the smaller one is always better.
How to use this calculator
- Type or paste your list of numbers into the box, separating each one with a comma, a space, or the Enter key.
- Check that you have entered plain numbers only, with no words or currency symbols.
- Let the calculator work out the result, which is shown as a percentage called the coefficient of variation.
- Read the percentage: a low number means your values are consistent, while a high number means they vary a lot.
Worked example
Say a café records how many customers it gets over five days: 90, 95, 100, 105, and 110. The average is 100. The numbers spread out from that average by about 8 (the standard deviation is roughly 7.9). Dividing the spread by the average gives a coefficient of variation of about 8 percent. Because 8 percent is low, it means the café's daily customer numbers are fairly steady from one day to the next.
Frequently asked questions
What do I type in the box?
Type your list of numbers one after another, separating each with a comma, a space, or the Enter key. You can also paste a column of numbers copied from a spreadsheet.
Where do I get these numbers?
They come from whatever you are measuring, such as daily sales, test scores, wait times, or survey answers. Any real record or spreadsheet of values will do.
What does the percentage actually mean?
It shows how spread out your numbers are compared to their average. A low percentage means they are consistent, and a high percentage means they vary a lot.
Is a high or low result better?
Usually lower is better, because it means your numbers are steadier and more predictable. But it depends on your goal, and sometimes more variety is perfectly fine.
Can I enter money or percent signs?
No. Enter plain numbers only. Leave out dollar signs, percent signs, and words, or the calculator may not read your figures correctly.
Get Started with PaperSurvey.io Software
Start your 14-day free trial now, no credit card required.