Before you act on test scores, it is worth asking whether the test itself is trustworthy. Reliability comes in two flavors. Internal consistency asks whether your questions pull in the same direction, so the total score measures one thing rather than noise. Inter-rater agreement asks whether two people scoring the same work reach the same verdict. PaperSurvey computes the first kind directly on your graded responses. For the second kind, the app gives you the agreement matrix and you finish the job with the free Cohen's Kappa Calculator. This article walks through both using the Customer Service Training Assessment demo survey, a graded quiz with 12 single-choice questions worth 14 points in total (two questions are worth 2 points), a 70% pass threshold, and 250 responses.
Add the Reliability & Consistency block
Internal consistency lives in one block on an analysis view. It requires grading to be switched on and answer keys set, the same setup described in Test and Exam Analysis Charts.
- Open the survey and go to Analysis.
- Open an analysis view tab, or create one with + New View.
- Click Edit, then Add to open the Add blocks drawer.
- In the Quiz category, pick Reliability & Consistency ("Cronbach's alpha, KR-20 and standard error of measurement for your graded questions").
If grading is not enabled, the card is greyed out in the drawer with the hint "Enable grading on this survey". The block also needs at least two graded questions and two respondents before it shows numbers. You rarely have to add it by hand: the Assessment Report view template and the Smart Report builder place it automatically for graded surveys, and the Test Results card on the Results tab has a Save to View entry named Reliability.
Reading the card on real data
Here is the block on the 250 training assessments:
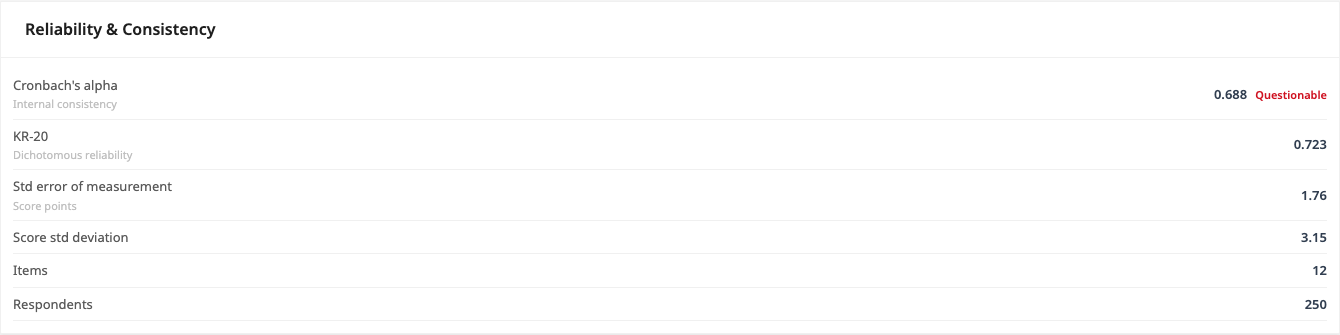
- Cronbach's alpha 0.688, labelled "Questionable" in red. The badge thresholds are Excellent at 0.9 and above, Good at 0.8, Acceptable at 0.7, and Questionable below that. The honest red label is doing you a favor: at 0.688 the total score is usable for group-level conclusions, but you should be cautious about high-stakes decisions on individual respondents.
- KR-20 0.723, the reliability estimate for dichotomous right/wrong items.
- Std error of measurement 1.76 score points.
- Score std deviation 3.15, plus Items 12 and Respondents 250.
Why do alpha and KR-20 disagree? Alpha is computed on the raw item point scores, where the two 2-point questions carry more weight. KR-20 first reduces every item to right or wrong. When all items are 1-point right/wrong questions, the two figures coincide. If your test uses negative marking (deducted points for wrong answers) or unequal point weights, the alpha row is the safer figure, because KR-20 assumes plain right/wrong items. Questions with zero points are excluded from the reliability calculation entirely.
How the numbers are computed
The in-app math matches the free calculators exactly, so you can reproduce every figure by hand.
- KR-20 dichotomizes each response: a score above 0 becomes 1, anything else becomes 0, and a missing answer counts as 0 (incorrect). It then applies (k/(k-1)) × (1 − Σpq / total score variance). The KR-20 Calculator accepts a pasted 0/1 matrix and runs the identical formula.
- Cronbach's alpha runs the same idea on raw item scores instead of 0/1 values. The Cronbach's Alpha Calculator takes a pasted item-score matrix, which is how you check reliability for a test that was not graded in PaperSurvey.
- Standard error of measurement is score SD × sqrt(1 − reliability), using Cronbach's alpha and falling back to KR-20 when alpha cannot be computed. The row shows a dash if reliability falls outside 0 to 1. You can verify the card: 3.15 × sqrt(1 − 0.688) = 1.76. The Standard Error of Measurement Calculator does the same from any SD and reliability pair.
SEM is expressed in score points on your test's own point scale, not percentages, and it appears only in this block, not on the Results tab. The Score std deviation row matches the Std Dev 3.15 shown in the Score Distribution view of the Test Results card:
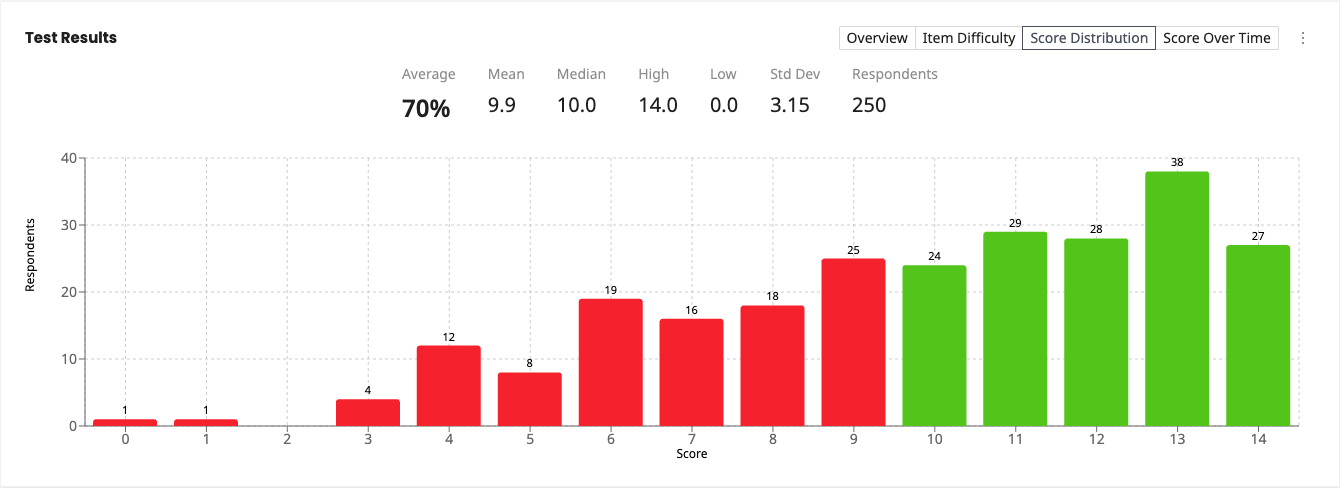
SEM is the most practical number on the card. It says an individual's observed score sits roughly within ±1.76 points of their "true" score about two thirds of the time. On this 14-point test the pass threshold is 70%, which is 9.8 points, so a respondent scoring 9 is well within one SEM of passing. Treat pass/fail decisions in that band with care rather than reading a 9 versus a 10 as a meaningful difference.
Rater agreement is a different question
Suppose two trainers independently grade the same 80 role-play exercises into bands (Excellent, Good, Fair, Poor). Percent agreement overstates consistency because some agreement happens by chance. Cohen's kappa corrects for that, and to be explicit: PaperSurvey does not compute kappa anywhere in the app. What it does give you is a clean agreement matrix and exports, and the Cohen's Kappa Calculator finishes the calculation.
Set up a double-coding sheet as its own survey:
- Create one Single choice question per rater, for example "Rater A: overall band" and "Rater B: overall band", with identical option lists in identical order. Use Single choice, not Multiple choice, so each rater contributes exactly one answer.
- Record one entry per rated subject, with both questions answered on the same entry. Pairing happens per entry, so a form where only one rater answered contributes nothing.
Then build the agreement matrix:
- Go to Analysis, then Compare Responses, and pick the Rater A question under "How do responses differ based on:".
- Switch the toggle in the top right to Advanced, set the view control to Table, and choose Counts only.
The resulting Rater A × Rater B table is the agreement matrix. Because both questions share the same option order, the diagonal cells are the agreements. Click Workbook to download the comparison as Excel; its Observed Frequencies sheet holds the same matrix, ready to copy into the calculator's matrix box.
One caution: the stats line under that card shows chi-square and Cramér's V. Those measure association, not agreement. Two harsh-versus-lenient raters can produce a highly significant chi-square while rarely agreeing, so never quote the cross-tab statistics as kappa. As a plain-arithmetic illustration, if the raters agree on 60 of 80 essays, observed agreement is 75%; if the marginals put chance agreement at 40%, kappa = (0.75 − 0.40) / (1 − 0.40) = 0.58, a much more sober figure than "75% agreement".
Exporting for SPSS or R
For weighted kappa, confidence intervals, or more than two raters, export the raw data. On the Responses tab, click Export and pick a File type in the Export Data modal:
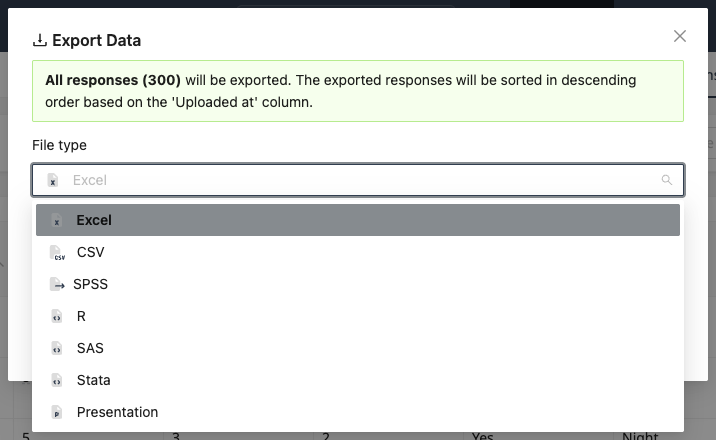
- SPSS produces a .sav file. Set Cell Values to Recoded Values so the rating bands export as numeric codes, then run CROSSTABS with /STATISTICS=KAPPA.
- R produces a zip with data.sav plus an import_script.R. Load it and run irr::kappa2 for two raters, or psych::cohen.kappa for weighted variants.
The same exports let you rerun alpha or KR-20 on any subset, for example checking whether reliability holds within a single department using the filters described in Filtering Data in Analysis.
Next steps
- Item Analysis for Tests: Difficulty and Discrimination Index Explained shows which individual questions drag reliability down.
- Test and Exam Analysis Charts covers the Test Results card, grading setup and answer keys.
- Exporting Survey Data details every export format and cell value option.
- Try the free calculators: Cronbach's Alpha Calculator, KR-20 Calculator, Standard Error of Measurement Calculator and Cohen's Kappa Calculator.