Cronbach's Alpha Calculator
Measure the internal consistency of a scale. Paste a matrix with one respondent per line and their score on each item separated by commas or spaces.
Learn how to calculate it yourselfEnter your values
Results update as you type.
How to enter your data
Enter your answers as a grid of numbers. Put one person (one respondent) on each line, and on that line list their score for each question, separated by commas or spaces. Every line must have the same number of scores, one per question, and you need at least two people and at least two questions.
Cronbach's alpha
Check your inputs
Enter valid values to see your result. Use the field hints or open the data guide for help.
Cronbach's alpha checks whether a group of survey or test questions that are all meant to measure the same thing actually work together as a set. This calculator takes everyone's answers to those questions and gives you a single number, usually between 0 and 1, that shows how consistent the questions are. A higher number means the questions hang together well and can be trusted to give one dependable, combined score.
Calculate it yourself
Example: three respondents answered three items, with rows (1, 1, 2), (2, 3, 2) and (3, 2, 5).
Follow this worked example, then repeat the steps with your own numbers.
Find each item’s mean
Item means: (1 + 2 + 3) ÷ 3 = 2; (1 + 3 + 2) ÷ 3 = 2; (2 + 2 + 5) ÷ 3 = 3Calculate each sample variance
s₁² = (1 + 0 + 1) ÷ 2 = 1; s₂² = (1 + 1 + 0) ÷ 2 = 1; s₃² = (1 + 1 + 4) ÷ 2 = 3Each numerator adds squared distances from that item’s mean. Divide by respondents minus one: 3 − 1 = 2.
Add the item variances
Sum of item variances = 1 + 1 + 3 = 5Calculate the variance of respondent totals
Totals = 4, 7, 10; mean total = 7; sTotal² = [(4 − 7)² + (7 − 7)² + (10 − 7)²] ÷ 2 = 9Apply the alpha formula
α = k ÷ (k − 1) × [1 − sum of item variances ÷ sTotal²] = 3 ÷ 2 × (1 − 5 ÷ 9) ≈ 0.667k is the number of items, here 3.
The tiny matrix is for learning the arithmetic, not judging a real scale. Reverse-score negatively worded items first when required. Alpha alone does not show that all items measure one construct.
Check your answer in the calculatorBuilt into PaperSurvey.io
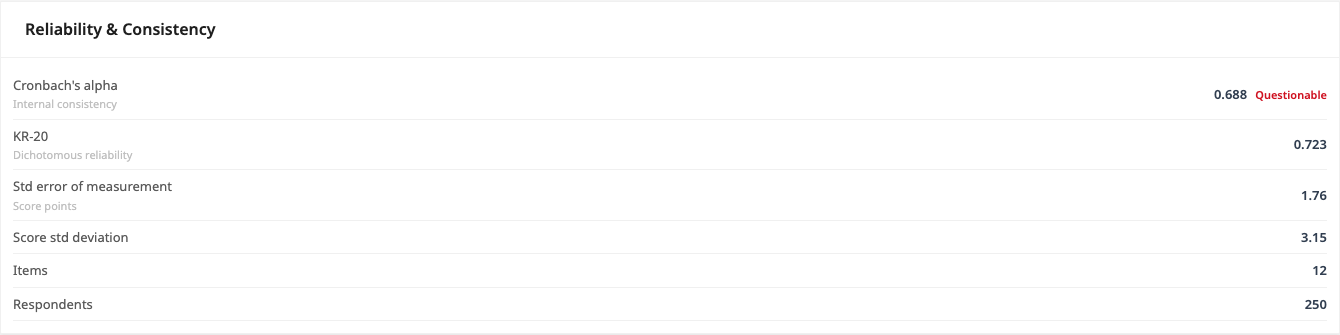
Add Reliability & Consistency to an analysis view to check internal consistency from graded item scores.
Where it is used
- Teachers: A teacher checks whether the ten questions on a new confidence quiz all measure the same feeling before trusting the total score.
- HR staff: An HR officer tests whether the questions in a staff engagement survey belong together before reporting the results to managers.
- Market researchers: A researcher confirms that five statements about brand trust move together so they can be safely combined into one trust score.
What Cronbach's alpha measures
Cronbach's alpha estimates how consistently the items in a scale measure the same underlying construct. It ranges up to 1. A value of 0.70 or above is generally considered acceptable for research; 0.80 or above is good.
When should you use it?
Use this when you have several questions that are all supposed to measure the same single idea, such as job satisfaction or customer trust, and you want to combine them into one score. It is common with rating scales, like questions answered from 1 to 5 (often called Likert scales). Run it before you add the questions together or report an average, so you know the questions really belong as a set. It is not meant for one-off questions that each measure something different.
What does the result mean?
The result is a single number, usually between 0 and 1. The closer it is to 1, the more consistently your questions measure the same thing. A widely used guide is that 0.70 or above is acceptable, and 0.80 or above is good. Below 0.70 suggests the questions are not holding together well, and you may need to reword or drop some. A very high value, above about 0.95, can mean some questions are almost repeats of each other.
Mistakes to avoid
Do not mix questions about different topics in the same grid; the score only makes sense when every question aims at one idea. Give each person their own line, and make sure every line has the same number of scores, or the calculator cannot run. Reverse-worded questions, where agreeing means the opposite, must be flipped to match the others first, or your value will be too low. Finally, do not treat a high number as proof your survey is perfect; it only checks consistency, not whether you measured the right thing.
How to use this calculator
- Type or paste your answers into the box, with one person on each line.
- On each line, list that person's score for every question, separated by commas or spaces, keeping the same number of scores on every line.
- Check that you have entered at least two questions and at least two people.
- Read the alpha value shown: it tells you how consistent your questions are, with 0.70 and above generally counted as acceptable.
Worked example
A teacher has a four-question confidence survey answered by four students on a 1 to 5 scale. She enters four lines: 4, 5, 4, 5 then 3, 3, 4, 3 then 5, 5, 5, 4 then 2, 3, 2, 3. The calculator returns a Cronbach's alpha of 0.926, which counts as excellent, so the four questions clearly measure the same thing and can be combined into one score.
Frequently asked questions
How should I format my data?
One row per respondent, one column per item. So a 4-item questionnaire answered by 10 people is 10 lines of 4 numbers each.
What do I type in each box?
Type your answers as a grid of numbers. Each line is one person, and the numbers on that line are their scores for each question, separated by commas or spaces.
Where do I get these numbers?
They come from your survey or test answers, usually rating-scale scores like 1 to 5. If you use PaperSurvey, scanned paper and online responses become a table you can copy straight in.
What does the final number mean?
You get one value, usually from 0 to 1. Around 0.70 or higher is generally seen as acceptable, and 0.80 or higher as good.
How many questions and people do I need?
You need at least two questions and at least two people. More of each gives a more trustworthy result, and the value usually rises as you add more well-matched questions.
Can I use it for yes or no questions?
You can, but the special version for right/wrong or yes/no items is called KR-20. For rating scales with a range of numbers, Cronbach's alpha is the right choice.
Get Started with PaperSurvey.io Software
Start your 14-day free trial now, no credit card required.