When grading is enabled on a survey and answer keys are set, PaperSurvey automatically shows test-specific analysis charts. These charts help you understand overall performance, identify difficult questions, and see how scores are distributed across respondents.
Test Results Overview
When you open the Results tab for a graded survey, a Test Results card appears at the top of the page. The overview shows summary statistics and a list of frequently missed questions.
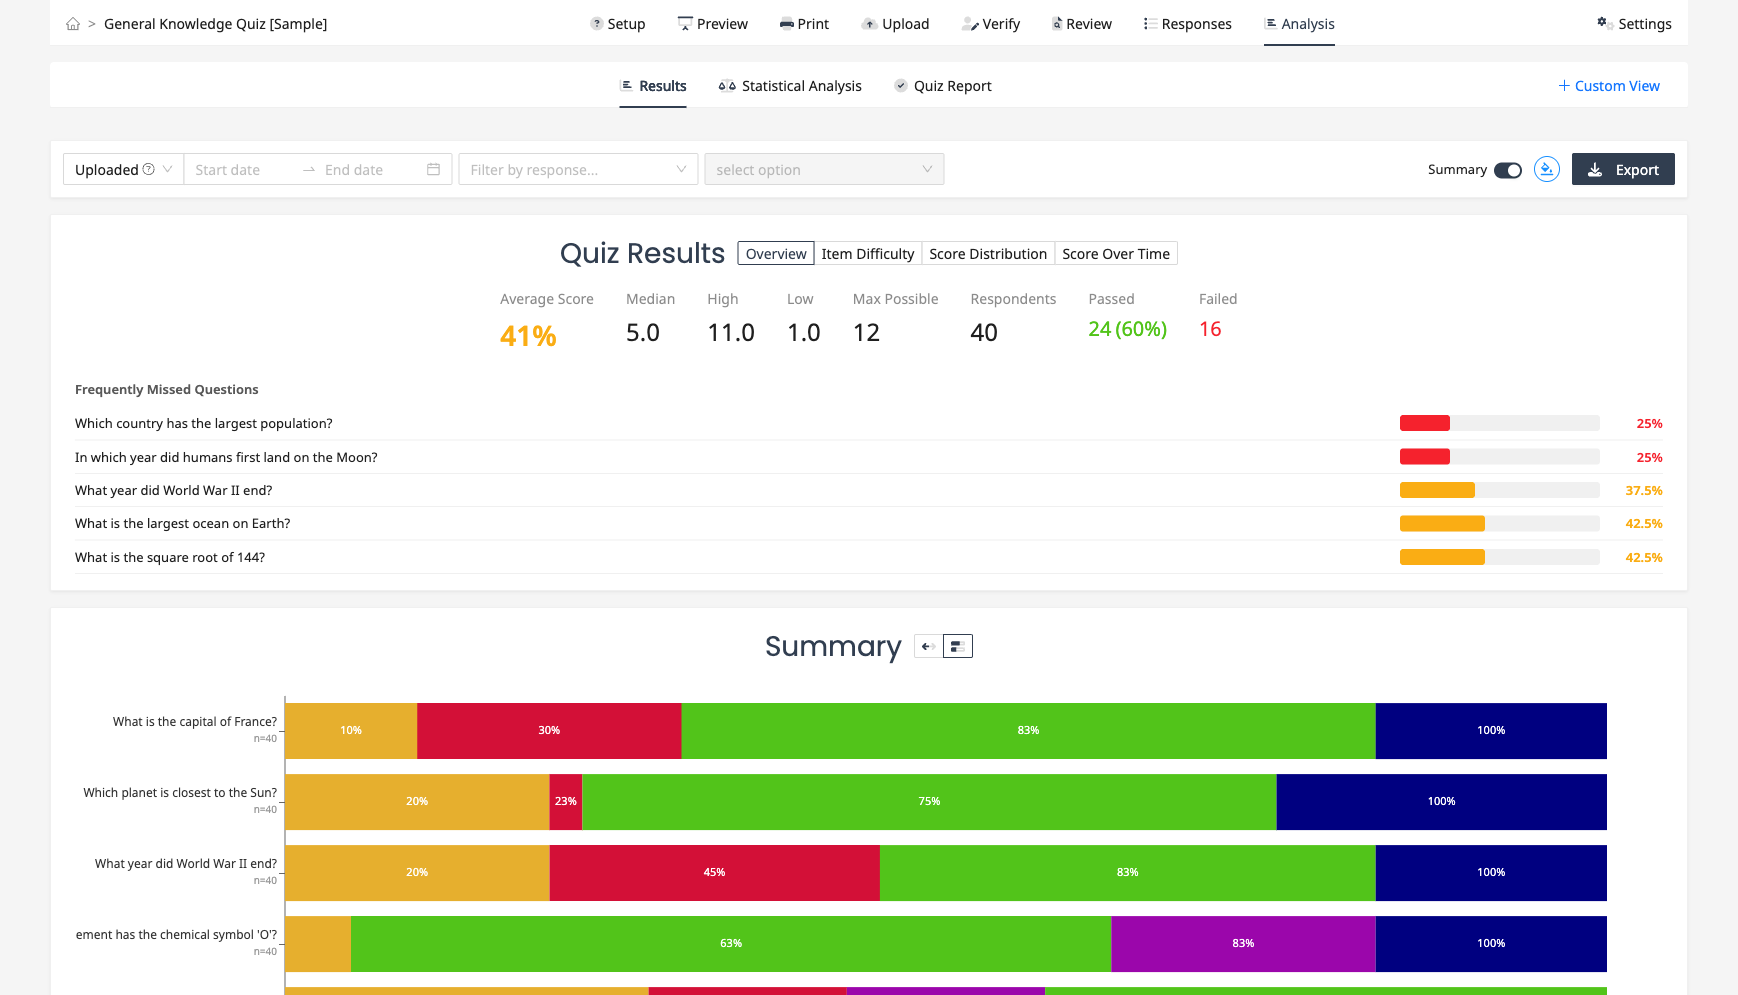
What it shows:
- Average score as a percentage, with color coding (green for strong, yellow for moderate, red for weak performance)
- Median, high, and low scores, plus the maximum possible score
- Number of respondents
- Pass and fail counts (when a pass threshold is configured)
- The five most frequently missed questions, with progress bars showing the percentage of respondents who answered correctly
Score Distribution
The Score Distribution view shows a histogram of total scores across all respondents. Each bar represents a score value, and the height shows how many respondents achieved that score.
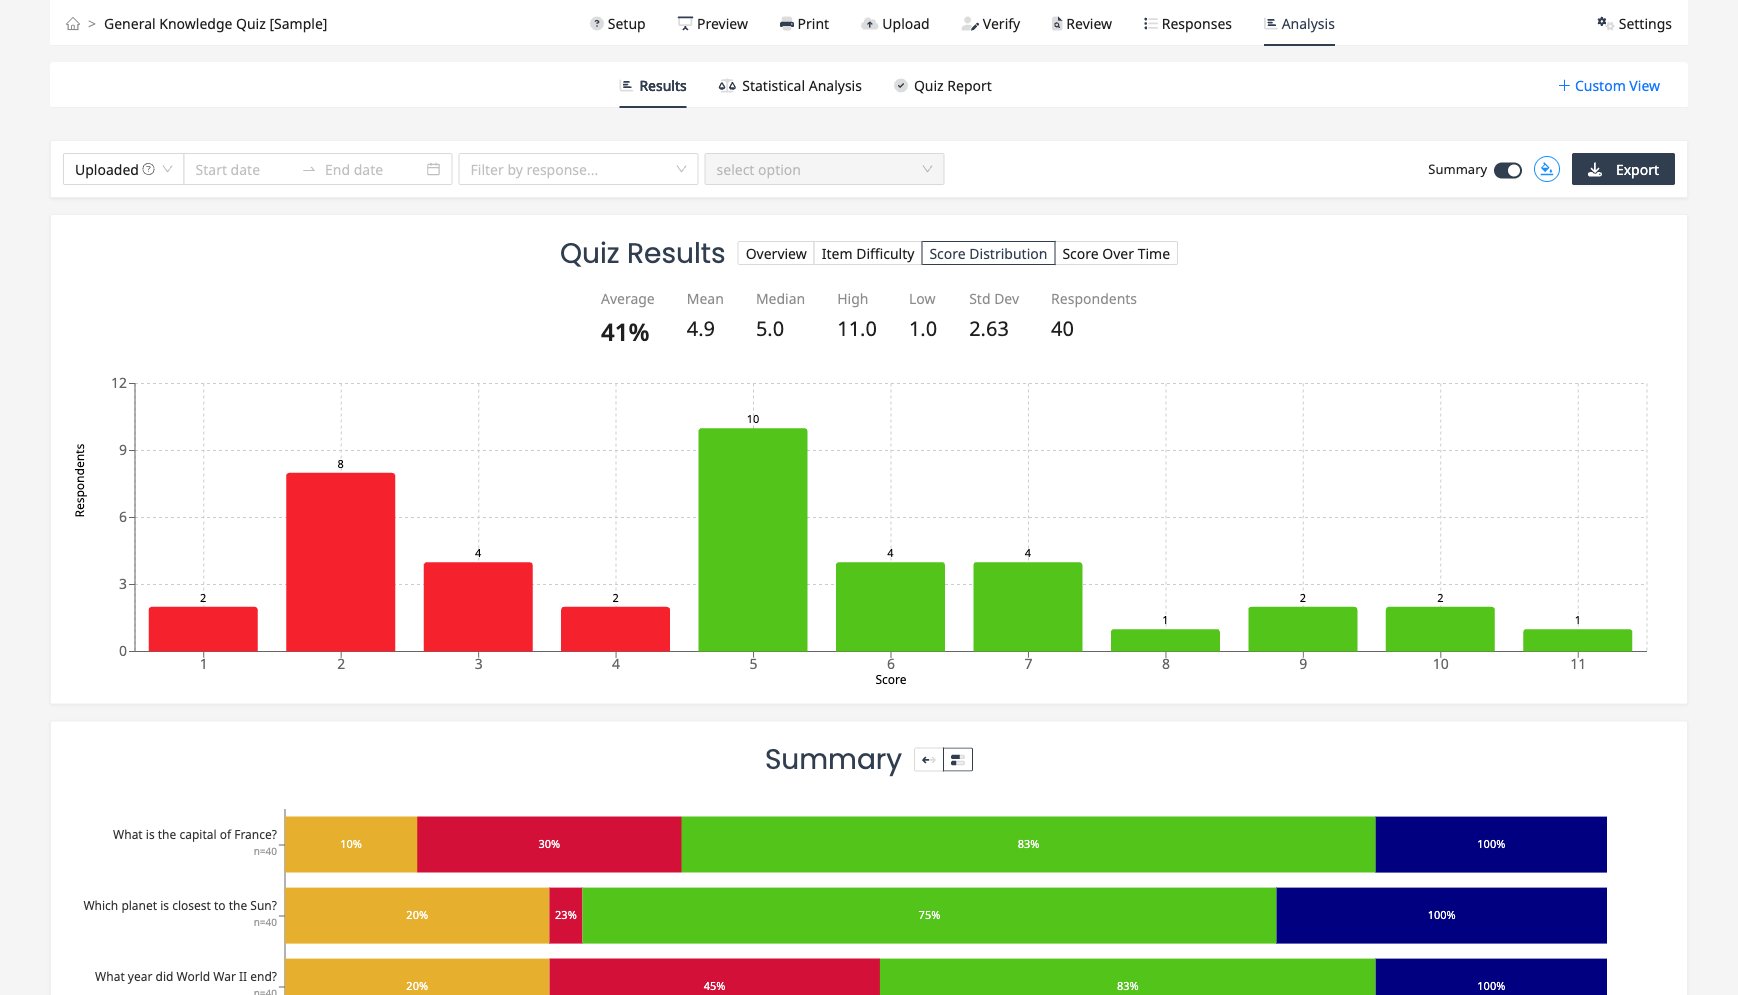
Best for: Understanding the overall spread of performance. A bell-shaped curve suggests a well-designed test. A skew toward high scores suggests the test was too easy, while a skew toward low scores suggests it was too difficult. When a pass threshold is set, bars are colored green (pass) or red (fail) with a reference line at the threshold.
Item Difficulty
The Item Difficulty view shows a horizontal bar for each graded question, sorted from hardest to easiest. Bars are color-coded by difficulty zone.
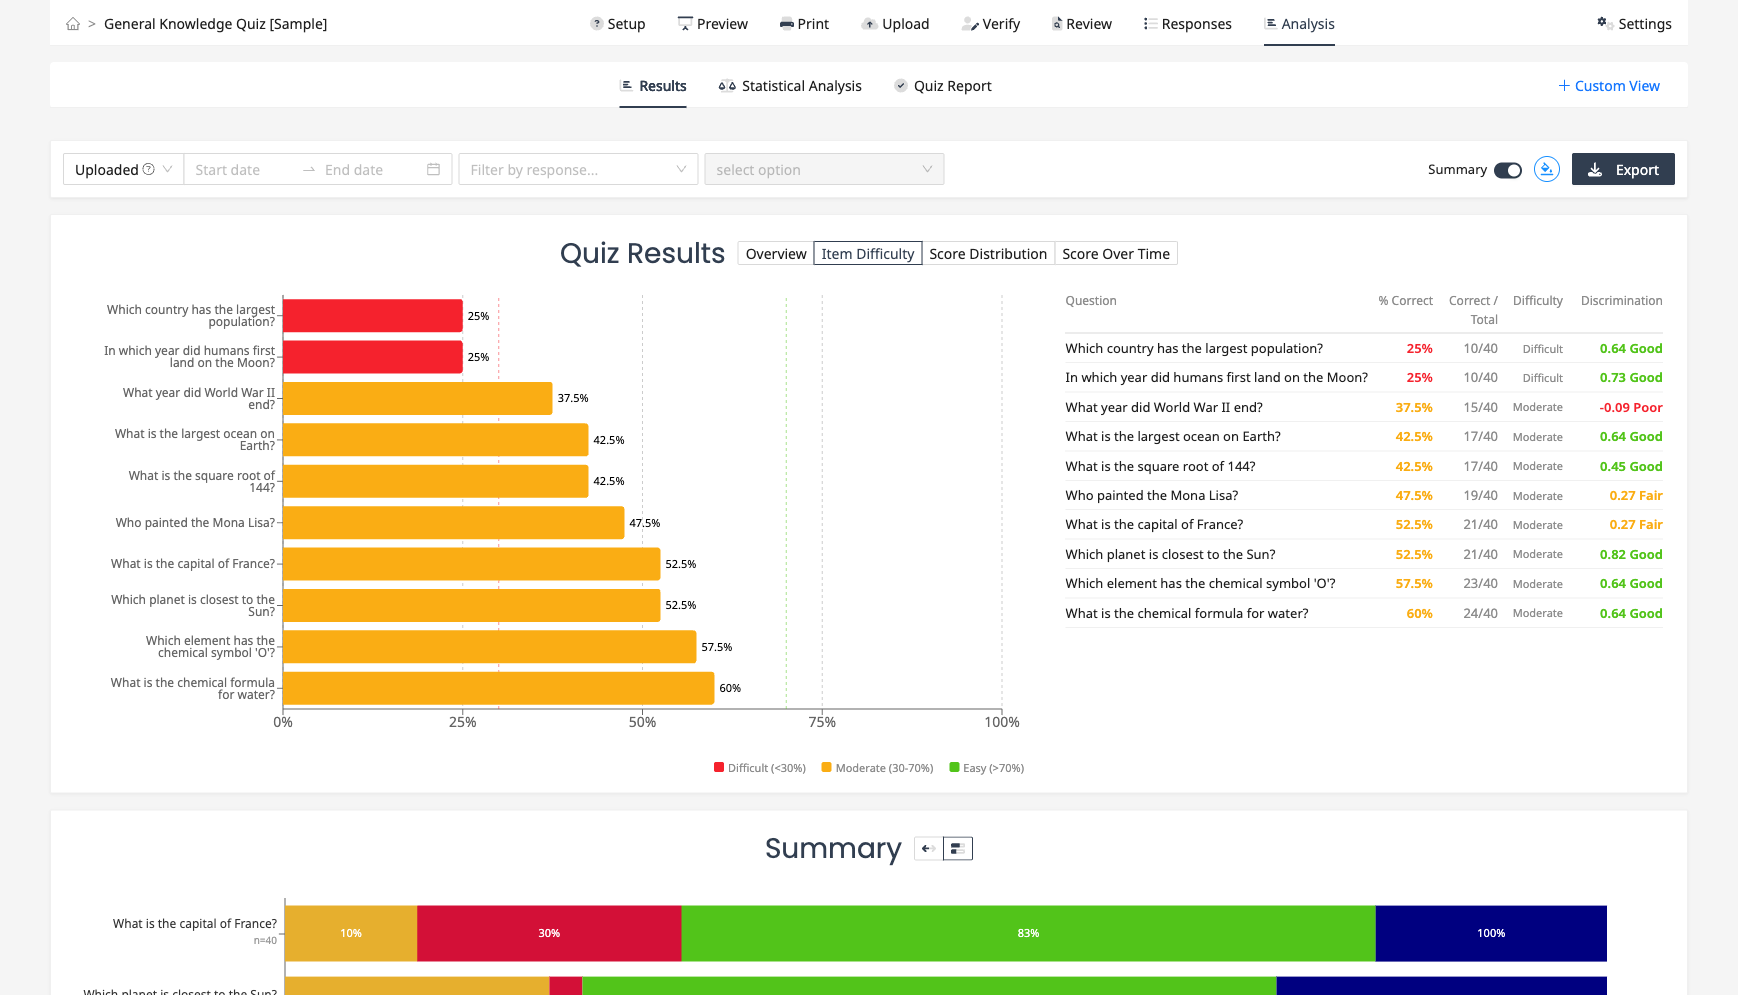
Color coding:
- Green bars indicate easy questions (more than 70% of respondents answered correctly)
- Yellow bars indicate moderate difficulty (30% to 70% correct)
- Red bars indicate difficult questions (fewer than 30% correct)
Reference lines at 30% and 70% help you quickly identify questions in each zone. A side table shows the exact percentage, count, difficulty level, and discrimination index for each question. Hover over column headers for explanations.
Discrimination index measures how well a question differentiates between high-scoring and low-scoring respondents. A value above 0.3 means the question is a good differentiator. Below 0.15 suggests the question may need revision.
Score Over Time
The Score Over Time view shows how average test scores change across time periods (daily, weekly, or monthly). A line tracks the average score, while bars show the number of respondents per period.
Best for: Monitoring performance trends when a test is administered over an extended period. When a pass threshold is set, the bars split into green (passed) and red (failed) counts, and a reference line shows the threshold.
Correct and Incorrect Highlighting
For individual question charts (bar, horizontal bar, pie), answer options are automatically color-coded when an answer key is set.
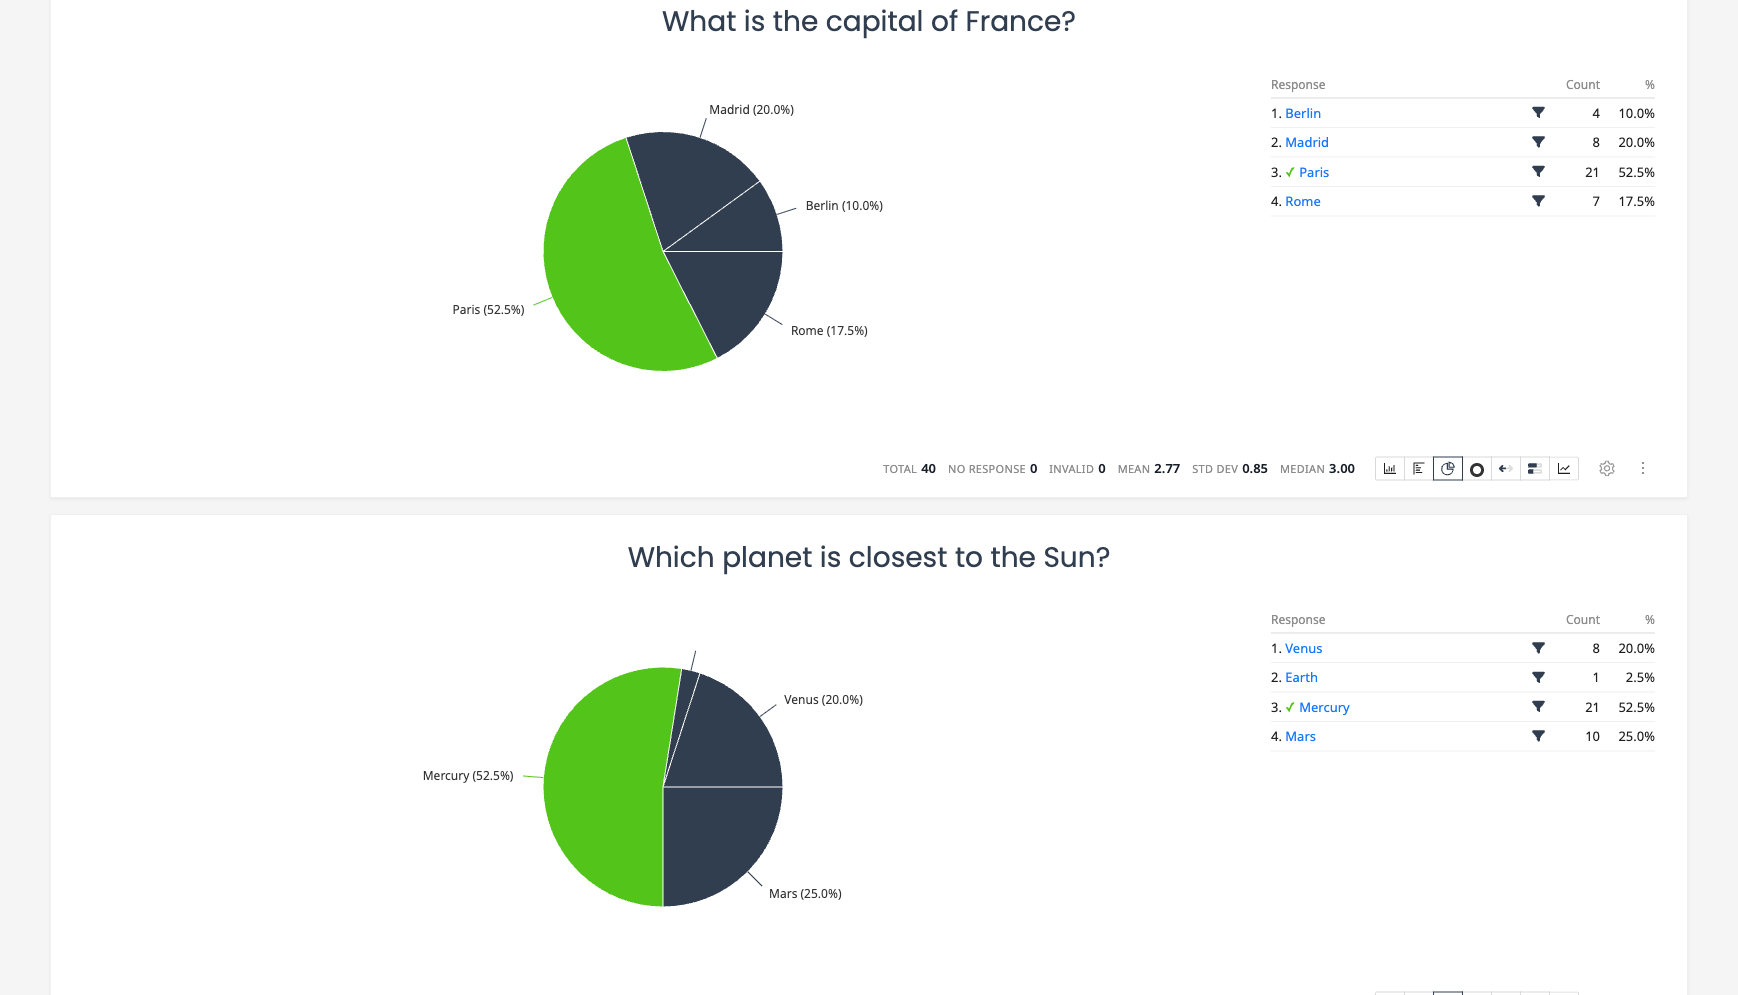
- Green indicates the correct answer, with a checkmark in the response table
- Red indicates an incorrect answer (if marked in the answer key)
- Other options use the standard chart color
This highlighting also appears in the Summary view (stacked distribution and diverging bar charts), where the correct answer segment is shown in green across all questions.
Pass Threshold
You can set a pass threshold as a percentage (e.g., 70%) in Settings under the Grading section. When configured:
- The Test Results overview shows pass and fail counts
- The Score Distribution chart colors bars green (pass) or red (fail)
- The Responses table shows a Pass/Fail column
- CSV and Excel exports include a Pass/Fail column
- Respondents see their pass or fail status after submitting a web survey
Setting Up Grading
To enable test analysis charts:
- Open your survey and go to Settings
- Turn on "Activate test grading" in the Grading section
- Optionally set a pass threshold percentage
- For each question you want to grade, click the question menu and select "Answer Key"
- Mark the correct answer and set the point value
- Once responses are collected, the Test Results card will appear automatically on the Results tab
Saving Test Charts to a Dashboard
You can save test analysis charts as widgets on your analysis dashboard. The widget types available for graded surveys are Test Summary, Score Distribution, Item Difficulty, and Reliability. These widgets update automatically as new responses come in.