Standard Error of Measurement Calculator
Estimate the measurement error of a test score. Enter the score standard deviation and the reliability coefficient.
Learn how to calculate it yourselfEnter your values
Results update as you type.
How to enter your data
This calculator has two boxes. In the first box, type the standard deviation of your scores. In the second box, type the test's reliability as a decimal between 0 and 1, for example 0.85. Both boxes accept plain numbers, and you can include a decimal point.
Standard error of measurement
The Standard Error of Measurement, or SEM, tells you how much a test score might change if the same person sat the test again. In plain terms, it is the margin of error around a single score. This calculator works it out from two numbers about your test: how spread out the scores are (the standard deviation) and how consistent the test is (its reliability).
Calculate it yourself
Suppose test scores have a standard deviation of 10 points and reliability of 0.84.
Follow this worked example, then repeat the steps with your own numbers.
Find the unreliability
1 − reliability = 1 − 0.84 = 0.16.Take its square root
√0.16 = 0.4.Multiply by the score standard deviation
SEM = SD × √(1 − reliability) = 10 × 0.4 = 4 points.
SEM describes measurement uncertainty for individual scores. It is different from the standard error of a sample mean. Enter reliability as a coefficient between 0 and 1.
Check your answer in the calculatorBuilt into PaperSurvey.io
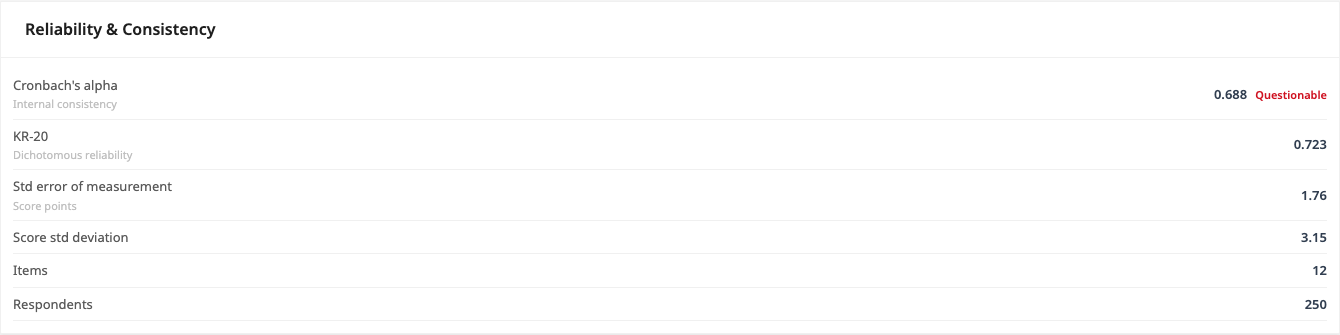
Read the standard error of measurement in Reliability & Consistency to assess uncertainty in individual test scores.
Where it is used
- Teachers: A teacher checks how much a pupil's exam mark could wobble, so a 72 is not treated as clearly better than a 70 when the margin of error overlaps.
- HR and hiring staff: An HR officer using a scored aptitude test works out whether two candidates' scores are genuinely different or just within the normal margin of error.
- Survey and research teams: A researcher reporting questionnaire scores adds a plus-or-minus range so readers can see how precise each score really is.
What SEM tells you
The standard error of measurement estimates how much an individual’s observed score is likely to vary from their true score. It is calculated as SD × √(1 − reliability), so higher reliability means smaller measurement error.
When should you use it?
Use this calculator when you have a set of test, quiz, or questionnaire scores and you want to know how trustworthy a single person's score is. It fits any situation where people get a numeric score and small differences might matter, such as exam marks, aptitude tests, or rating scales. You need two facts about the test first: how spread out the scores were, and a reliability figure showing how consistent the test is. If you have both of those numbers, this tool shows you the likely margin of error around any one score.
What does the result mean?
The result is the Standard Error of Measurement, shown in the same units as the test score. If your scores are exam marks, the answer is in marks. It works like a margin of error: a person's real ability score is likely within about one SEM either side of their actual score roughly 68 percent of the time, and within two SEM about 95 percent of the time. A smaller SEM means a more precise test. There is no single good number, because it depends on your test's own scale.
Mistakes to avoid
The most common slip is entering reliability as a percentage. It must be a decimal between 0 and 1, so type 0.85, not 85. Another is mixing up the standard deviation, which is how spread out the scores are, with the standard error, which is a different figure; this box needs the standard deviation. Make sure both numbers come from the same test and the same group of people. Finally, do not read the SEM as a pass or fail line. It only shows the wobble around a score, not whether the score is good.
How to use this calculator
- Work out the standard deviation of all your scores (a spreadsheet's STDEV function does this) and type it into the first box.
- Enter the test's reliability as a decimal between 0 and 1 in the second box, for example 0.85.
- Let the calculator show you the Standard Error of Measurement.
- Read the result as a plus-or-minus range around any single score to judge how precise that score is.
Worked example
Suppose an exam has a standard deviation of 10 marks and a reliability of 0.84. Enter 10 in the first box and 0.84 in the second. The calculator returns a Standard Error of Measurement of 4 marks. So a student who scored 70 most likely has a true score somewhere between about 66 and 74.
Frequently asked questions
What do I type in each box?
Put the standard deviation of your scores in the first box and the test's reliability in the second. The reliability must be a decimal between 0 and 1, such as 0.80.
Where do I get the standard deviation?
Most spreadsheet programs work it out for you. In Excel or Google Sheets, put all the scores in one column and use the STDEV function. It measures how spread out the scores are.
Where do I get the reliability number?
It usually comes with the test or from your test report. A common measure is called Cronbach's alpha. If you built the test yourself, statistics software or a spreadsheet add-on can calculate it.
What does the answer actually mean?
It is the margin of error for one person's score, in the same units as the score. A person's true ability is likely within about one SEM either side of the score they got.
Is a high or low number better?
A lower number is better, because it means scores are more precise. A high number means a single score could easily have been several points higher or lower just by chance.
Get Started with PaperSurvey.io Software
Start your 14-day free trial now, no credit card required.