After grading a stack of test papers, the next question is about the test itself: which questions were too easy, which were too hard, and which were simply broken? Item analysis answers this with two numbers per question. Difficulty is the percentage of takers who answered correctly, and discrimination measures whether a question separates strong performers from weak ones. PaperSurvey computes both automatically for every graded survey, and the free Item Difficulty Calculator and Discrimination Index Calculator apply the same formulas when you want to verify the math or analyze a test that was not run through PaperSurvey.
This article walks through a real example: the Customer Service Training Assessment demo survey, a graded quiz with 12 single-choice questions worth 14 points in total (two questions carry 2 points each), a 70% pass threshold, and 250 responses.
Set up grading first
Item analysis only appears for graded surveys, so the quiz needs two things before collecting responses:
- Open Settings and turn on Activate test grading in the Grading section. Optionally set a pass threshold, 70% in this example.
- On the Setup tab, open each question's tools menu and choose Answer Key. Tick the correct option under "Correct answers" and set its Points value. You can also assign deduction points under "Incorrect answers" for negative marking.
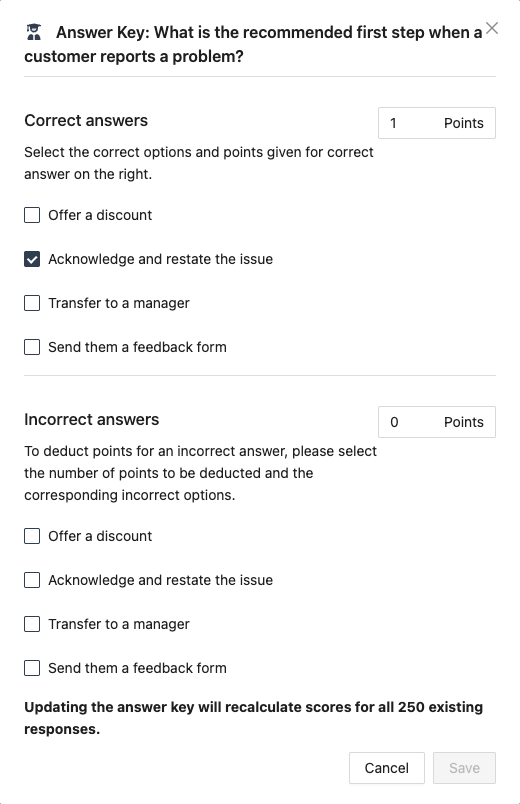
Answer keys can be changed later. As the warning in the modal notes, updating a key recalculates the scores of all existing responses, 250 of them in this demo.
Where item analysis lives
Once responses are in, open Analysis and stay on the Results tab. A Test Results card sits at the top of the page with a view switch: Overview, Item Difficulty, Score Distribution and Score Over Time.
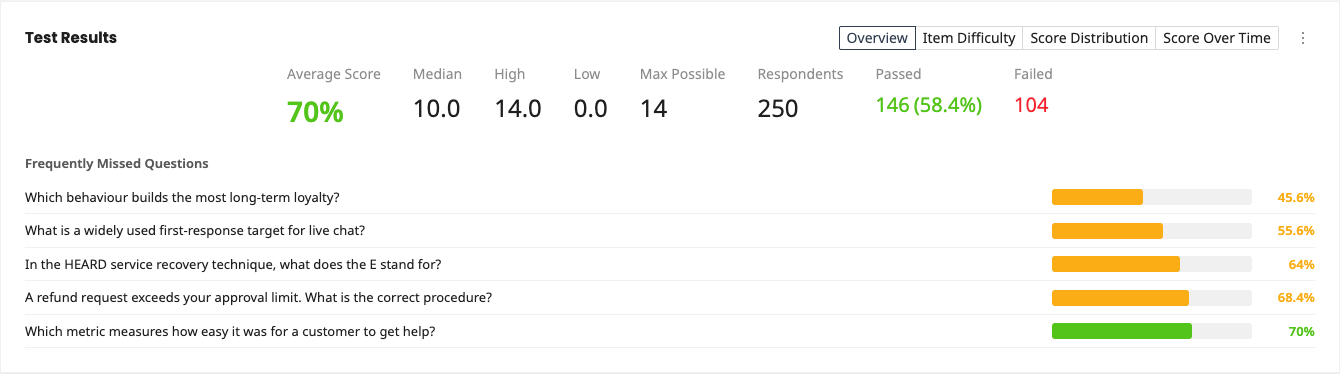
The Overview already hints at where the problems are. For the demo assessment it shows an average score of 70%, a median of 10.0, a high of 14.0 and a low of 0.0 out of a maximum of 14, with 146 of 250 respondents passing (58.4%). Below the summary, the Frequently Missed Questions list shows the five questions with the lowest percentage correct. Here it is topped by "Which behaviour builds the most long-term loyalty?" at 45.6% correct.
Reading item difficulty
Switch the Test Results card to Item Difficulty. Every graded question gets a horizontal bar, sorted hardest first, and a side table with % Correct, Correct / Total, a Difficulty label and a Discrimination value.
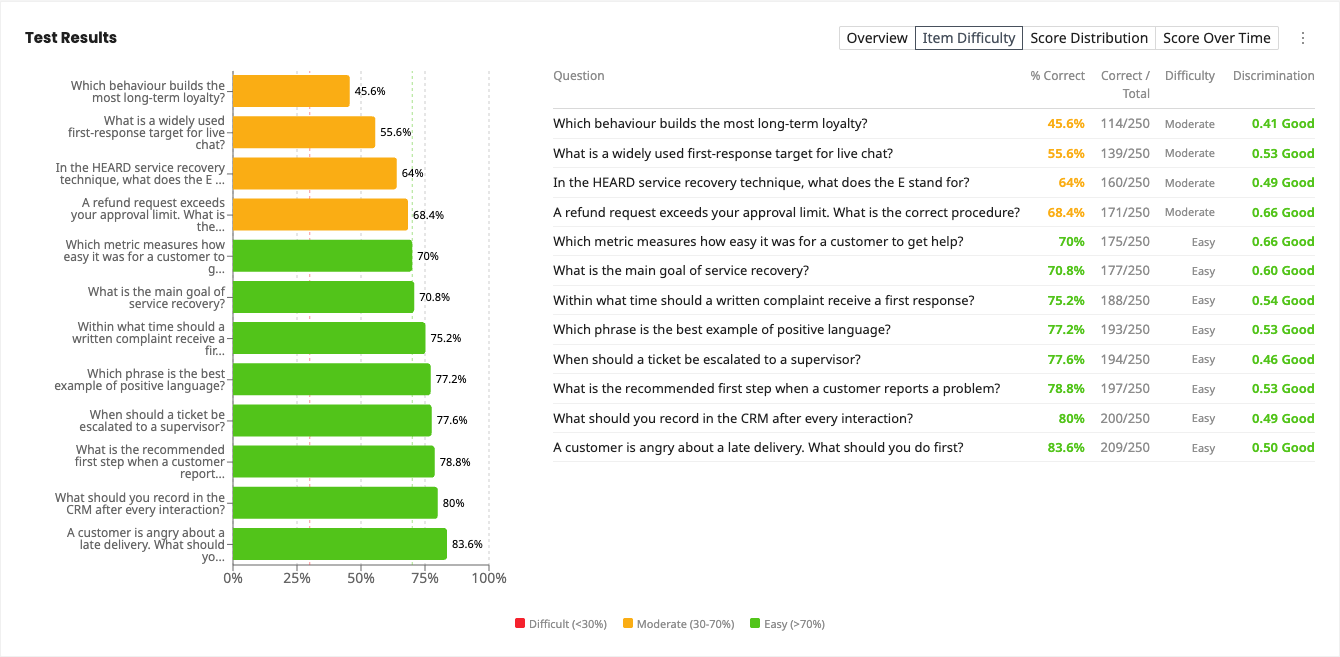
In the demo, the hardest question is the loyalty question at 45.6% correct (114 of 250), labelled Moderate. The easiest is "A customer is angry about a late delivery..." at 83.6% (209 of 250), labelled Easy.
The math is straightforward: correct answers divided by all quiz takers. A response counts as correct when it earned points, and respondents who skipped the question stay in the denominator, so a skipped question counts as incorrect. The difficulty bands are:
- Easy (>70%), shown green
- Moderate (30-70%), shown yellow
- Difficult (<30%), shown red
These are exactly the bands the Item Difficulty Calculator uses. Enter 114 correct out of 250 students and it returns the same 45.6% with the same moderate rating.
Reading the discrimination index
Difficulty alone cannot tell a genuinely hard question from a broken one. That is what the Discrimination column is for. PaperSurvey uses the classic upper/lower 27% method: it sorts all respondents by total score, takes the top 27% and the bottom 27% (68 of the 250 takers in each group for this demo), and subtracts the share of the bottom group who answered the question correctly from the share of the top group. The result runs from -1 to +1 and is shown to two decimals with a label:
- Good (>0.3): a strong differentiator
- Fair (0.15-0.3): acceptable
- Poor (<0.15): the tooltip explains the question "does not differentiate well between high and low performers" and suggests revising it
In the demo assessment every question scores between 0.41 and 0.66, all flagged Good. That combination is the healthy outcome: the loyalty question is hard (45.6% correct) but its discrimination of 0.41 shows that high scorers get it right far more often than low scorers, so it is difficult and fair. If a question ever lands near zero or negative, treat it as a red flag: the wording may be ambiguous, more than one option may be defensible, or the answer key may simply be wrong. Check the key first, then the question text.
Small samples and filters
Discrimination needs at least 4 respondents. With fewer than that, the Discrimination column does not appear on the table at all, only difficulty is shown. Both metrics also respect the current filters, so narrowing the responses by date or by an answer recomputes the whole table live. That makes it easy to compare item statistics between, say, two training cohorts.
Item analysis on a dashboard
The same table is available as a reusable block for analysis views:
- Open an analysis view (or create one with + New View) and click Add.
- In the Add blocks drawer, find Item Difficulty under the Quiz heading, described as "See which questions were easiest and hardest for respondents." The block requires grading to be enabled and honors the view's filters.
You can also send it there from the Results tab directly: the three-dot icon on the Test Results card (hover tooltip "Save to view") opens a Save to View menu that includes Item Difficulty. The menu appears once the survey has at least one analysis view.
Checking the math or analyzing an external test
For tests graded outside PaperSurvey, the two free calculators do the identical arithmetic:
- The Item Difficulty Calculator takes the number of correct answers and the number of students and returns the percentage with the same easy, moderate and difficult bands.
- The Discrimination Index Calculator takes each student's total score plus a matching 1-or-0 series marking whether they got the item right. The two series must be the same length, at least 4 students are required, and it applies the same upper/lower 27% split as the app.
If you want the raw per-respondent data out of PaperSurvey to run this by hand, use the Export button on the Responses tab, which offers Excel, CSV, SPSS, R and more.
Next steps
- Test and Exam Analysis Charts covers the Score Distribution and Score Over Time views of the same card.
- Grading Paper Tests Automatically: Scores, Weighted Points and Pass Rates goes deeper on answer keys, weights and pass thresholds.
- Is Your Test Reliable? Cronbach's Alpha, KR-20, SEM and Inter-Rater Agreement checks the instrument as a whole rather than single items.
- Try the Item Difficulty Calculator and the Discrimination Index Calculator on your own numbers.