A Likert battery packs several agreement statements into one grid question, and it raises the oldest debate in survey analysis: should you report the mean, the median or the mode of an ordinal scale? This article walks through the Staff Experience Survey 2027 sample, where 200 employees rated six aspects of their workplace on a Strongly Disagree to Strongly Agree scale and gave an overall job satisfaction rating from 1 to 5, and shows where each number lives in PaperSurvey, how the mean is really a weighted average, and where the free Likert Scale Calculator picks up when you need top-box or net scores.
Build the battery on the Setup tab
On the Setup tab, a Likert battery is a single-choice grid question: your statements are the rows and the scale points (Strongly Disagree, Disagree, Neutral, Agree, Strongly Agree) are the columns. Each row is stored as its own child question, so analysis widgets can later select an individual statement from the grid on its own.
Every scale point also carries a numeric code, and all numeric statistics in PaperSurvey use these codes. To see or change them, open the question's actions menu and choose Recode values. The modal, titled "Recode values" followed by the question name, lists each option with its Numeric Code. Run your codes 1 to 5 rather than 0 to 4: the statistics footer on the Results tab excludes values of zero or below, so a Strongly Disagree coded 0 would silently vanish from the footer mean (the Descriptive Statistics widget, by contrast, does include zero and negative codes).
Read the distribution on Analysis > Results
Open Analysis, then the Results sub-tab. The grid renders as one combined card, titled with the grid question's own name, in a diverging Likert view: disagreement percentages stretch left, agreement stretches right, and each row shows its own response count.
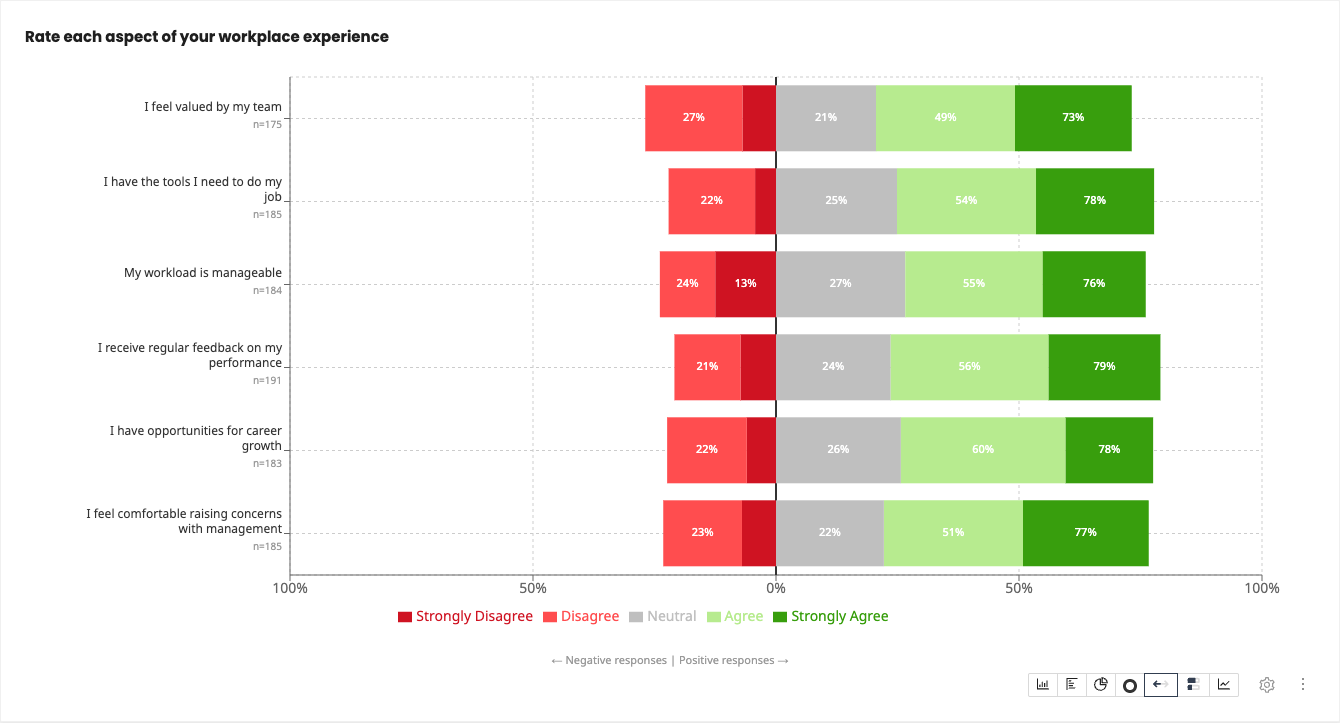
In the sample survey the six statements collected between 175 and 191 responses each, a reminder that every row has its own n. The card's chart-type selector can switch the grid between the diverging view, a 0-100% stacked view and standard bar views. There is also a Summary switch in the Results toolbar that combines every close-ended question with data into one survey-wide battery card with the same diverging and stacked modes.
One caveat: the combined battery views do not show a side table, so exact counts live in the hover tooltips there. To read counts and percentages per scale point directly, use a bar view. The overall satisfaction rating shows this best:
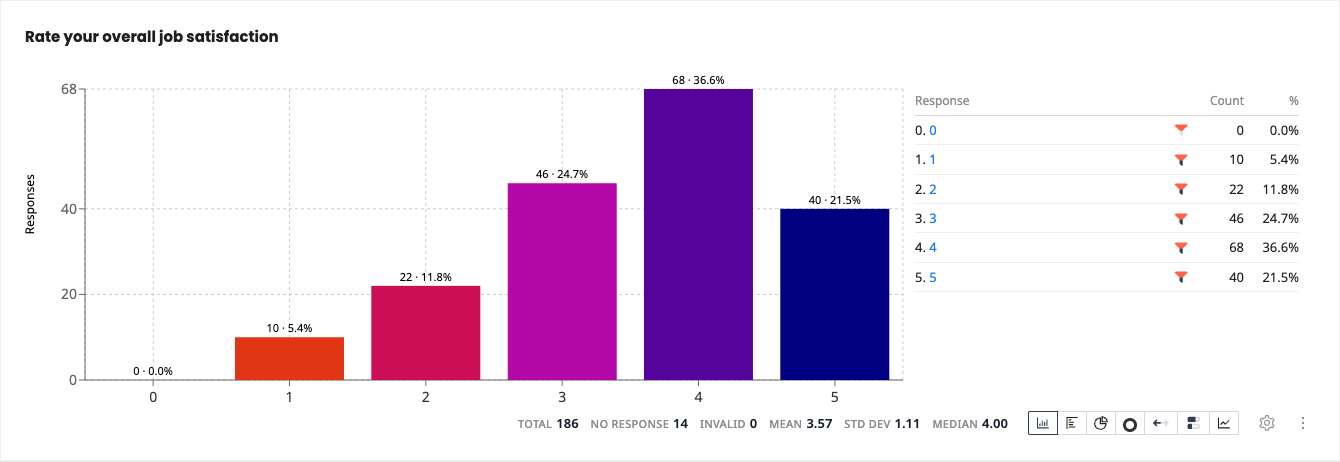
The side table reads 1: 10 (5.4%), 2: 22 (11.8%), 3: 46 (24.7%), 4: 68 (36.6%), 5: 40 (21.5%), with a footer of Total 186, No response 14, Invalid 0, Mean 3.57, Std Dev 1.11, Median 4.00. Those five counts per scale point are exactly the input the Likert Scale Calculator asks for.
To keep the whole battery visible on a dashboard, open an analysis view, click Edit, then Add, and pick Response Distribution from the Charts category of the Add blocks drawer. It displays several Likert questions or grid rows together and becomes available once the survey has at least two close-ended questions (a whole grid counts as one).
Mean, median and mode: the ordinal debate
Statisticians who treat Likert data as strictly ordinal prefer the median and mode; pragmatists report the mean because it is sensitive to every response. PaperSurvey shows all three. In any analysis view, click Edit, then Add, open the Advanced stats category and add a Descriptive Statistics block. A freshly added widget displays its full statistics catalog, including Mean, Median and Mode, and you untick anything you do not need in the Statistics to show checkboxes. When the data is multi-modal, the Mode row lists every tied value separated by commas.
Here is the widget on the same survey's 0 to 10 recommendation question:
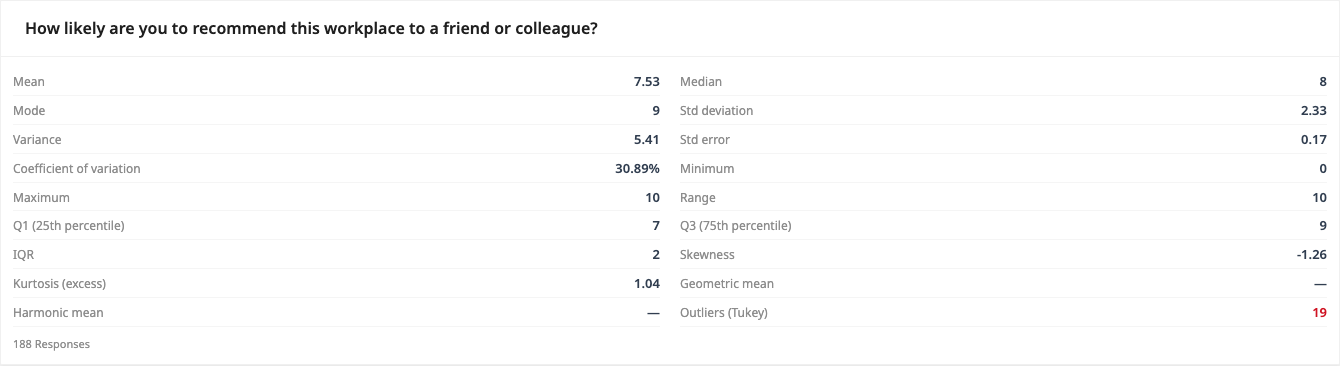
Mean 7.53, Median 8, Mode 9. The three disagree because the distribution is left-skewed (Skewness -1.26): a tail of low scores drags the mean below the median, which sits below the most common answer. Reporting only the mean would understate how the typical employee actually answered, which is precisely the ordinal-data argument. For a quick check on raw values, for example a column pasted from an export, the free Mean, Median and Mode Calculator computes the same three statistics.
The mean of a scale question is a weighted average
The footer Mean of 3.57 on the satisfaction rating is not magic. It is each scale point's numeric code weighted by its response count:
(1 × 10 + 2 × 22 + 3 × 46 + 4 × 68 + 5 × 40) / 186 = 664 / 186 = 3.57
You can replicate this in the free Weighted Average Calculator by entering the codes as values and the counts as weights, which is also the way to answer what-if questions like "what would the mean be if the Neutral group split evenly?". The Likert Scale Calculator does the same average from counts, with one assumption to keep in mind: it treats the scale points as consecutive values 1 to k, so it matches PaperSurvey exactly only when your recode codes really are 1, 2, 3, 4, 5.
Top-box, top-2-box and net scores
PaperSurvey does not compute top-box, top-2-box or net scores for a battery. The workflow is to read the per-point counts from the side table into the Likert Scale Calculator, which returns the average score, the top-box percentage and the net score in one go. For the satisfaction question, the top-2-box is (68 + 40) / 186 = 58.1% and the net score (top two boxes minus bottom two) is about +41.
For a single question there is an in-app shortcut: the CSAT widget counts responses at or above a threshold, which is exactly a threshold-based top-box. On the sample data it lands on the same figure:
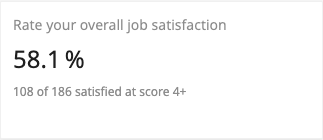
58.1%, from 108 of 186 respondents scoring 4 or higher. Because grid rows are selectable individually, you can point a CSAT widget at one battery statement, but scoring all six statements at once is calculator or spreadsheet territory.
Going further with exports
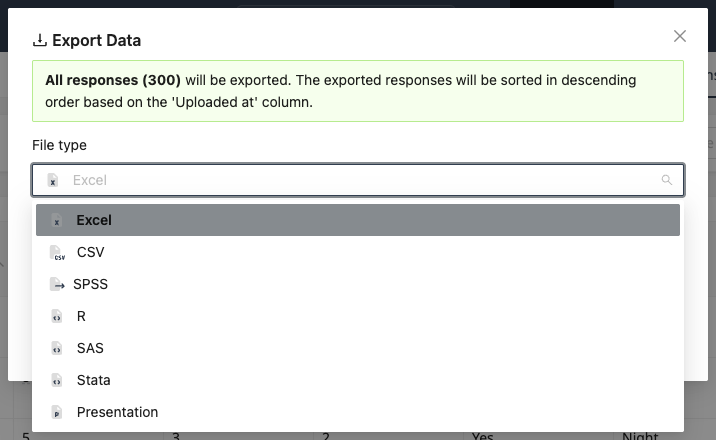
For anything beyond these summaries, such as nonparametric tests across groups, export the raw data from the Responses tab with the Export button. The File type dropdown offers Excel, CSV, SPSS, R, SAS, Stata and Presentation formats. The SPSS file carries the numeric codes with value labels attached, and the Cell Values option "Actual Answer" writes the option labels themselves (for example Strongly Agree) into spreadsheet cells.
One more limit to know: multiple-choice questions have no single numeric code per respondent, so they are excluded from the numeric statistics widgets. Likert analysis in PaperSurvey applies to single-choice questions, rating scales and single-choice grid rows.
Next steps
- Descriptive Statistics for Survey Data covers spread, standard error and the special means in the same widget.
- Creating an Analysis Dashboard shows how to arrange Response Distribution and Descriptive Statistics blocks into a shareable view.
- Exporting Survey Data explains the SPSS, R and Excel export formats in detail.
- Try the free Likert Scale Calculator and Weighted Average Calculator with your own counts.