Likert Scale Calculator
Summarise a Likert item. Enter the number of responses for each scale point, from lowest to highest, separated by commas.
Learn how to calculate it yourselfEnter your values
Results update as you type.
How to enter your data
Type one number for each point on your scale, from the lowest option to the highest, separated by commas. Each number is how many people chose that option, for example 5, 12, 20, 40, 23 for a 5-point scale. You need at least two numbers, and spaces or semicolons work in place of commas.
Average score
Check your inputs
Enter valid values to see your result. Use the field hints or open the data guide for help.
The Likert Scale Calculator summarises the answers to a single rating question, the kind where people pick an option like Strongly disagree, Disagree, Neutral, Agree, or Strongly agree. You tell it how many people chose each option, and it gives back the average score plus a few plain percentages so you can see how positive or negative the responses were overall. It is a quick way to turn a stack of survey ticks into one clear set of numbers you can report.
Calculate it yourself
Example: on a 1-to-5 scale, the response counts from lowest to highest are 1, 2, 3, 2 and 2.
Follow this worked example, then repeat the steps with your own numbers.
Count all responses
N = 1 + 2 + 3 + 2 + 2 = 10Calculate the weighted mean
Mean = (1 × 1 + 2 × 2 + 3 × 3 + 4 × 2 + 5 × 2) ÷ 10 = 32 ÷ 10 = 3.20Multiply each scale value by the number of people who chose it.
Calculate the top-box percentage
Top box = count at 5 ÷ N × 100 = 2 ÷ 10 × 100 = 20%Combine the highest two options
Top-2-box = (count at 4 + count at 5) ÷ N × 100 = (2 + 2) ÷ 10 × 100 = 40%Subtract the bottom box from the top box
Net score = (2 − 1) ÷ 10 × 100 = +10 percentage pointsThis tool’s net score uses just the highest and lowest options.
The mean treats the distance between neighbouring scale points as equal. Top-box summaries do not require that assumption.
Check your answer in the calculatorBuilt into PaperSurvey.io
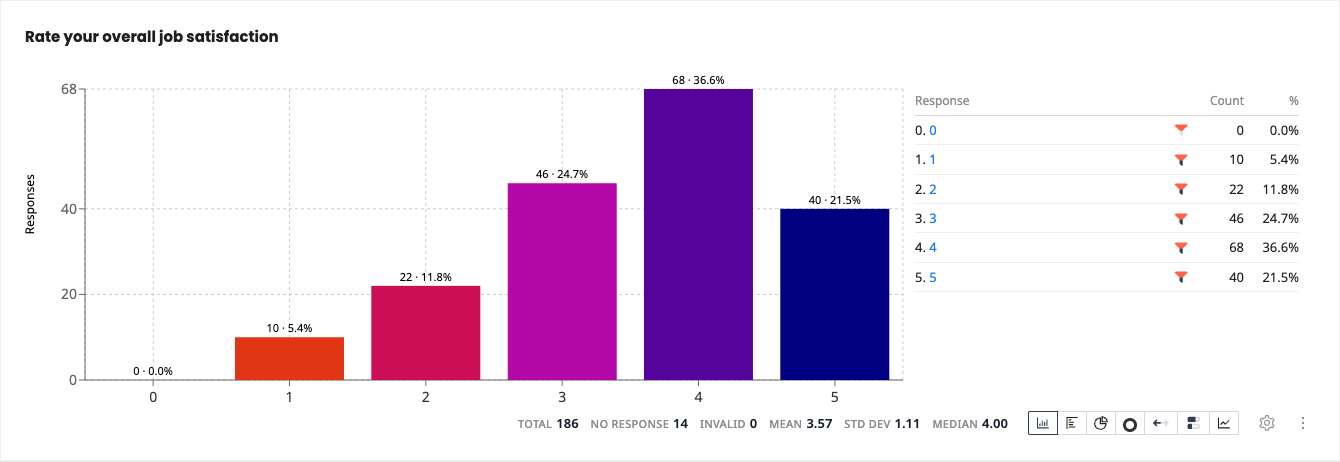
Review the distribution and average of a rating question, then calculate additional scale summaries from its counts.
Where it is used
- Teachers: A teacher tallies how many students picked each option on a "How clear was this lesson?" rating and reads the class average at a glance.
- Customer service managers: A support manager enters the counts from a "How satisfied were you?" question to report the average score and the share of top ratings.
- Event organisers: An event organiser types in how many attendees rated the venue from poor to excellent to sum up the feedback in one number.
Ways to summarise a Likert item
The mean score treats the scale as numeric. Top-box is the percentage choosing the highest point (top-2-box the highest two). The net score is top boxes minus bottom boxes. Reporting more than one measure gives a clearer picture of agreement.
When should you use it?
Use this whenever you have one rating question where people picked from ordered options, such as Strongly disagree to Strongly agree, or Very poor to Excellent. It works best when you already know how many people chose each option and just want a clear summary. It is ideal for feedback forms, course evaluations, staff surveys, and customer satisfaction questions. If your question is a plain yes or no, a pick-one list with no natural order, or an open comment box, this tool is not the right fit.
What does the result mean?
The main result is the average score. The calculator treats each option as a number, with the lowest option counting as 1 and going up. On a 5-point scale the average lands between 1 and 5, where 3 is the exact middle. A score above the middle means answers leaned positive, and below means they leaned negative. Top-box percent is the share who picked the very best option, top-2-box the best two, and the net score is the best minus the worst. There is no single good number, so compare against your own past results.
Mistakes to avoid
The most common mistake is entering your numbers in the wrong order. Always go from the lowest option to the highest, or the average and percentages will come out upside down. Enter the count of people for each option, not the option labels or an average you already worked out. Make sure every option has a number, using 0 if nobody picked it, so nothing is skipped. Finally, remember that one average can hide a split crowd, so look at the percentages too, not just the single score.
How to use this calculator
- Count how many people chose each option in your rating question, from the lowest option to the highest.
- Type those counts into the box, lowest to highest, separated by commas, for example 5, 12, 20, 40, 23.
- Read the average score shown at the top, then check the top-box, top-2-box, and net score below it.
- Compare the numbers with your goals or past surveys to judge whether the result is good.
Worked example
Say 100 people rated a workshop on a 5-point scale and you enter 5, 10, 15, 40, 30. The calculator shows an average score of 3.80 out of 5, a top-box of 30 percent (chose the best option), a top-2-box of 70 percent, and a net score of 25 percent. That tells you the workshop was well received overall.
Frequently asked questions
Should I use the mean or top-box?
Top-box and net scores are often clearer for stakeholders, while the mean is convenient for further analysis. Many teams report both.
What do I type in the box?
Type how many people chose each option, from the lowest option to the highest, separated by commas. For example, 5, 12, 20, 40, 23 means 5 people picked the lowest option and 23 picked the highest.
Where do I get these numbers?
Count your survey answers and tally how many people chose each option. If your results are in a spreadsheet or already in PaperSurvey, the results screen shows these counts for you.
What does the average score tell me?
It is the typical rating once every answer is turned into a number. Higher means people leaned more positive, and on a 5-point scale anything above 3 is on the positive side.
What is the top-box percentage?
It is the percentage of people who chose the single best option. Top-2-box adds the best two options together, which many people find easier to explain than an average.
How many numbers should I enter?
One for each point on your scale, so five numbers for a 5-point scale or seven for a 7-point scale. You need at least two.
Get Started with PaperSurvey.io Software
Start your 14-day free trial now, no credit card required.