Mean, Median and Mode Calculator
Get the mean, median, mode and range of your data in one step. Paste your numbers separated by commas, spaces or new lines.
Learn how to calculate it yourselfEnter your values
Results update as you type.
How to enter your data
Enter your numbers into the box, putting a separator between each one. You can separate them with commas, spaces, or by pressing Enter to put each number on its own line, for example: 70, 85, 85, 90, 100. Only type actual numbers, and use a dot for any decimals (like 4.5); leave out words, currency signs, or percent signs.
Mean (average)
Check your inputs
Enter valid values to see your result. Use the field hints or open the data guide for help.
The Mean, Median and Mode Calculator takes a list of numbers you enter and works out three simple "middle" figures for you. The mean is the everyday average (add all the numbers, then divide by how many there are), the median is the middle number when they are lined up in order, and the mode is the number that shows up most often. Together they give you a quick picture of what a typical value in your list looks like.
Calculate it yourself
Example: summarise the values 2, 4, 4, 6 and 9.
Follow this worked example, then repeat the steps with your own numbers.
Find the mean
Mean = (2 + 4 + 4 + 6 + 9) ÷ 5 = 25 ÷ 5 = 5Find the middle value
Sorted values: 2, 4, 4, 6, 9; middle position = (5 + 1) ÷ 2 = 3; median = 4With an even number of values, average the two middle values instead.
Find the most frequent value
The value 4 appears 2 times; every other value appears once; mode = 4Subtract the minimum from the maximum
Range = 9 − 2 = 7
Built into PaperSurvey.io
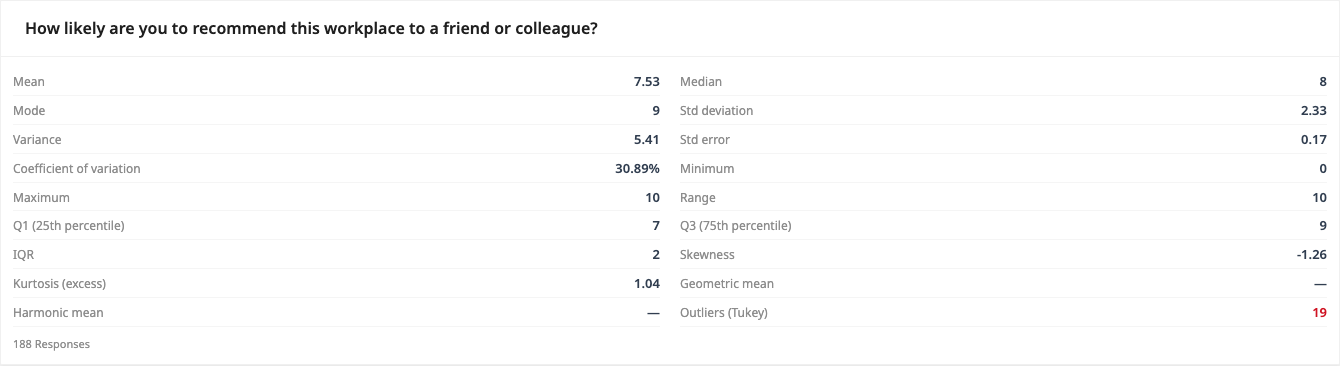
Add Descriptive Statistics to see the mean, median, mode and range of a numeric survey question.
Where it is used
- Teachers: A teacher pastes in the marks from a class test to see the average score, the middle score, and the mark that came up most often.
- Small-business owners: A cafe owner types in the number of customers served each day for a week to find their typical daily footfall.
- Event organisers: An event planner enters the ages of everyone who signed up to understand the typical age of the crowd they are catering for.
Mean, median and mode explained
The mean is the arithmetic average. The median is the middle value when the data is sorted, which is more robust to outliers. The mode is the most frequent value. Reporting all three gives a fuller picture of your data than any one alone.
When should you use it?
Use this calculator whenever you have a set of numbers and want a quick sense of what is typical, without doing the sums by hand. It suits test scores, prices, ages, daily sales, wait times, survey ratings, or any list of figures. The mean is handy for an overall average, the median is useful when a few very high or very low numbers might throw the average off, and the mode tells you which value happens most. If you only have words or categories, this tool will not help, since it needs numbers to work with.
What does the result mean?
You get three figures. The mean is the balanced average of all your numbers. The median is the value sitting exactly in the middle once they are sorted, so half the numbers are below it and half above. The mode is the number that appears most times; if nothing repeats, there is no mode. A useful guideline: when the mean and median are close together, your numbers are fairly even. When they are far apart, a few unusually high or low values are pulling the average, so the median often gives a fairer picture.
Mistakes to avoid
Do not mix words or symbols in with your numbers, as things like currency signs or the word "none" can confuse the count. Remember the mean can be dragged up or down by one very large or very small number, so check the median too before drawing conclusions. Make sure you have entered every value and not skipped any, because a missing number changes all three results. Also do not treat labels such as room numbers or ID codes as real measurements; averaging those has no meaning.
How to use this calculator
- Type or paste all your numbers into the box, separating each one with a comma, a space, or a new line.
- Use a dot for any decimals and leave out words, currency signs, or percent signs.
- Check that every value is entered and that you have not skipped or repeated any by mistake.
- Read the three results: the mean is the average, the median is the middle value, and the mode is the most common value.
Worked example
Say a teacher has five test scores: 70, 85, 85, 90 and 100. Adding them gives 430, and dividing by 5 gives a mean of 86. Lined up in order, the middle score is 85, so the median is 85. The score 85 also appears twice, more than any other, so the mode is 85 as well.
Frequently asked questions
What do I type into the calculator?
Just your list of numbers, with a comma, a space, or a new line between each one. For example: 12, 15, 15, 20. You do not need to sort them first.
Where do I get these numbers from?
They come from whatever you are measuring, such as test scores, prices, ages, daily sales, or survey ratings. Copy them from a spreadsheet, a register, or your own notes.
What is the difference between mean, median and mode?
The mean is the average of all the numbers. The median is the middle number when they are in order. The mode is the number that appears most often.
Why are the mean and median different?
They can differ when a few very high or very low numbers pull the average away from the middle. When that happens, the median usually gives a fairer picture of a typical value.
What if no number repeats?
Then there is no mode, because the mode is simply the value that shows up most often. The mean and median will still be calculated as normal.
Get Started with PaperSurvey.io Software
Start your 14-day free trial now, no credit card required.