Weighted Average Calculator
Compute a weighted average. Enter the values and their matching weights in the same order.
Learn how to calculate it yourselfEnter your values
Results update as you type.
How to enter your data
Enter your values in the first box and their matching weights in the second box. Type each number separated by a comma, and keep both lists in the same order, so the first value pairs with the first weight, the second value with the second weight, and so on.
Weighted average
Check your inputs
Enter valid values to see your result. Use the field hints or open the data guide for help.
A weighted average calculator works out an average where some numbers count more than others. You give it a list of values (such as ratings or scores) and a weight for each one (usually how many people gave that value, or how important it is), and it returns a single fair average that takes those weights into account. It is more accurate than a plain average when your groups are different sizes.
Calculate it yourself
Example: values 2, 4 and 5 have respective weights 1, 2 and 1.
Follow this worked example, then repeat the steps with your own numbers.
Multiply each value by its weight
2 × 1 = 2; 4 × 2 = 8; 5 × 1 = 5Add the products and weights
Weighted total = 2 + 8 + 5 = 15; total weight = 1 + 2 + 1 = 4Divide by the total weight
Weighted average = 15 ÷ 4 = 3.75The value 4 contributes twice as much as either of the other values.
Keep each value paired with its own weight. Counts, percentages and other nonnegative weights work as long as their total is greater than zero.
Check your answer in the calculatorBuilt into PaperSurvey.io
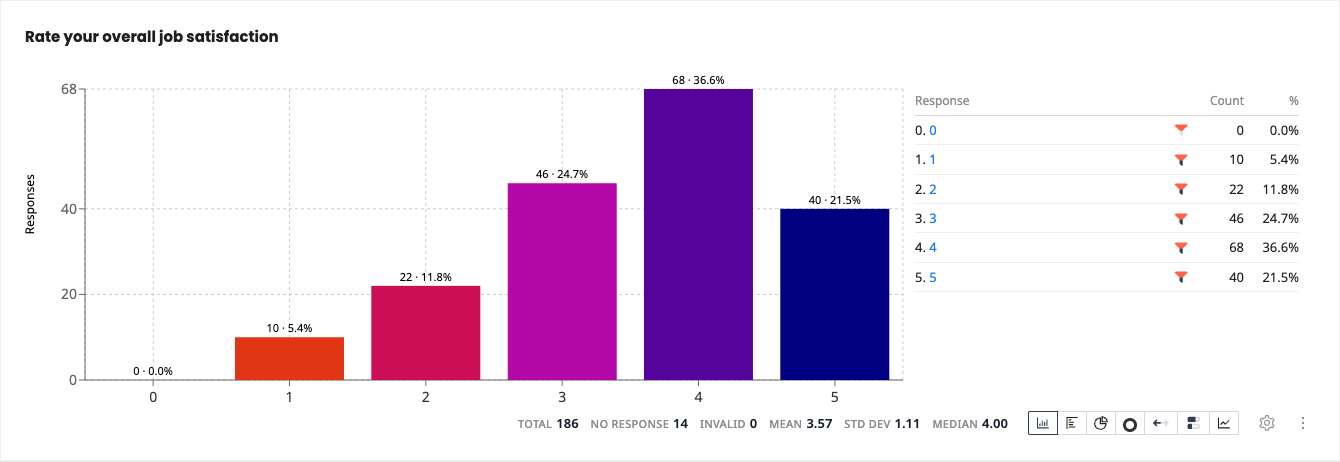
PaperSurvey averages numeric rating codes using their response counts as weights.
Where it is used
- Teachers: A teacher works out a final grade where the exam counts more than homework, so each score is weighted before averaging.
- Hotel managers: A hotel manager turns a batch of star reviews into one overall rating by weighting each star level by how many guests gave it.
- Market researchers: A researcher finds the average satisfaction score from a survey where a different number of people picked each rating.
Weighted vs simple average
A weighted average gives some values more influence than others. It is useful when responses represent different group sizes, when scale points have different values, or when grading with weighted questions.
When should you use it?
Use this whenever your numbers do not all count the same. A plain average treats every number as equal, but often some carry more weight. For example, more people may have chosen one rating than another, or an exam might matter more than homework. This calculator lets you give each value a weight, so bigger or more important groups pull the result by the right amount. If every number truly counts the same, a normal average is fine and you do not need weights at all.
What does the result mean?
The result is a single number on the same scale as your values. If you rated things from 1 to 5, the answer will land between 1 and 5, sitting closer to the ratings that most people gave. A higher number means more of your weight rests on the higher values. There is no universal good score, because it depends on your scale and topic. The most useful comparison is your own past results: track whether the number goes up or down over time.
Mistakes to avoid
The most common mistake is mixing up the two lists, so a value lines up with the wrong weight. Always keep them in the same order. Do not leave gaps: every value needs a weight and every weight needs a value. Do not put a total or a percentage in the weight box; use the actual counts or importance numbers instead. Also avoid falling back on a plain average out of habit when your groups are different sizes, as that gives a misleading figure. Remove any blank or text entries before calculating.
How to use this calculator
- Type or paste your values into the first box, separating each with a comma.
- Type the weight for each value into the second box, in the same order.
- Check that both lists have the same number of entries and line up correctly.
- Read the weighted average result, which appears on the same scale as your values.
Worked example
A cafe asks 100 customers to rate its service from 1 to 5. The votes are: 10 people gave 1, 5 gave 2, 15 gave 3, 30 gave 4, and 40 gave 5. Enter the values 1, 2, 3, 4, 5 and the weights 10, 5, 15, 30, 40. The weighted average comes out as 3.85 out of 5.
Frequently asked questions
What do I type in the first box?
The values you want to average, such as ratings, scores or prices. Separate each one with a comma.
What goes in the weights box?
How much each value counts. Usually this is the number of people who gave that value, or how important it is. Keep them in the same order as your values.
Where do I get these numbers?
From your survey results, a spreadsheet or a tally sheet. For ratings, count how many people chose each option and use those counts as the weights.
How is this different from a normal average?
A normal average treats every number equally. A weighted average lets some numbers count more, so it is more accurate when your groups are different sizes.
What is a good result?
There is no single good number; it depends on your scale. Compare it to your own earlier results to see whether things are improving.
Get Started with PaperSurvey.io Software
Start your 14-day free trial now, no credit card required.