Suppose 300 employees answered your wellbeing survey and 63% of them said they are not considering leaving their job. Is the true figure 63%, or could it plausibly be 57% or 69%? Margin of error and confidence intervals answer exactly that question. This article walks through where PaperSurvey shows a margin of error, what that figure assumes, and how to compute confidence intervals for any percentage or average in your results using the free Margin of Error Calculator, Confidence Interval Calculator (Proportion) and Confidence Interval Calculator (Mean).
Where PaperSurvey shows margin of error
Margin of error appears in three places in the app. Two of them are survey-wide and read off the Response plan you set in the survey's Settings: the Response plan widget on an analysis view, and the data-quality banner at the top of the Analysis tab. Both report the margin your collected responses actually deliver against the target you asked for. The third is per comparison: the Compare Responses page in Advanced mode, and the Excel workbook you can download from each comparison, which report the margin for one pair of questions.
To reach the per-comparison figure:
- Open your survey and go to Analysis, then the Compare Responses tab.
- Pick a question under "How do responses differ based on:".
- Switch the toggle in the top right from Simple to Advanced.
Every comparison card that runs a chi-square test now shows a stats line with, at the end, "MoE ±x%". Cards that run a t-test, ANOVA or regression instead do not carry the figure. In the Employee Wellbeing Study, crossing "Are you considering leaving your job in the next 12 months?" with the shift question shows "MoE ±5.7%" next to the test results, because all 300 respondents answered both questions.
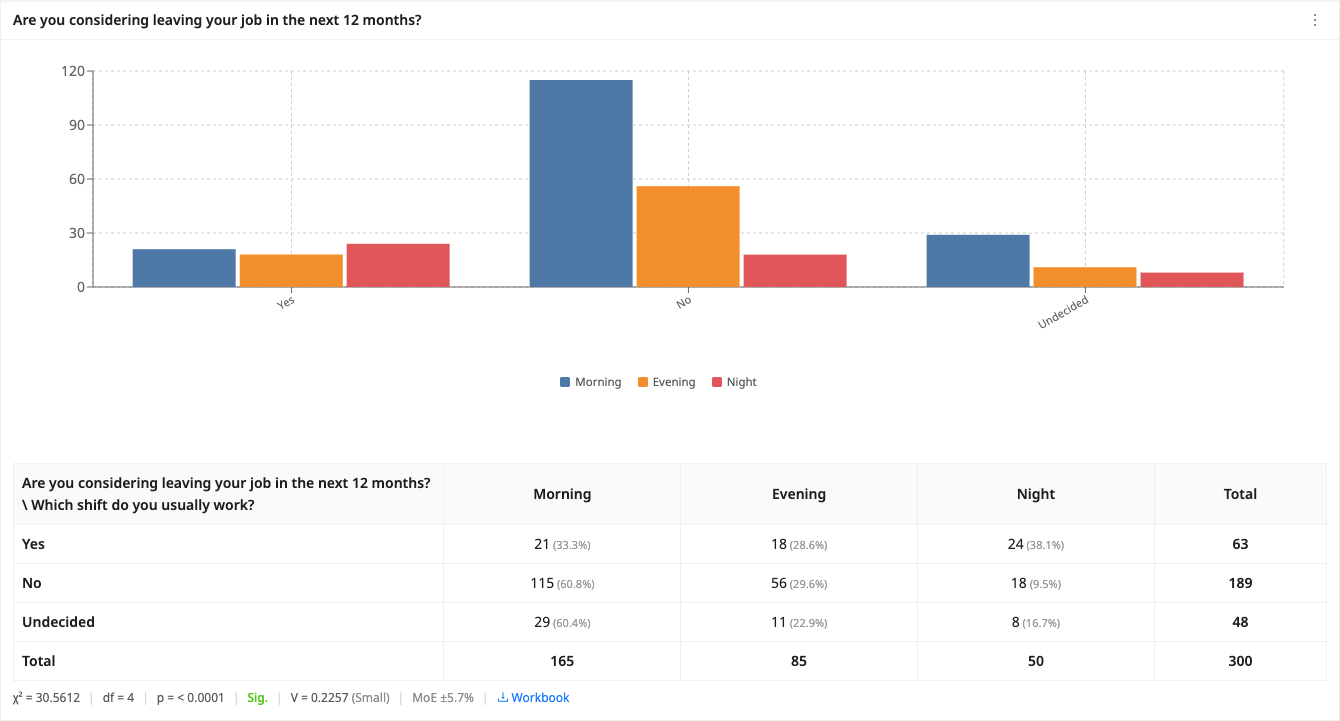
Hover over the MoE figure and a tooltip explains it, for this card it reads "Based on 300 responses at 95% confidence level." The same number is written out in the downloadable workbook: click Workbook on the card (labelled Download workbook in Simple mode) and the crosstab.xlsx file lists "Margin of error (95% CI)" on both the Summary and the Chi-Square Calculation sheets. Note that the Cross-Tab dashboard widget does not display the MoE on the card itself, only its downloadable worksheet contains it, and the Results tab never shows a margin of error at all.
What the Compare Responses figure assumes
The margin of error on a Compare Responses card uses the standard worst-case formula: z multiplied by the square root of p(1-p)/n, with p fixed at 0.5 and z fixed at 1.96 for a 95% confidence level. Three things are worth knowing:
- The confidence level on this card is always 95%. There is no setting to change it here. The Confidence level in the Response plan section of survey Settings is where you pick 80, 85, 90, 95 or 99%, and it drives the survey-wide figures rather than this card.
- The n is the number of entries that answered both questions in the pair, not your total respondent count. If either question allows multiple answers, each combination of selected options counts once, so n can even exceed the number of people.
- This card applies no finite population correction, so the figure is conservative when you surveyed most of a small population. The Response plan does apply the correction once you enter a Population size, which is why the same survey can show two different margins. For the Employee Wellbeing Study's 300 responses out of a population of 1,000, the plan reports ±4.7% while this card reports ±5.7%. Neither is wrong, they answer different questions: the plan describes the survey against the population you defined, the card describes one cross-tab.
The free Margin of Error Calculator uses the same worst-case p = 0.5 formula, and like the Response plan it lets you pick a confidence level and enter a population size for a finite population correction. Reach for it when you are scoping a survey that does not exist yet, or when you want a margin for an n that is neither your full sample nor a cross-tab pair. If you surveyed 300 out of 450 employees, the corrected margin is noticeably tighter than the ±5.7% on the card.
Confidence interval for a percentage
A margin of error built on p = 0.5 is a planning number. Once you have a real result, a confidence interval around the observed percentage is more precise, and PaperSurvey does not display one for a proportion or a mean anywhere in-app. The workflow is: read the two inputs off the Results tab, then compute the interval with the calculator.
Every question card on Analysis > Results shows a side table with each option's count and percentage, and a footer with "Total", the number of distinct respondents who answered that question. Those are exactly the calculator inputs.
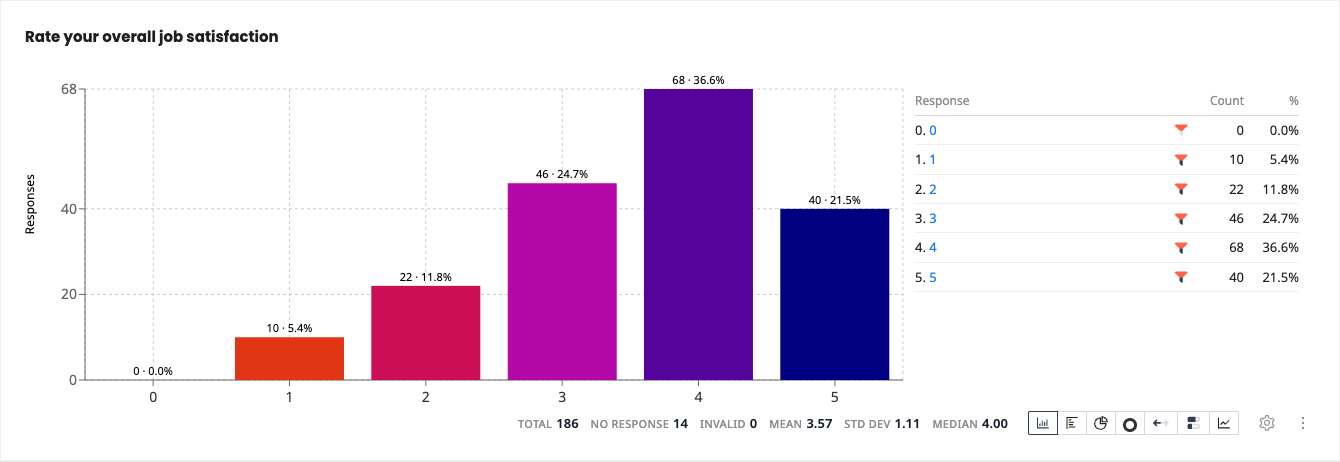
In the Staff Experience Survey, 68 of 186 respondents (36.6%) rated their overall job satisfaction 4 out of 5. Enter 36.6% and n = 186 into the Confidence Interval Calculator (Proportion) and you get roughly ±6.9 percentage points at 95% confidence, an interval of about 29.7% to 43.5%. You can do the same for any combination of options, for example the 108 of 186 respondents (58.1%) who chose 4 or 5.
Two things to keep in mind with choice questions:
- Each option is its own proportion over the same n, so compute a separate interval per option.
- Multiple-choice percentages are calculated over answering respondents and can sum past 100%. That is fine, the per-option interval is still valid.
Confidence interval for a mean
For averages you need three inputs: the mean, the standard deviation and n. The Descriptive Statistics widget shows all three. The auto-built Statistical Deep-Dive analysis view already includes Descriptive Statistics widgets, or you can add your own: open an analysis view, click Edit, then Add, and pick Descriptive Statistics from the Advanced stats category. A freshly added widget shows the full list of statistics, including Std error, and you can trim it with the "Statistics to show" checkboxes.
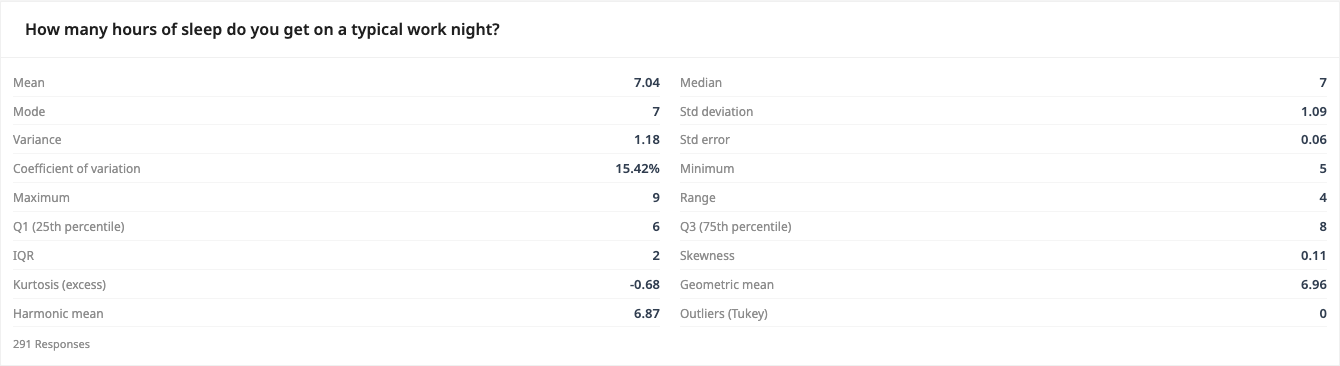
For the sleep question in the Employee Wellbeing Study the widget shows Mean 7.04, Std deviation 1.09 and Std error 0.06, with "291 Responses" in the footer. Enter mean 7.04, standard deviation 1.09 and n = 291 into the Confidence Interval Calculator (Mean) and the 95% interval comes out at roughly 6.91 to 7.17 hours. The calculator also echoes the standard error it used, which you can cross-check against the widget's Std error row.
Prefer the widget over the chart footer for these inputs. The Results-tab footer Std Dev is a population standard deviation and the footer statistics exclude values of 0 or below, while the widget uses sample (n-1) statistics, which is what the calculator expects. Related: the One-sample t-test widget reports t, df, p and the sample mean against a target value, but it does not display an interval either.
Going deeper in SPSS or R
For exact intervals, subgroups or non-standard confidence levels, export the raw data. On the Responses tab click Export and pick SPSS or R from the File type dropdown.
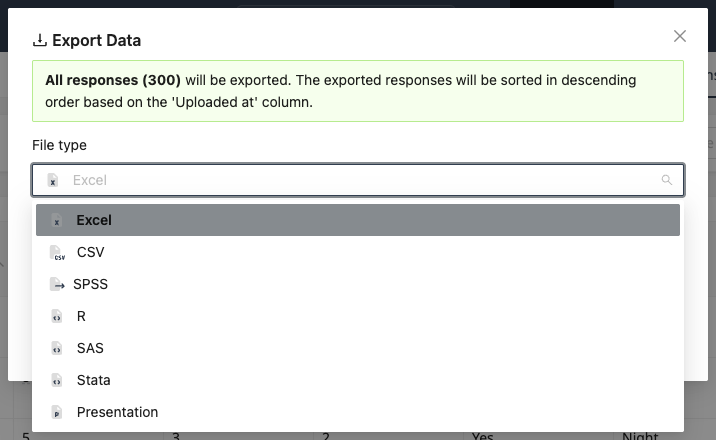
The .sav file carries numeric codes, value labels and user-missing sentinels, so blank answers do not distort means. The R export is a zip with data.sav plus an import_script.R that already builds frequency tables and is ready to extend, for example with prop.test() for exact proportion intervals or t.test() for mean intervals.
Common traps
- The per-comparison MoE lives only on Compare Responses (Advanced) and in the crosstab.xlsx workbook. The survey-wide MoE lives in the Response plan widget and the data-quality banner. The Results tab never shows a margin of error at all.
- The MoE n is pair-specific. A card where fewer people answered both questions has a wider margin than your headline respondent count suggests.
- Footer statistics and widget statistics differ by design (population vs sample SD, exclusion of values of 0 or below). Take calculator inputs from the Descriptive Statistics widget.
- A tight interval only quantifies sampling noise. It says nothing about non-response bias, so a 95% interval on a survey only enthusiasts returned can still miss the truth.