Confidence Interval Calculator (Proportion)
Turn a single survey percentage into a confidence interval. Enter the sample size, the percentage who chose an answer and your confidence level.
Learn how to calculate it yourselfEnter your values
Results update as you type.
How to enter your data
Type plain whole numbers into the boxes. In one box put the count of people who gave the answer you care about (for example, 62 people said "yes"). In another box put the total number of people you asked (for example, 100). Then choose a confidence level, which is almost always 95%. Do not add percent signs, commas or decimals to the counts.
Confidence interval
- Margin of error
- ±4.9%
This calculator takes a result from a sample, like the share of people who said "yes," and works out a range that the true figure for your whole group is likely to fall inside. You tell it how many people gave a particular answer and how many people you asked in total, and it gives you the percentage plus a "give or take" range. This shows how much your survey result might wobble because you only asked some people, not everyone.
Calculate it yourself
Example: 60 of 100 respondents chose an answer. Build a 95% confidence interval around that percentage.
Follow this worked example, then repeat the steps with your own numbers.
Write the observed proportion
p = 60 ÷ 100 = 0.60; n = 100Calculate the standard error
SE = √[p(1 − p) ÷ n] = √(0.60 × 0.40 ÷ 100) ≈ 0.04899Find the margin of error
Margin ≈ 1.96 × 0.04899 = 0.09602The 95% normal-table multiplier is about 1.96. Keep extra decimal places until the final step.
Subtract and add the margin
(0.60 − 0.09602) × 100 ≈ 50.4%; (0.60 + 0.09602) × 100 ≈ 69.6%
This is the normal approximation used by this tool. It works best when both the number choosing the answer and the number not choosing it are reasonably large; it can be unreliable near 0% or 100%.
Check your answer in the calculatorUse your PaperSurvey.io results
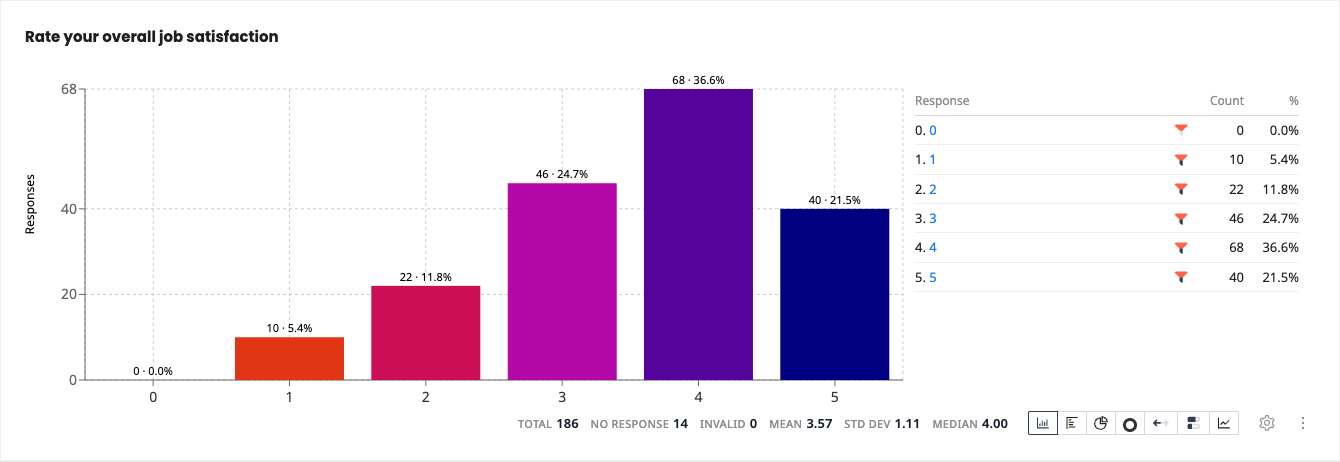
Take a question’s percentage and response count into this calculator to build a confidence interval.
Where it is used
- Teachers: A teacher sees that 42 of 60 students passed a test and wants a likely pass-rate range for all their classes, not just this one group.
- Small-business owners: A cafe owner asks 80 customers whether they would come back, 68 say yes, and wants a realistic range for how satisfied all customers are.
- HR staff: An HR officer surveys 150 employees, 90 say they feel supported at work, and needs a range to report honestly to managers.
What a confidence interval tells you
A confidence interval is the range that very likely contains the true value for the whole population. A 95% confidence interval means that if you repeated the survey many times, about 95% of the intervals would contain the true value.
When should you use it?
Use this calculator when your survey answer is really a yes-or-no, or one choice against all the rest, and you want to know how much to trust that percentage. It fits questions like happy or not happy, pass or fail, would recommend or not, and voted yes or no. It works best when you asked only some of your people, a sample, and want to describe the wider group. Do not use it for averages of scores, prices or amounts. A separate mean calculator handles those.
What does the result mean?
The result is a percentage plus a range, for example 68 percent, from 58 percent to 78 percent. The percentage is what you found in your sample. The range shows where the true figure for your whole group is likely to sit. A narrow range means a precise, more trustworthy result. A wide range means you cannot be very sure yet. Bigger samples give narrower ranges. As a rough guide, many surveys aim for a give-or-take of about 5 percent or less, measured at 95 percent confidence.
Mistakes to avoid
Do not type a percentage in the count box; type the actual number of people. Do not let the count be larger than the total, since that cannot happen. Do not trust a tight-looking answer from a tiny sample, because with only ten people the real range is huge. Treat the range as a likely range, not a promise. Be careful comparing two groups whose ranges overlap, as that often means there is no real difference. Finally, only count people who actually answered the question.
How to use this calculator
- In the first box, type how many people gave the answer you are measuring (for example, 68).
- In the second box, type the total number of people you asked (for example, 80).
- Choose a confidence level, usually 95%.
- Read the result: your percentage plus a range, for example 85% (from about 77% to 93%).
Worked example
Say you ask 200 event guests whether they enjoyed the day, and 150 say yes. Enter 150 as the count and 200 as the total, and leave the confidence level at 95%. The result is 75%, with a range of about 69% to 81%. So while three-quarters of the guests you asked were happy, the true figure for all your guests is likely somewhere between 69% and 81%.
Frequently asked questions
Confidence interval vs margin of error?
The margin of error is half the width of the confidence interval. Add and subtract it from your result to get the interval.
What do I type in each box?
Put the number of people who gave the answer you care about in the first box, and the total number of people you asked in the second box. Choose 95% for the confidence level if you are unsure.
Where do I get these numbers?
From your own survey or tally. Count how many people chose the answer you are measuring, such as "yes," and count how many people answered in total.
What does 95% confidence mean?
It means the true figure for your whole group is very likely to fall inside the range shown. If you ran the same survey many times, about 95 times out of 100 the real answer would land in that range.
What is the plus or minus number?
It is how far the result could stretch either side of your percentage, sometimes called the margin of error. A smaller number means a more precise result. Many surveys aim for about 5% or less.
How do I make the range narrower?
Ask more people. Larger samples give tighter, more reliable ranges. Roughly speaking, you need about four times as many responses to cut the range in half.
Get Started with PaperSurvey.io Software
Start your 14-day free trial now, no credit card required.