The most common survey planning question is also the one people answer last: how many completed responses do you actually need? PaperSurvey now answers that in the app: every survey has a Response plan section on its Settings page that turns a population size, a confidence level and a target margin of error into a required number of completed responses. What the app still does not include is a statistical power planner or a minimum detectable effect, so that part of planning stays outside the app, in free calculators such as the Sample Size Calculator and the A/B Test Sample Size Calculator. The app then gives you the raw counts you need to track fieldwork and judge how close you got. This article walks through one realistic scenario, planning a staff survey for a 1,000-person organisation, using the demo surveys and real figures from a PaperSurvey account.
Start from the precision you need, not a round number
Before any calculator, decide what decision the survey supports. If leadership will act when "considering leaving" moves by 10 points, a margin of error of ±5% is fine. If you need to detect a 3-point shift, you need a much larger sample. The margin of error you can live with is the single input that drives everything below.
Step 1: Work out how many completed responses you need
For questions reported as percentages (the share who exercise, the share considering leaving), open the survey's Settings page and fill in the Response plan section. For our scenario, a Population size of 1,000 employees, a Confidence level of 95% and a Target margin of error of ±5%, the plan returns 278 required completed responses. Leave Population size blank when the population is large or you do not know it, and the same 95% and ±5% return 385 instead.
The free Sample Size Calculator returns the same 278 from the same three inputs, because both run Cochran's formula with a finite population correction. Use the calculator to scope a survey you have not built yet, and the Response plan once the survey exists, because only the plan tracks progress against the target later. Either way, the number is completions, not printed forms. We will get to the print run in a moment.
The Response plan sizes a survey for a percentage, so a target built on an average still belongs in a calculator. If your headline metric is an average rather than a percentage, for example average hours of sleep, use the Sample Size Calculator for a Mean instead. It asks for an Expected standard deviation, which you will not know before fielding. The honest way to get one is a small pilot. In the demo Employee Wellbeing Study, the Statistical Deep-Dive view's Descriptive Statistics widget reports the sleep question's Std deviation as 1.09 across 291 responses.
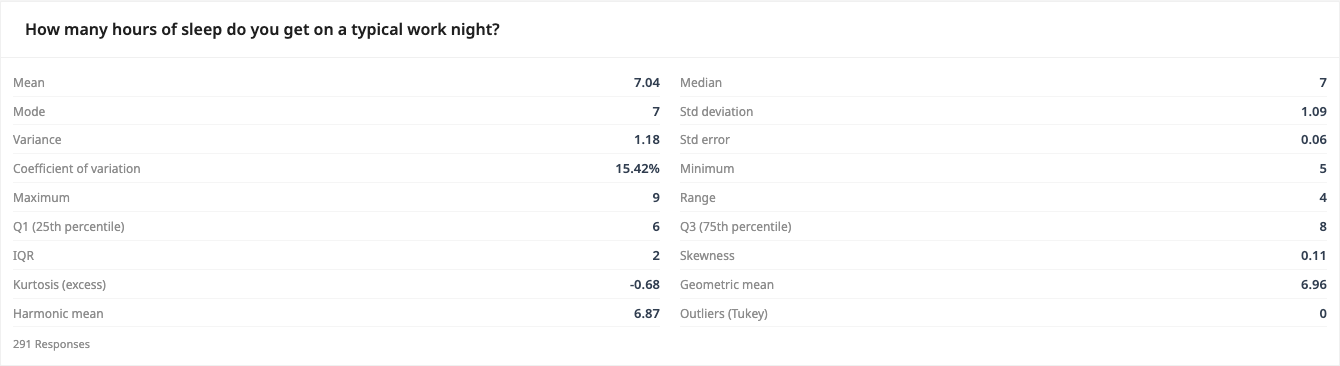
Feeding 1.09 into the calculator with a desired margin of ±0.15 hours at 95% confidence gives roughly 203 completed responses. A wider margin of ±0.25 hours needs only about 74. This is why the standard deviation matters: noisy questions need bigger samples for the same precision.
Step 2: Size the print run or invitation list
The Response plan does this division for you, and the arithmetic is deliberately simple: divide required completions by the response rate you expect.
- The plan already holds the target from Step 1, in our scenario 278 completed responses.
- Estimate a response rate from a previous wave and type it into Expected response rate. If your last staff survey achieved about 30%, enter 30%.
- The plan divides 278 by 0.30, which is 927, and rounds up to a suggested print run shown as about 930. With a workforce of 1,000, the practical answer is to invite everyone and print a form for each person.
Expected response rate is optional and is used only to size the print run. Leave it out and you still get the required completions figure.
If a previous wave achieved a much higher rate, say 60%, printing 500 forms would be enough. Always round up, spoiled and undeliverable forms are part of fieldwork. The same suggested print run is prefilled as the copy count in the Create copies modal when you print, so you do not have to carry the number across by hand.
Step 3: Track responses as they come in
Once forms are out, PaperSurvey shows you raw counts in four places.
The surveys list shows a per-survey count of processed responses in the column headed with a people icon. Hover over the icon and the tooltip reads Responses collected. In the demo account the Employee Wellbeing Study shows 300 and the Customer Service Training Assessment shows 250.

For paper surveys printed with unique page marking, open Prints in the main navigation to reach the Generated Prints page. Each batch row shows a Copies Requested column and an Uploaded column in the form "X / Y", processed returns out of the copies in that batch. An info icon on the column header explains the counter. One caveat: if you reprint a batch reusing the same identifiers, the per-batch counter can over- or under-count, so treat the survey-level total as the reliable number. Surveys printed without unique page marking download as a single PDF and do not appear on this page.
Inside an analysis view you can also add a Total Responses widget, and, on surveys with web surveys enabled, separate Paper survey submissions and Web survey submissions widgets that split the count by channel. That split is exactly what you need for mixed-mode response rates.
The fourth place is where the plan turns into progress. Add a Response plan widget to an analysis view and it shows a progress bar, the responses collected so far against the target from Step 1, and the margin of error those responses actually deliver against the one you asked for. In the demo Employee Wellbeing Study, 300 responses against a target of 278 reads as met, and the achieved margin of error is ±4.7% against the ±5% you set.
The data-quality banner at the top of the Analysis tab repeats the same headline, so you do not have to open a view to see it, and while the survey is still short of the target it raises a Short of your response target note.
Step 4: Compute your actual response rate
PaperSurvey never computes a response rate percentage itself. The Expected response rate in the Response plan is not an exception: it is an estimate you type in to size a print run, not something the app has measured. The app never sees how many forms you handed out. It gives you the numerator, and you supply the denominator from your own distribution records. Take the numbers to the free Response Rate Calculator:
- Enter Responses received, the processed count from the surveys list or the Total Responses widget. For the Employee Wellbeing Study that is 300.
- Enter People invited, the number of forms you distributed or web invitations you sent, in our scenario 1,000.
- The calculator returns 30%, comfortably delivering the 278 completions we needed.
One thing the app genuinely cannot see: web survey entries are only created when a respondent submits. Someone who opens the link and abandons leaves no trace, so the denominator for a web response rate must come from your invitation list, never from the app.
Step 5: Check your completion rate
Response rate tells you how many people took part. Completion rate tells you how many of those made it through the form. On the Analysis tab, open Results and compare the footers of an early question and a question near the end of the form. Each question card with responses shows TOTAL, NO RESPONSE and INVALID at the bottom. In the demo Staff Experience Survey 2027, which collected 200 responses, the overall job satisfaction card shows Total 186 and No response 14.
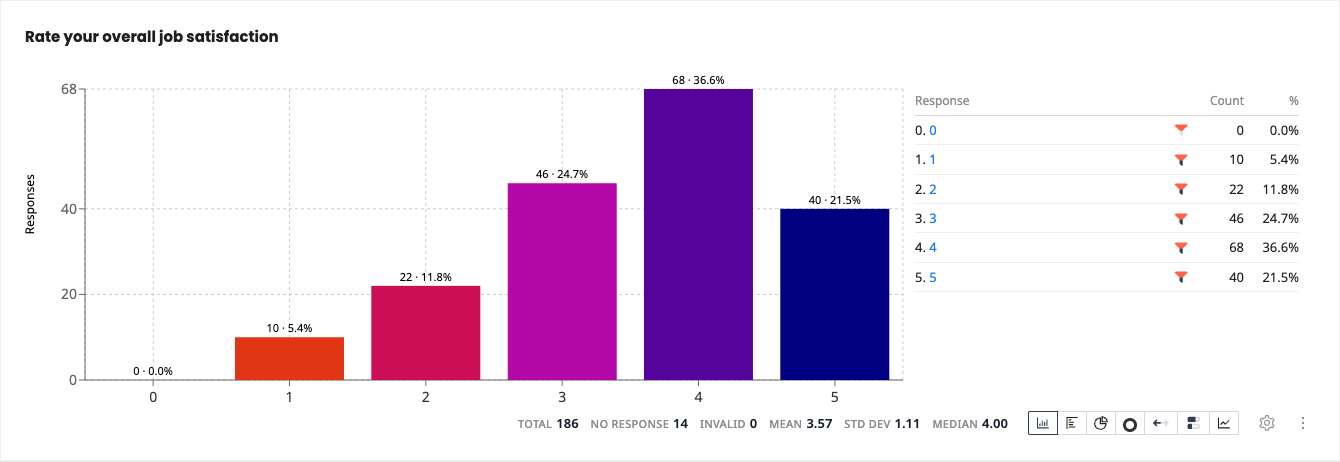
Enter those figures into the Completion Rate Calculator: Started the survey 200, Completed the survey 186, giving a 93% completion rate. Two practical notes:
- The per-question No response count includes people who simply skipped that item, so measure completion against a late question respondents would not legitimately skip. A "prefer not to say" salary question is a poor yardstick.
- To inspect who the non-completers are, click the Total or No response label text under the chart (the label, not the number) to open the Responses list filtered to exactly those entries.
Verify the precision you actually achieved
After fieldwork, check whether your final sample delivered the margin of error you planned for. The Response plan widget answers that for the survey as a whole: in the demo Employee Wellbeing Study it reports ±4.7% against the ±5% target. For the precision behind one specific comparison, open Compare Responses on the Analysis tab, switch the toggle in the top right to Advanced, and run a comparison. The stats footer of each result reports the achieved margin of error. In the demo Employee Wellbeing Study, comparing intention to leave by shift shows "MoE ±5.7%" based on the 300 collected responses at a 95% confidence level.
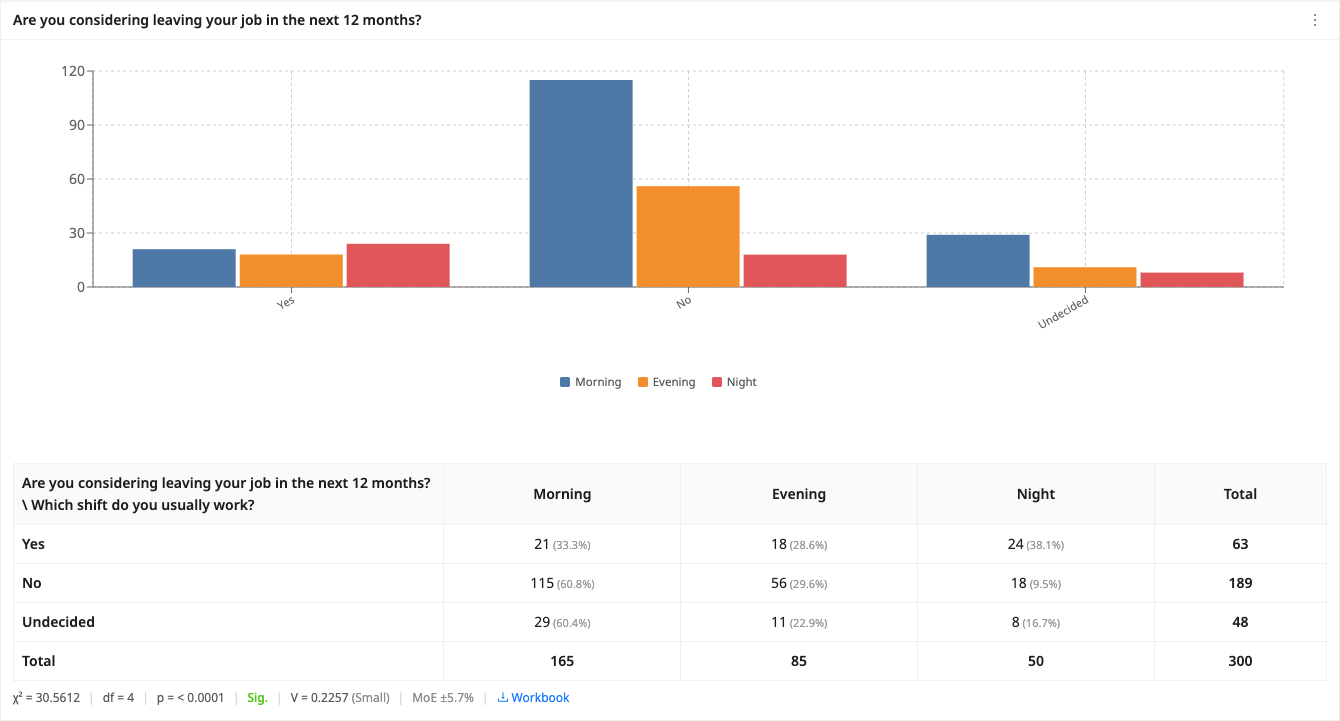
Two different margins on the same 300 responses is not a bug, and neither figure is wrong. The Response plan honours what you entered, a population of 1,000 and a 95% confidence level, and applies the finite population correction, which is what pulls it down to ±4.7%. The Compare Responses card does neither: its confidence level is fixed at 95% and it treats the population as effectively unlimited, so it reports the more conservative ±5.7%. Quote the plan figure when you report on the survey as a whole against the population you defined, and the Compare Responses figure when you are talking about one specific cross-tab.
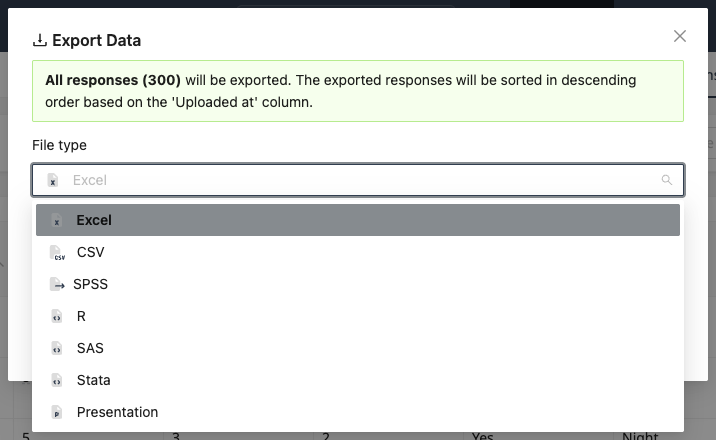
The n behind the Compare Responses figure is the number of respondents who answered both questions in the comparison, which can be smaller than your full sample. Confidence level is now a survey setting, so the plan will size and report at 80, 85, 90, 95 or 99%, but three things stay outside the app: a sample size for an average, statistical power, and a minimum detectable effect. For those, and for any other planning arithmetic the app does not do, the workflow is the same throughout: collect with PaperSurvey, export from the Responses tab (Excel, CSV, SPSS, R, SAS, Stata), and compute in the free calculators or your stats package.
Next steps
- Set the target for the survey you are running now in Settings > Response plan, then follow it in the Response plan widget
- Understand what your margin of error really means in Margin of Error and Confidence Intervals
- Get pilot standard deviations from the widget covered in Descriptive Statistics for Survey Data
- Export your raw counts and data with Exporting Survey Data
- Plan your next wave with the Sample Size Calculator