Confidence Interval Calculator (Mean)
Build a confidence interval around an average using the t distribution. Enter the sample mean, standard deviation and size.
Learn how to calculate it yourselfEnter your values
Results update as you type.
How to enter your data
Enter your numbers one at a time into the box, pressing comma or Enter after each value. For example, type 8 and press Enter, then 7, then 9, and so on until every number is in. Use plain numbers only, with a dot for any decimals, and no words, units, or currency symbols.
Confidence interval for the mean
- Margin of error
- ±3.73
- Standard error
- 1.826
- t critical
- 2.045
The Confidence Interval Calculator (Mean) takes a list of numbers, such as test scores or ratings, and works out their average. It then gives you a range around that average that most likely contains the true average for the whole group you care about, not just the people you happened to measure. In plain terms, it tells you how much you can trust your average and how far the real answer might sit above or below it.
Calculate it yourself
Example: a sample of 9 values has mean 10 and sample standard deviation 2. Find its 95% confidence interval.
Follow this worked example, then repeat the steps with your own numbers.
Calculate the standard error
SE = s ÷ √n = 2 ÷ √9 = 2 ÷ 3 ≈ 0.6667s is the sample standard deviation and n is the sample size.
Look up the t multiplier
df = n − 1 = 8; t critical ≈ 2.306Use a t table with 8 degrees of freedom and 0.025 in the upper tail for a two-sided 95% interval.
Calculate the margin
Margin = t × SE ≈ 2.306 × (2 ÷ 3) ≈ 1.5373Build the interval
10 − 1.5373 ≈ 8.46; 10 + 1.5373 ≈ 11.54Report the interval as 8.46 to 11.54 in the same units as your measurements.
For a small sample, this interval assumes approximately normal data without strong outliers. The t multiplier comes from a table or numerical calculation, not ordinary arithmetic.
Check your answer in the calculatorUse your PaperSurvey.io results
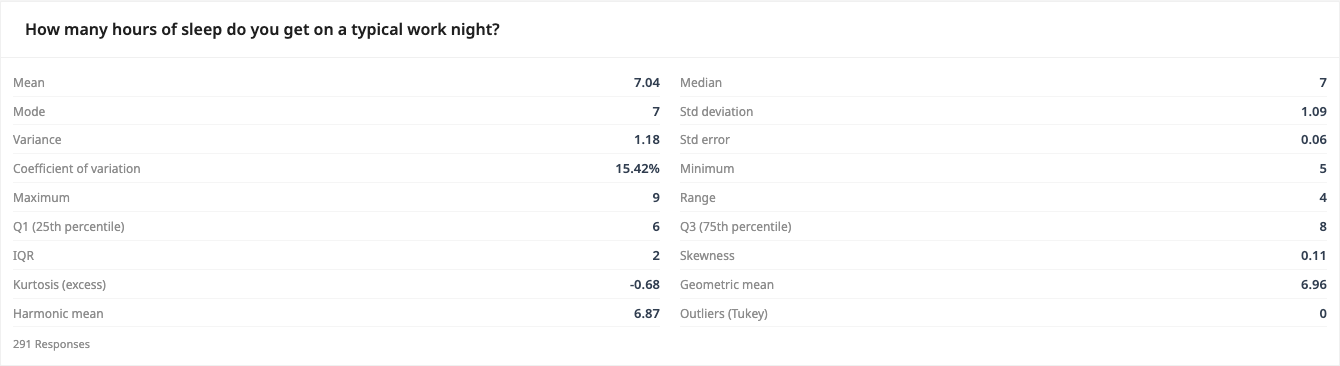
Read the three inputs from Descriptive Statistics, then calculate the confidence interval here.
Where it is used
- Teachers: A teacher enters every mark from a class test to see the average score and the range the class's true ability likely falls within.
- Small-business owners: A cafe owner types in the satisfaction ratings customers gave this week to find the average and check how dependable that average really is.
- HR staff: An HR officer enters staff survey scores about workplace happiness so they can report the average with a sensible margin around it.
When to use the t distribution
When you estimate a confidence interval for an average from a sample, the t distribution is the correct choice, especially for smaller samples. It is slightly wider than the normal distribution to account for the extra uncertainty of estimating the standard deviation from the data.
When should you use it?
Use it whenever you have a list of numbers that all measure the same thing, such as test marks, ratings out of ten, ages, or waiting times in minutes. It works best when you only asked or measured some of the people, but you want to say something sensible about the whole group. The calculator gives you the average of your numbers plus a trustworthy range around it. If your data is words or yes and no answers rather than numbers, this is not the right tool.
What does the result mean?
The calculator shows two things: the average of the numbers you entered, and a range below and above it. At the usual 95% setting, you can be about 95 percent confident that the true average for the whole group sits somewhere inside that range. A narrow range means your average is precise and dependable. A wide range means there is more uncertainty, usually because you have few responses or your numbers are very spread out. There is no single perfect width, but narrower is generally better.
Mistakes to avoid
Do not type words, categories, or yes and no answers, because this tool only works with number measurements. Do not mix different things in one list, such as ages and prices together, since the average would be meaningless. Avoid drawing strong conclusions from only a handful of numbers, as the range will be very wide and unreliable. Remember to include the decimal point where it matters, and remove any currency symbols or units. Finally, do not confuse the confidence range with the highest and lowest values in your data.
How to use this calculator
- Enter each of your numbers into the box, pressing comma or Enter after every value until they are all in.
- Choose your confidence level, with 95% being the usual and recommended choice.
- Read the average the calculator shows for the numbers you entered.
- Read the range below and above the average, which is where the true average for the whole group most likely sits.
Worked example
A cafe asks 10 customers to rate service from 1 to 10 and gets these scores: 8, 7, 9, 6, 8, 7, 9, 8, 7, 9. Entering them gives an average of 7.8, with a 95% confidence interval of about 7.1 to 8.5. This means the true average rating across all the cafe's customers is most likely somewhere between roughly 7.1 and 8.5.
Frequently asked questions
When can I use the normal (z) interval instead?
With large samples the t and z intervals are almost identical. The t interval is always a safe choice.
What do I type in the box?
Type your actual measurements, one number at a time, pressing comma or Enter after each. These might be individual test scores, ratings, or times. Use plain numbers with a dot for decimals and nothing else.
Where do I get these numbers?
They come from your own survey, test, or records, such as the ratings customers gave, the marks pupils scored, or the minutes people waited. Each person or item gives one number, and you enter every one of them.
What confidence level should I choose?
Stick with 95% unless you have a reason not to, as it is the standard choice used in most reports. A higher level like 99% makes the range wider, and a lower level like 90% makes it narrower.
What does 95% confidence actually mean?
It means you can be about 95 percent sure the true average for the whole group falls inside the range shown. It does not mean that 95 percent of your individual answers fall inside that range.
Why is my range so wide?
Usually because you entered only a few numbers, or your numbers are very spread out. Collecting more responses is the best way to make the range narrower and the average more dependable.
Get Started with PaperSurvey.io Software
Start your 14-day free trial now, no credit card required.