Marking a stack of paper tests by hand is slow, and tallying pass rates afterwards is where the arithmetic mistakes creep in. With grading enabled, PaperSurvey scores every scanned or web response against your answer key the moment it is processed, then reports the class average, median, high, low and pass rate for you. This article walks through the Customer Service Training Assessment sample survey, a 12-question test taken by 250 staff, and shows exactly how the app computes what our free Grade Calculator and Pass Rate Calculator do for scores you type in yourself.
The scenario
A training team assessed 250 employees after a customer service course. The test has 12 single-choice questions worth 14 points in total: ten routine knowledge questions carry 1 point each and two harder scenario questions carry 2 points each. Anyone scoring at least 70% of the maximum passes. The team wants each person's score, the overall pass rate and a view of which questions caused the failures, without marking a single sheet by hand.
Step 1: Turn on grading in Settings
- Open your survey and go to Settings, then pick Grading in the side navigation.
- Switch on Activate test grading.
- A Pass threshold field appears with a % suffix. Enter 70. The threshold is optional: leave it empty and you still get scores, just no pass or fail verdicts.
Step 2: Build the answer key, points are your weights
Answer keys live on the Setup tab. Open a question's tools menu (the wrench icon next to the question) and choose Answer Key.
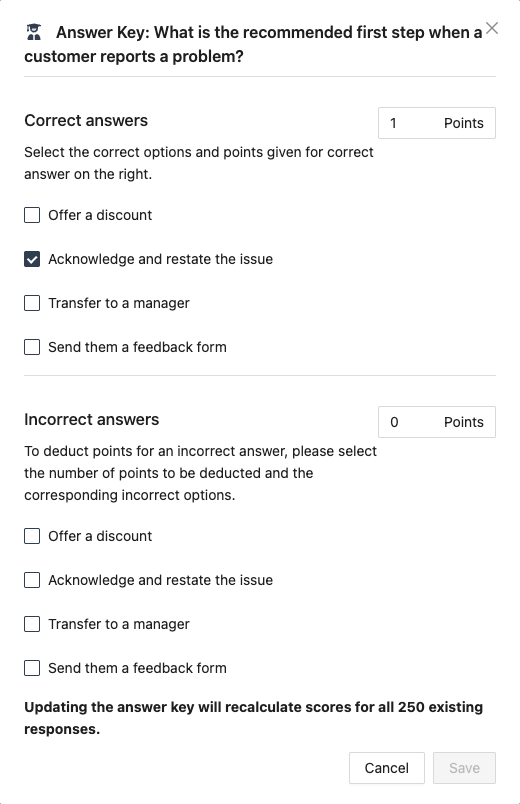
In the modal you tick the correct option under Correct answers and set Points, the question's weight. This is where the weighting happens: our scenario questions get 2 points, the routine ones get 1, so the maximum possible score becomes 14. There is also an Incorrect answers section where you can attach a deduction to specific wrong options. Three rules worth knowing:
- Deductions only apply to options you explicitly tick as incorrect. A wrong answer you did not list simply scores 0.
- There is no partial credit on multiple-choice questions, a response either earns the full points or it does not.
- Changing a key later is safe: the modal warns you that scores for all existing responses will be recalculated, and they are.
Once a key is saved, the question shows a green graduation-cap badge on the Setup tab with the point value, and hovering it confirms the weight. Answer keys are available on choice questions and on the rows of single-choice and multiple-choice grids (each grid row has its own tools menu and key). Range, NPS, Number and open text questions cannot be graded, and neither can yes/no grid rows.
The Answer Key modal also has a mode toggle at the top. Everything above describes Right / wrong answers. For a standardized assessment scale, where every answer is valid but worth a different number of points and the total maps to a severity band, switch to Points per answer instead. See Scoring Assessment Scales with Points and Severity Bands.
What every respondent gets
As each sheet is scanned and processed, or each web form submitted, the entry's total score is computed as the sum of points from correctly answered questions, minus any deductions. On the Responses tab a Score column shows the raw score (the bare number, for example 10), and because we set a threshold, a green or red Pass/Fail column appears next to it. Web respondents see their result on the thank-you screen as "Your score: 10 / 14 - Pass".
The pass rule is exactly the one the Pass Rate Calculator applies to pasted scores: pass when score >= maximum × threshold / 100. Here that is 14 × 70 / 100 = 9.8, so 10 points passes and 9 fails.
The class at a glance: the Test Results card
Open Analysis, then the Results tab. Once grading is on and at least one response has been processed, a Test Results card appears at the top with an Overview view.
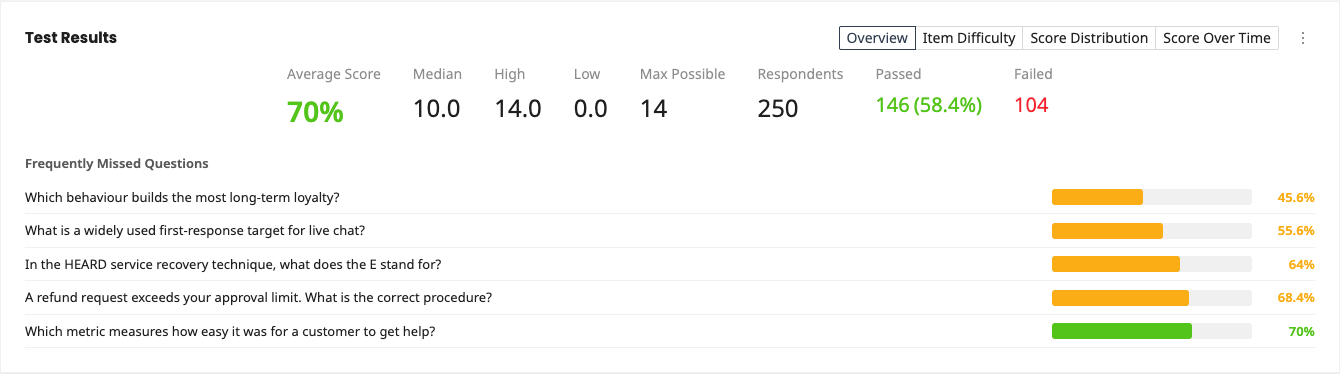
For our 250 test-takers the Overview shows Average Score 70% in green, Median 10.0, High 14.0, Low 0.0, Max Possible 14, Respondents 250, and the verdicts: Passed 146 (58.4%) and Failed 104. That 58.4% is the pass rate, computed as 146 passing scores out of 250, the same division the calculator does. Below the statistics, the Frequently Missed Questions list ranks the five hardest items; here the top offender is "Which behaviour builds the most long-term loyalty?" with only 45.6% answering correctly, which tells the trainers exactly which module to revisit.
See where the pass line falls
Switch the card to the Score Distribution view for a histogram of total scores.
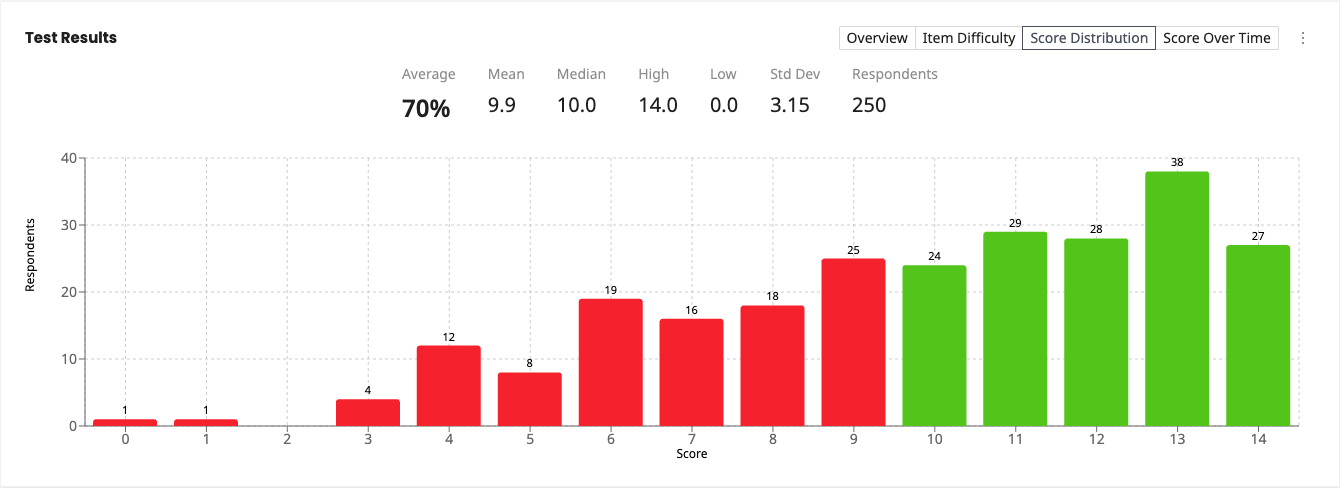
The header repeats Average 70%, Mean 9.9, Median 10.0, High 14.0, Low 0.0, Std Dev 3.15 and Respondents 250. Bars below a score of 10 are red and bars from 10 to 14 are green, split by a marked pass threshold at 9.8 points (70% of 14). A big red cluster just under the line is a signal worth acting on: those people missed passing by one or two points, so a short refresher may convert most of them. The card also offers Item Difficulty and Score Over Time views, covered in detail in Test and Exam Analysis Charts.
How this maps to the free calculators
- The Grade Calculator turns one score into a percentage, points ÷ total × 100. PaperSurvey does the same per respondent: someone with 10 of 14 points sits at 71.4%, and the card's Average Score is the class-wide version of that percentage.
- The Pass Rate Calculator applies score >= max × threshold% to a pasted list of scores. The app applies the identical rule automatically to every processed entry, which is where Passed 146 (58.4%) comes from.
- The Weighted Grade Calculator works differently: it averages separately graded components (say, coursework 40% and exam 60%) from their percentage scores. PaperSurvey does not average component percentages; it weights whole questions through their Points. To make a section count more, give its questions more points, like our 2-point scenario questions. If you need a true component-weighted grade across several tests, export the scores and combine them in that calculator or a spreadsheet.
Export the scores
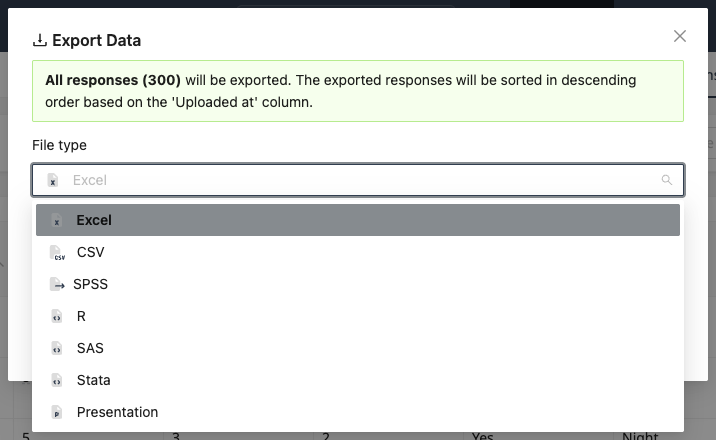
On the Responses tab, click Export to download the graded data as Excel, CSV, SPSS, R, SAS, Stata or a Presentation. The export includes a Total Score column, plus a Pass/Fail column whenever a threshold is set. For per-question marks, set Cell Values to Quiz points (this option appears only on graded surveys): correctly answered cells then show the points earned, while wrong answers still show the option label picked.
One subtlety if your test uses conditional logic: exports compute Pass/Fail against the survey-level maximum (all graded questions), while the Responses tab, thank-you screen and API use a per-respondent maximum that excludes questions hidden from that person by conditions. On a test with no conditional questions, like this one, the two are identical.
Next steps
- Test and Exam Analysis Charts for Item Difficulty, discrimination and correct-answer highlighting.
- Exporting Survey Data for the full export options.
- Check a single result with the Grade Calculator, or paste a score list into the Pass Rate Calculator to replicate the card's pass rate.
- Combine component grades outside the app with the Weighted Grade Calculator.