Discrimination Index Calculator
See how well a question separates strong from weak students. Paste each student’s total score and whether they got this item right (1) or wrong (0), in the same order.
Learn how to calculate it yourselfEnter your values
Results update as you type.
How to enter your data
This calculator asks for four counts. In the first two boxes, type how many of your top-scoring students got the question right and how many students are in that top group. In the last two boxes, type how many of your bottom-scoring students got it right and how many students are in that bottom group. It then works out the index for you.
Discrimination index
Check your inputs
Enter valid values to see your result. Use the field hints or open the data guide for help.
The Item Discrimination Index Calculator works out how well a single test question tells apart the students who did well on the whole test from those who did poorly. It gives you one number, from -1 to +1. A higher positive number means your stronger students got that question right more often than your weaker students, which is what a good question should do. A number near zero, or below zero, means the question is not sorting students well and probably needs fixing.
Calculate it yourself
Example: total scores are 8, 7, 6, 5, 4, 3, 2, 1. The matching item results are 1, 1, 0, 1, 0, 1, 0, 0, where 1 means correct.
Follow this worked example, then repeat the steps with your own numbers.
Choose the upper and lower group sizes
Group size = round up(8 × 0.27) = round up(2.16) = 3Sort by total score while keeping each item result attached. Take the top three and bottom three students.
Find each group’s correct proportion
Upper: (1 + 1 + 0) ÷ 3 = 2/3; lower: (1 + 0 + 0) ÷ 3 = 1/3Subtract the lower proportion
D = upper proportion − lower proportion = 2/3 − 1/3 = 1/3 ≈ 0.333
A positive value means higher-scoring students were more likely to answer correctly. This calculator rounds each 27% group up; ties at a group boundary can affect the result.
Check your answer in the calculatorBuilt into PaperSurvey.io
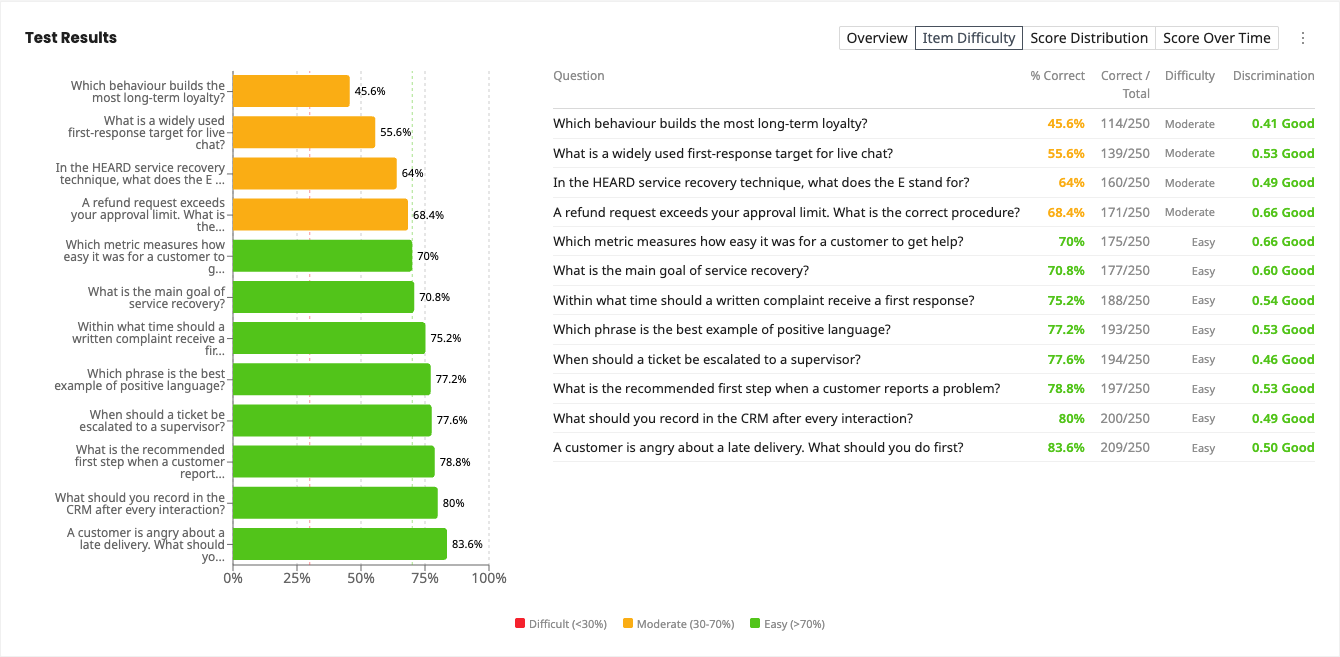
Review discrimination alongside item difficulty to identify graded questions that may need attention.
Where it is used
- Teachers: After marking a class exam, a teacher checks whether question five actually separates the strong students from the weak ones, or whether it should be reworded.
- Corporate trainers and HR staff: An HR trainer reviews a workplace safety quiz to spot questions that everyone passes or that confuse the best learners.
- Online course creators: A course creator tests each quiz question in an online lesson to keep the ones that reward students who understood the material.
Upper/lower 27% method
The discrimination index compares how the top 27% and bottom 27% of scorers performed on an item. A value of 0.3 or higher is good; low or negative values suggest the item is flawed or miskeyed.
When should you use it?
Use this after you have marked a whole test or quiz and worked out each person's total score. It is made for checking one question at a time, so you can see whether that question helps tell your stronger and weaker takers apart. It works best when you have a reasonable number of people, ideally twenty or more, and when the test measures a single subject or skill. Teachers, trainers and course creators use it to decide which questions to keep, reword or drop before running the test again.
What does the result mean?
The result is a single number between -1 and +1. A higher positive number is better: it means your top students got the question right more often than your bottom students, which is what a fair question should do. A common guide from Ebel and Frisbie rates 0.40 and above as very good, 0.30 to 0.39 as good, 0.20 to 0.29 as weak and in need of work, and below 0.20 as poor. A negative number is a warning sign that something may be wrong with the question.
Mistakes to avoid
Do not rely on it with only a handful of students, because small groups give shaky, misleading numbers. Do not swap the two groups by accident, as putting the bottom group's counts in the top group's boxes will flip the result. Remember that a very easy or very hard question, where almost everyone scores the same, will always show a low value, and that does not always mean the question is bad. Finally, treat any negative value as a prompt to check your answer key for mistakes.
How to use this calculator
- Mark the full test and add up each student's total score.
- Sort students by total score, then pick a top group and a bottom group of equal size, often the top and bottom 27 percent.
- For the question you are checking, count how many in each group got it right, then type those counts and each group's size into the boxes.
- Read the index and compare it with the guide, aiming for 0.30 or higher.
Worked example
Say 40 students take a quiz. You take the top 10 scorers and the bottom 10 scorers. Nine of the top ten got question five right, but only three of the bottom ten did. You type 9 and 10 for the top group, then 3 and 10 for the bottom group. The calculator shows 0.60, which counts as a very good, well-working question.
Frequently asked questions
What do I type in each box?
Type four whole numbers: how many top-scoring students got the question right, the size of that top group, how many bottom-scoring students got it right, and the size of that bottom group.
Where do I get these numbers?
From your own marked test. Add up each person's total score, list everyone from highest to lowest, then choose an equal-sized top group and bottom group and count the correct answers for the one question you are checking.
How do I choose the top and bottom groups?
A common method is the top 27 percent and the bottom 27 percent of scorers, but any equal-sized top and bottom slice works. With a small class you can simply use the top half and the bottom half.
What counts as a good value?
Higher is better. A widely used guide rates 0.40 and above as very good, 0.30 to 0.39 as good, 0.20 to 0.29 as weak, and below 0.20 as poor.
What does a negative result mean?
It means weaker students got the question right more often than stronger students. That usually points to a confusing question or a mistake in the answer key, so check it carefully.
Get Started with PaperSurvey.io Software
Start your 14-day free trial now, no credit card required.