Item Difficulty Calculator
Analyse a test question. The item difficulty index is the share of students who answered it correctly.
Learn how to calculate it yourselfEnter your values
Results update as you type.
How to enter your data
Type two whole numbers: in the first box put how many people answered the question correctly, and in the second box put the total number of people who answered it. The first number must be the same as or smaller than the second. If you want to check several questions, do them one at a time, entering a fresh pair of numbers for each.
Item difficulty
moderate item
The Item Difficulty Index Calculator tells you how easy or hard a single test question was for the people who answered it. You give it how many people got the question right and how many people answered it in total, and it works out the share who got it right, shown as a number between 0 and 1 (the same as a percentage). A high number, close to 1, means the question was easy because almost everyone got it right; a low number, close to 0, means it was hard because very few did.
Calculate it yourself
Example: 12 students answered a question correctly and 8 answered it incorrectly.
Follow this worked example, then repeat the steps with your own numbers.
Count all students
Total students = 12 + 8 = 20Find the proportion answering correctly
p = correct ÷ total = 12 ÷ 20 = 0.60Express the index as a percentage
Item difficulty = 0.60 × 100 = 60%A higher index means an easier question because more students answered correctly.
In item analysis, the letter p means the proportion correct. It is different from the p-value used in a statistical significance test.
Check your answer in the calculatorBuilt into PaperSurvey.io
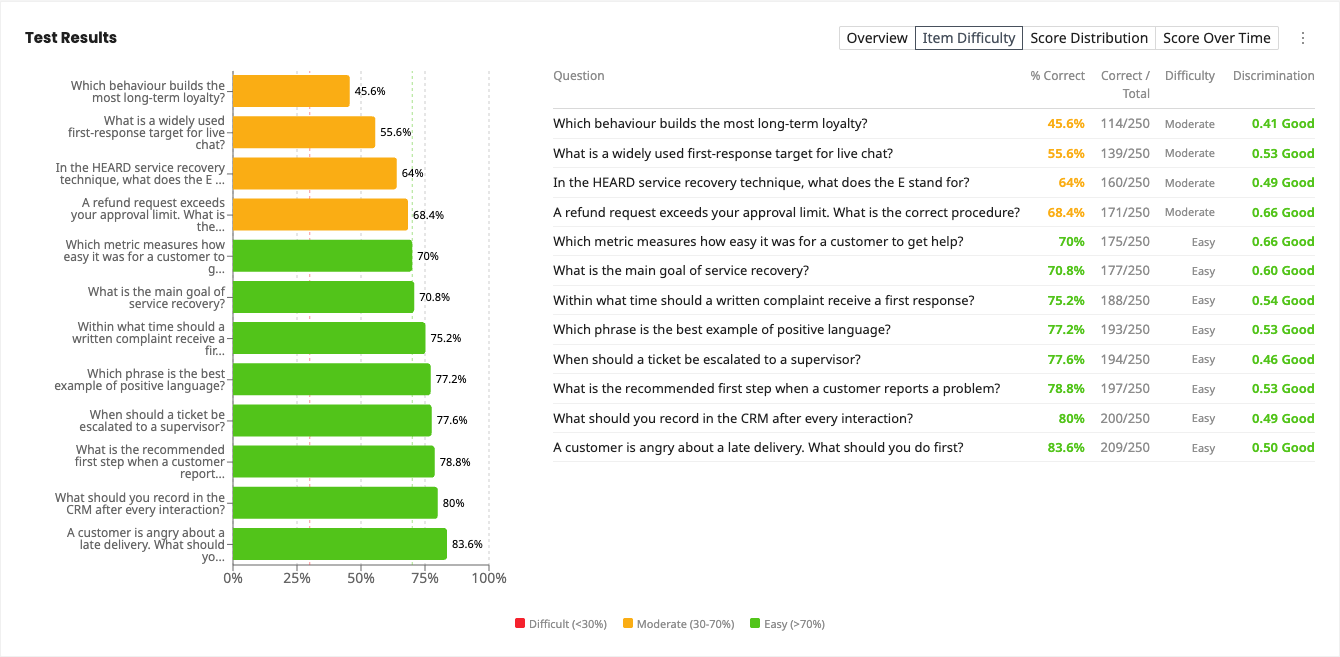
Open Item Difficulty in Test Results to see the percentage answering each graded question correctly.
Where it is used
- Teachers: A teacher checks each question on last week's spelling quiz to see which ones nearly every child got right and which ones almost no one managed.
- Training and HR staff: An HR trainer reviews a workplace safety test to find questions that were so easy they told them nothing, or so hard that staff clearly had not learned the material.
- Course and exam writers: Someone building a certification exam tests each new question on a trial group to keep only questions that are neither too easy nor too hard.
Reading the difficulty index
The item difficulty index (p) runs from 0 to 100%. Higher means easier. Items around 30–70% usually discriminate best between stronger and weaker students; very easy or very hard items carry little information.
When should you use it?
Use it after a test, quiz, or exam when you want to know how each question performed, not just how each person scored. It works for any question that is marked simply right or wrong, such as multiple choice, true or false, or short factual answers. It is handy when you are deciding which questions to keep, reword, or drop for next time, or when you want to explain why a question was easy or hard. Check one question at a time. You need the results from a real group of people who actually answered that question.
What does the result mean?
The result is a number from 0 to 1, which is the same as 0 to 100 percent. It is simply the share of people who got the question right. Higher means easier. A value near 1 means almost everyone got it right, and a value near 0 means almost no one did. Many educators aim for questions somewhere in the middle, roughly 0.3 to 0.7, because those tell you the most about who knew the material. Around 0.5 is often seen as ideal. Very high or very low values are not wrong, they just carry less information.
Mistakes to avoid
Do not swap the boxes. The number who got it right goes first, and it can never be larger than the total who answered. Do not include people who skipped the question in the total unless you are counting a blank as wrong on purpose, because that changes the result. Do not judge a question on a tiny group; a handful of people can make the value jump around. Remember an easy question is not automatically a bad one. And do not confuse this with how well a question separates strong students from weak ones, which is a different measure.
How to use this calculator
- In the first box, type how many people answered the question correctly.
- In the second box, type the total number of people who answered that question.
- Check that the first number is not bigger than the second, then let the calculator work out the result.
- Read the value from 0 to 1: closer to 1 means the question was easy, closer to 0 means it was hard.
Worked example
Suppose 30 students took a test and 24 of them answered question 5 correctly. Type 24 in the first box and 30 in the second box. The calculator divides 24 by 30 and gives 0.8, which means 80 percent got it right, so question 5 was a fairly easy question.
Frequently asked questions
What do I type in each box?
In the first box, type how many people answered the question correctly. In the second box, type the total number of people who answered it. Both are plain whole numbers.
Where do I get these numbers?
Count them from your marked papers or your online quiz results. For one question, count how many people got it right, then count how many people answered it at all.
What does the final number actually mean?
It is the share of people who got the question right, shown from 0 to 1. For example, 0.8 means 80 percent got it right, so the question was fairly easy.
What is a good value?
There is no single right answer, but many teachers like questions between about 0.3 and 0.7, with 0.5 often seen as ideal. Values above roughly 0.85 are very easy and below about 0.2 are very hard.
Does a low number mean the question is bad?
Not always. A low number just means the question was hard. It could be a fair, challenging question, or it could be confusingly worded, so it is worth a closer look.
Get Started with PaperSurvey.io Software
Start your 14-day free trial now, no credit card required.