A/B Test Sample Size Calculator
Plan an A/B test or two-group comparison. Enter the two rates you expect and the confidence and power you want.
Learn how to calculate it yourselfEnter your values
Results update as you type.
How to enter your data
This calculator uses simple boxes and drop-down menus, so there is nothing to paste. Type each rate as a plain number without a percent sign (for example type 20, not 20%) into the two boxes, then choose your confidence level and statistical power from the two drop-down menus. The answer updates on its own.
Sample size per group
per group
The A/B Test Sample Size Calculator tells you how many responses you need in each of two groups before you compare them, for example an old feedback form versus a new one. You enter the rate you get now and the rate you hope the new version will reach, and it shows how many people are needed in each group to tell whether any difference is real and not just luck. It stops you running a test that is too small to trust.
Calculate it yourself
Example: plan equal groups to detect a change from 20% to 30%, with 95% confidence and 80% power.
Follow this worked example, then repeat the steps with your own numbers.
Convert and average the expected rates
p₁ = 0.20; p₂ = 0.30; average p = (0.20 + 0.30) ÷ 2 = 0.25; difference = 0.10Look up confidence and power multipliers
zα = Φ⁻¹(0.975) ≈ 1.959964; zβ = Φ⁻¹(0.80) ≈ 0.841621Use a standard normal table. Confidence is two-sided, while the power multiplier uses 0.80 directly.
Calculate the two uncertainty terms
A = √[2 × 0.25 × 0.75] ≈ 0.612372; B = √[0.20 × 0.80 + 0.30 × 0.70] ≈ 0.608276Apply the two-proportion formula
n per group = (zα × A + zβ × B)² ÷ (p₂ − p₁)² ≈ 293.1513Keep the unrounded table values through this calculation when possible.
Round up each group
294 participants per group; total = 2 × 294 = 588
This approximation assumes independent observations and equal group sizes. The rate difference is 10 percentage points, not a 10% relative increase. Plan extra recruitment if some participants will not provide usable data.
Check your answer in the calculatorUse your PaperSurvey.io results
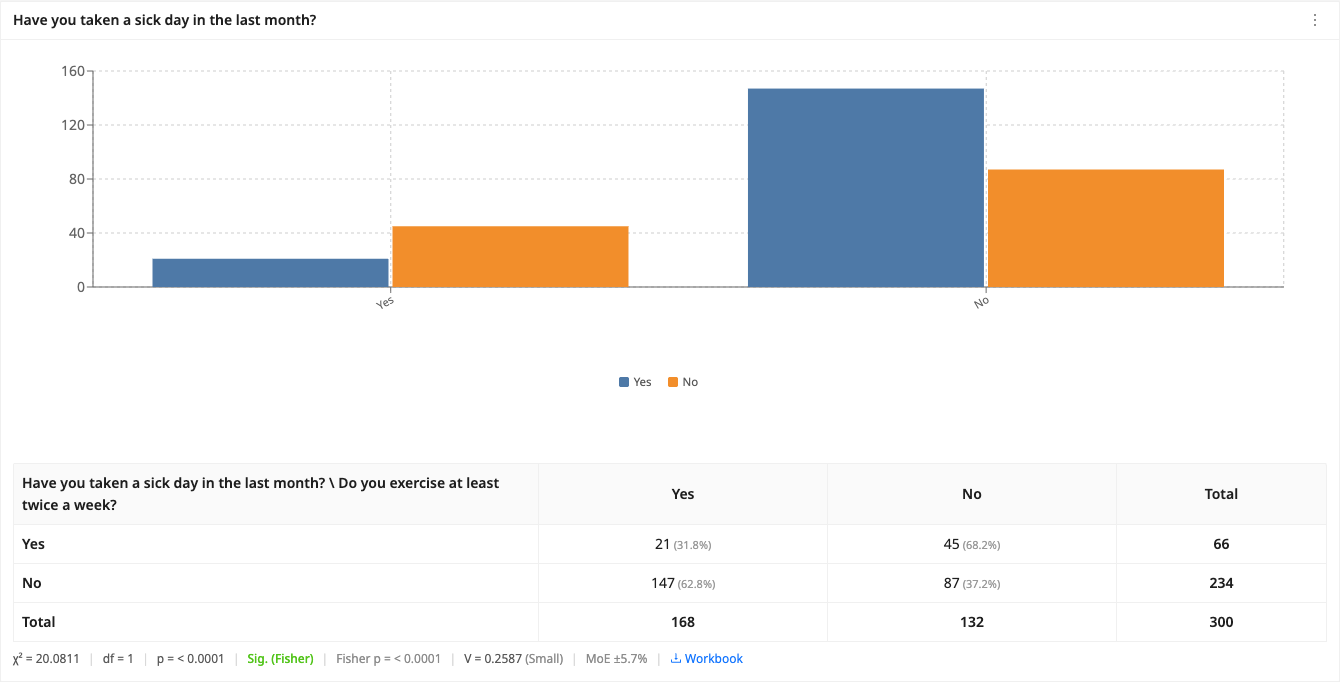
Plan the required participants per group here, then compare the collected binary outcomes in PaperSurvey.
Where it is used
- Small-business owners: A shop owner about to test two versions of a feedback card checks how many returned cards each version needs before the results can be trusted.
- Marketing and customer-service staff: A team testing two versions of a survey email works out how many recipients each version needs to see which one gets more replies.
- Students and researchers: A student planning a study that compares the sign-up rate of two different posters uses it to decide how many people each group must include.
Power and confidence
Power is the chance of detecting a real difference when one exists (80% is typical). Confidence controls false positives. Smaller differences between the two rates require much larger samples to detect reliably.
When should you use it?
Use this before you run any test that compares two versions of something, where each person either does the thing or does not, such as returning a form or clicking a link. It works out how many people you need in each group before you start, so your test is big enough to trust. Reach for it when you are about to compare two feedback cards, two email versions, two sign-up pages, or two reminder methods, and you want to know whether a real difference exists between them.
What does the result mean?
The number shown is the sample size per group. That means you need about that many responses in each version, so double it to get the grand total. If you collect fewer than this, a real difference between the two versions may be too small to spot, and you could draw the wrong conclusion. The common settings are 95 percent confidence and 80 percent power, which most researchers accept as the standard choice. Smaller gaps between your two rates always need much larger groups to prove.
Mistakes to avoid
Do not leave the two rates equal; if both are the same there is nothing to detect and no answer appears. Enter each rate as a plain number, not with a percent sign. Remember the result is per group, not the total, so you need it twice over. Do not stop your test early just because one version looks ahead; wait until each group reaches the planned size. And do not guess wildly at your expected rate, base it on past results whenever you can.
How to use this calculator
- In the first box, type your baseline rate as a plain number, which is the percentage your current version gets now.
- In the second box, type the expected rate you hope the new version will reach.
- Pick a confidence level and a statistical power from the drop-down menus; 95 percent and 80 percent are the usual choices.
- Read the Sample size per group number, which is how many responses to collect in each version, and double it for the total.
Worked example
A cafe gets feedback cards returned by about 20 out of every 100 diners. They design a friendlier card and hope 25 out of 100 will return it. They type 20 in the first box and 25 in the second, and leave confidence at 95 percent and power at 80 percent. The calculator shows about 1,094 per group, so they need roughly 1,094 returned cards for each version, about 2,188 in total, before they can trust the difference.
Frequently asked questions
What do I type in the first box?
The baseline rate, meaning the result your current version already gets, written as a percentage. For example, if 1 in 5 people return your form, type 20.
What is the expected rate?
It is the result you hope the new version will get, again as a percentage. Type the rate you would be pleased to see, such as 25.
Where do I get these numbers?
From your own past surveys or records. If you have never measured it, run the current version for a while first, or use a sensible estimate.
What do confidence and power mean?
Confidence is how sure you want to be that a difference is real, and 95 percent is standard. Power is the chance of catching a real difference if it exists, and 80 percent is standard. Leave them at the defaults if you are unsure.
What does the final number tell me?
How many responses you need in each group. Collect at least that many per version, then compare the two rates.
Get Started with PaperSurvey.io Software
Start your 14-day free trial now, no credit card required.