If you have tried our free T-Test Calculator or ANOVA Calculator, you already know the mechanics: paste two or more groups of numbers, get a test statistic and a p-value. PaperSurvey runs the same tests directly on your collected responses, so you never have to copy numbers out by hand. This walkthrough uses the Employee Wellbeing Study demo survey, where 300 employees answered questions about sleep, energy, exercise and shift patterns.
Two groups: the Welch t-test
The wellbeing team wants to know whether people who exercise report different energy levels than people who do not. That is a numeric question (energy, rated 1 to 10) split by a two-option question (exercise, Yes/No), which is exactly what a two-sample t-test is for.
- Open the survey and go to Analysis, then the Compare Responses tab.
- Under "How do responses differ based on:" pick "How would you rate your energy level during a typical workday?".
- Switch the toggle in the top right from Simple to Advanced to see the full test statistics.
Each result card is titled with the other question in the pair. On the card for "Do you exercise at least twice a week?" the stats line reads: T-test | t = -3.1818 | df = 279.1 | p = 0.0016 | Sig. | d = 0.3742 (small), followed by each group's summary: No: mean=6.093, SD=1.7653, n=129 and Yes: mean=6.7702, SD=1.8448, n=161.
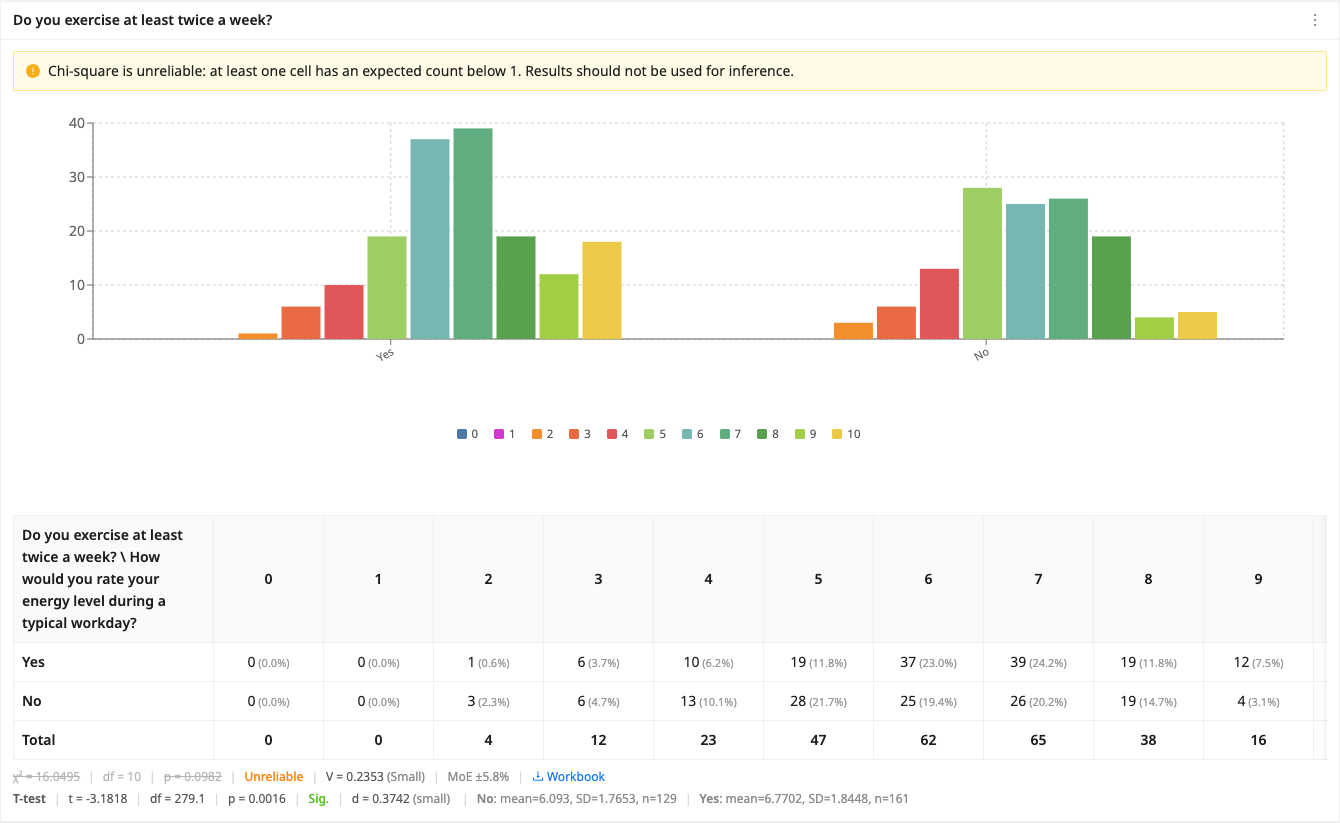
Exercisers average 6.77 on the energy scale against 6.09 for non-exercisers, and with p = 0.0016 that difference is very unlikely to be sampling noise. PaperSurvey uses Welch's t-test, which does not assume the two groups have equal variances, so the degrees of freedom come out fractional (279.1 here). The T-Test Calculator uses the identical Welch method on pasted values, which makes it a handy cross-check or a way to test numbers that never went through a survey.
Effect size: Cohen's d
Significance tells you a difference exists, Cohen's d tells you whether it matters. The same stats line shows d = 0.3742 (small), computed with the pooled standard deviation, and its tooltip spells out the conventional bands: 0.2 = small, 0.5 = medium, 0.8 = large. A 0.37 effect is real but modest, worth acting on only if exercise programs are cheap.
Cohen's d appears on the Compare Responses card and in the Cross-Tab dashboard widget. The downloadable comparison workbook's Group Comparison sheet lists each group's n, mean and standard deviation plus the t statistic, df and p, but not d. If you need the effect size outside the app, the free Cohen's d Calculator computes it with the same pooled-SD formula from two pasted groups of raw values, so export the responses and paste each group's values in.
Three or more groups: ANOVA runs automatically
Shift work is the team's second question, and "Which shift do you usually work?" has three options: Morning, Evening and Night. You do not need to do anything different. When the grouping question has three or more groups, the same Compare Responses card switches from a t-test to a one-way ANOVA.
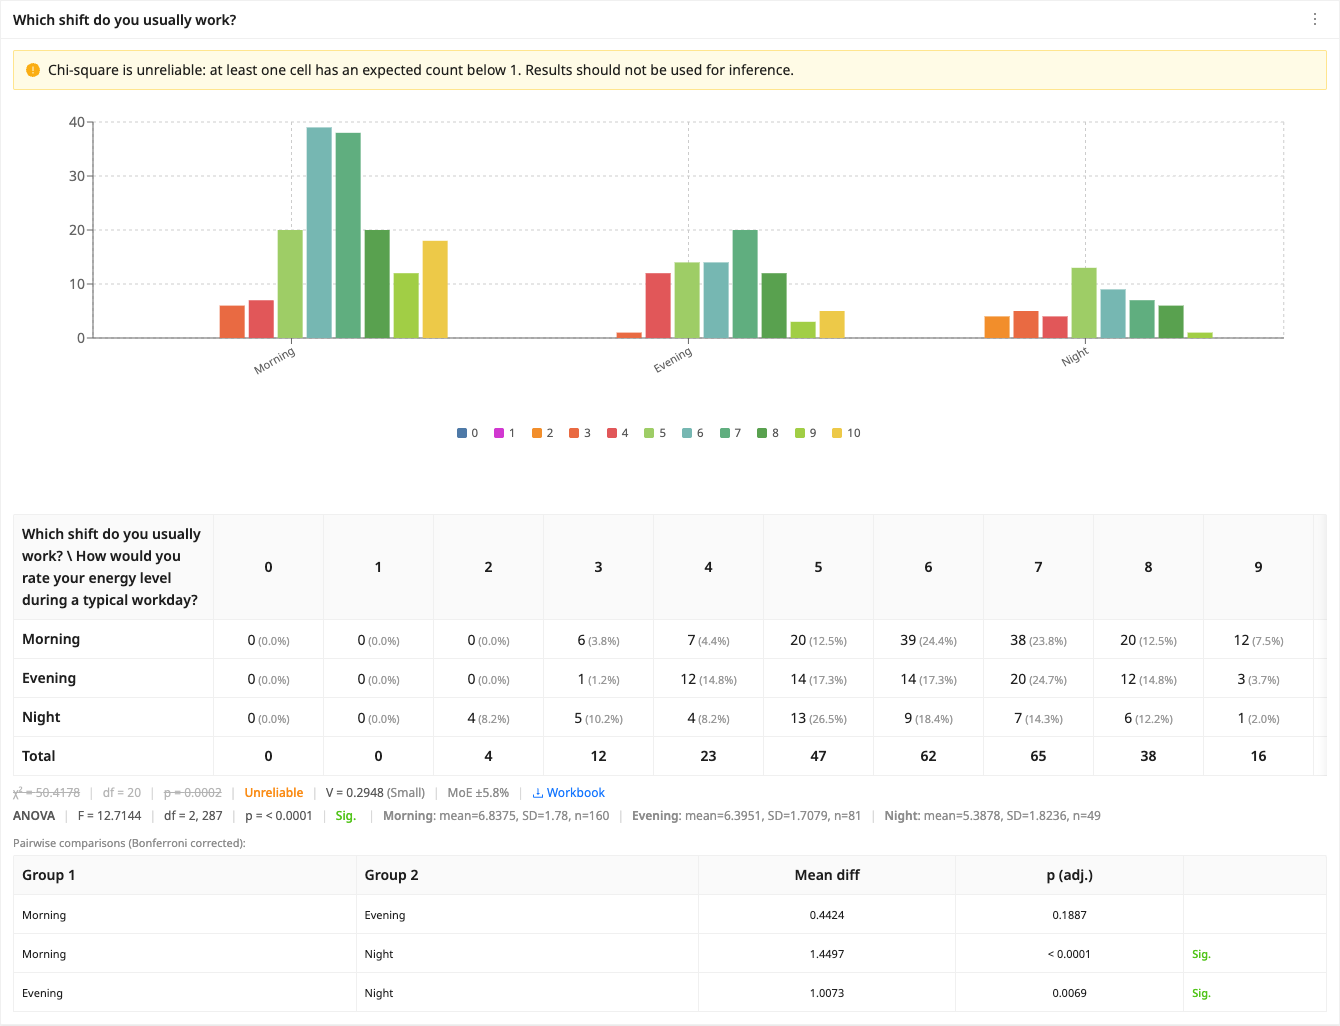
The card for the shift question shows ANOVA F = 12.7144, df = 2, 287, p < 0.0001, Sig., with the group means underneath: Morning 6.8375 (SD 1.78, n=160), Evening 6.3951 (SD 1.7079, n=81) and Night 5.3878 (SD 1.8236, n=49). The ANOVA only says "at least one shift differs", so PaperSurvey adds a "Pairwise comparisons (Bonferroni corrected)" table that pins down which pairs differ:
- Morning vs Night: mean difference 1.4497, p < 0.0001, Sig.
- Evening vs Night: mean difference 1.0073, p 0.0069, Sig.
- Morning vs Evening: mean difference 0.4424, p 0.1887, not significant.
Night shift is the problem, not a Morning versus Evening gap. The Bonferroni correction inflates each pairwise p-value to account for running three tests at once, which protects you from the false positives that uncorrected repeated testing produces. Two honest limitations are visible on this card too. A yellow note explains that the chi-square test is unreliable for this pairing because expected cell counts fall below 1, which is precisely why the ANOVA line is the verdict to read. And no per-pair Cohen's d is shown in ANOVA mode, so if you need one, export the responses and paste the two groups' raw values into the Cohen's d Calculator. The public ANOVA Calculator returns F, both degrees of freedom and p on pasted groups, but it has no post-hoc table, so the in-app Bonferroni comparisons go a step further than the free tool.
Against a benchmark: the one-sample t-test widget
Sometimes the comparison is not between groups but against a target. The team wants to know whether work-life balance, rated 1 to 10, sits meaningfully above 5, the score they treat as neutral.
- Open an analysis view under Analysis (or use the auto-built Statistical Deep-Dive view, which already places a one-sample t-test for the survey's headline metric).
- Click Edit, then Add, and pick One-sample t-test from the Advanced stats category.
- Choose the question, then open the inspector's Advanced panel and set "Test against mean" to 5. If you leave it blank it defaults to the scale midpoint, so set it explicitly when your benchmark is anything else.

The card shows Sample mean 6.244, t 11.221 and p-value < 0.001, with the footer "Tested against 5 • n = 278 • df = 277". Balance is convincingly above neutral. The widget displays t, df, p and the sample mean; it does not show a standard error. To cross-check the result, the One-Sample T-Test Calculator accepts the raw values plus a hypothesised mean and returns the same t, df, p and sample mean. You can also create this widget straight from a numeric chart on the Results tab: open the chart's "..." menu (its tooltip says Actions) and pick One-sample t-test under "Analyze as".
Same people, two measures: the paired t-test
The paired t-test compares two numeric questions answered by the same respondents, matching answers person by person. Its classic use is a before and after measurement, and PaperSurvey's Before/After Table question supports that directly: on its Results card, the "..." menu's "Save to View" group offers a "Paired t-test" entry per statement whenever the table has five or fewer statements. The widget is also pre-configured with a detected before/after pair when your question labels contain matching before and after wording.
The wellbeing study has no repeat measurement, so as a demonstration the team paired the sleep-hours and energy questions, which run on similar numeric ranges, using the widget's "Before / condition A" and "After / condition B" pickers from the same Add library.

The card reports Mean difference 0.608, t 7.783, p-value < 0.001 and "n = 281 pairs • df = 280". Note the n: only the 281 respondents who answered both questions count as pairs, out of 300 total. Pairing is always by respondent within one survey, so you cannot pair a January survey against a June survey; put both measurements in the same survey (a Before/After Table is the cleanest way) if you plan a paired analysis. The Paired T-Test Calculator runs the same test on two pasted columns when your paired data lives outside PaperSurvey.
What the app does not compute, and the export route
A few things deliberately stay outside the app. Groups on Compare Responses always come from the option labels of a question, so if you need custom segments (for example "Night shift AND no exercise" versus everyone else), the Comparison Chart widget can chart two filter-defined groups but shows counts only, with no significance test. The paired t-test card shows no effect size. And there is no repeated-measures or two-way ANOVA.
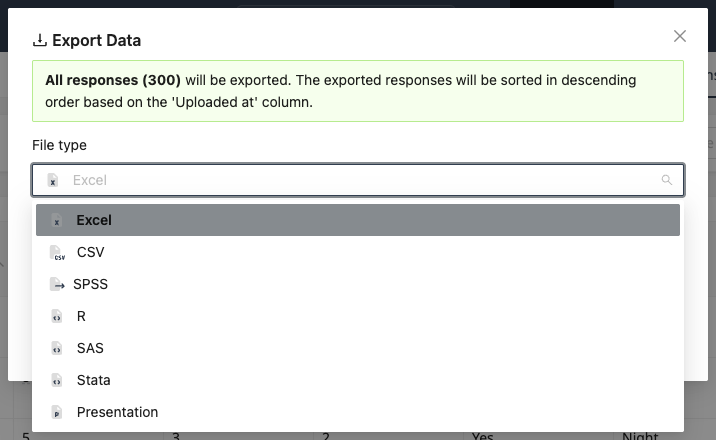
For all of those, the workflow is: collect with PaperSurvey, export, then compute. Open the Responses tab, click Export and pick a file type. Excel works for the free calculators, while the SPSS and R exports carry numeric codes and value labels ready for t.test(), aov() or their SPSS equivalents.