Cohen's d Calculator (Effect Size)
Measure the size of a difference between two groups. Paste each group's values.
Learn how to calculate it yourselfEnter your values
Results update as you type.
How to enter your data
Put each of your two groups on its own line. On each line, type that group's individual scores separated by commas (for example, 4, 5, 3, 5 on the first line and 2, 3, 3, 4 on the second). The calculator works out each group's average and spread for you, so you only paste the raw numbers.
Cohen's d
Check your inputs
Enter valid values to see your result. Use the field hints or open the data guide for help.
Cohen's d tells you how big the difference is between the average scores of two groups. It does not just say group A scored higher than group B; it tells you how large that gap is compared with how spread out people's answers were. A bigger Cohen's d means a more noticeable, more meaningful difference between the two groups.
Calculate it yourself
Compare group A = 2, 4, 6 with group B = 1, 3, 5 using a pooled standard deviation.
Follow this worked example, then repeat the steps with your own numbers.
Find each group mean
Mean A = 4; mean B = 3. Each group has n = 3.Find each sample variance
Variance A = (4 + 0 + 4) ÷ 2 = 4. Variance B = 4.Pool the variances and take the square root
Pooled SD = √[((3 − 1) × 4 + (3 − 1) × 4) ÷ (3 + 3 − 2)] = 2.Standardize the mean difference
d = (4 − 3) ÷ 2 = 0.5.The sign follows A minus B. The magnitude expresses the difference in pooled standard-deviation units.
Built into PaperSurvey.io
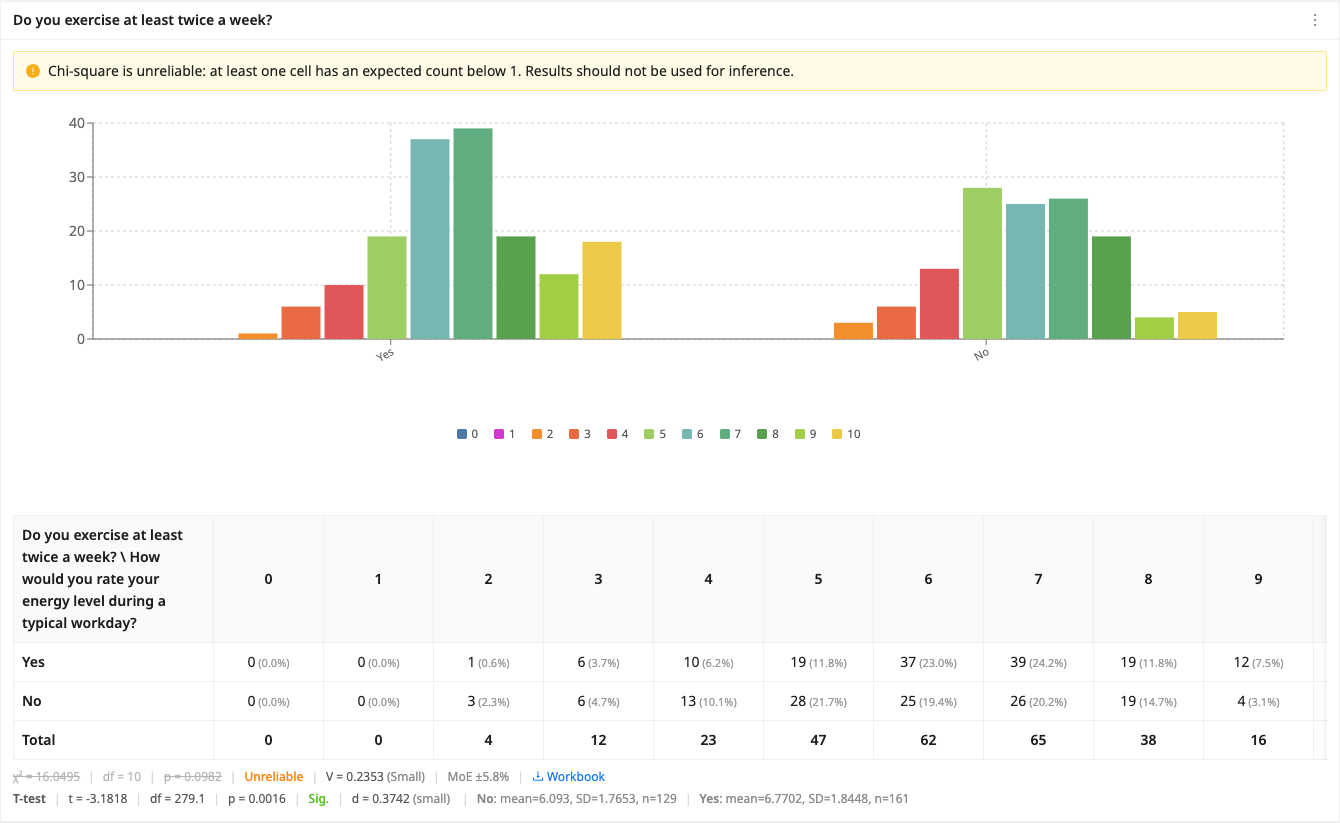
Read Cohen’s d on a two-group numeric comparison to assess the size of the difference as well as its significance.
Where it is used
- Teachers: A teacher compares the test marks of a class taught with a new method against a class taught the old way to see how much the new method helped.
- Small-business owners: A cafe owner compares customer happiness ratings from before and after a menu change to judge whether the change made a real difference.
- Market researchers: A researcher compares how two groups of shoppers rated the same product to see whether one group clearly liked it more.
Interpreting Cohen’s d
Cohen’s d expresses the difference between two means in standard deviation units. As a rough guide, 0.2 is a small effect, 0.5 medium and 0.8 or more large. Unlike a p-value, it does not depend on sample size.
When should you use it?
Use it whenever you have two groups and want to know how different their average answers really are. For example, one class versus another, customers before a change versus after, or one region versus another in a survey. A plain gap between two averages can look big or small depending on the scale you used. Cohen's d puts that gap on a common yardstick, so you can compare it fairly and decide whether the difference is large enough to be worth acting on.
What does the result mean?
The result is a single number. The larger it is, the bigger the gap between the two groups. A widely used guide from the statistician Jacob Cohen says that about 0.2 is a small difference, about 0.5 is medium, and about 0.8 or more is large. A value near zero means the two groups are almost the same. The plus or minus sign in front simply shows which group scored higher, so you can ignore the sign and focus on the size of the number.
Mistakes to avoid
Do not read Cohen's d as a percentage; a value of 0.5 does not mean fifty percent. Do not compare groups measured on different scales or different questions, because the number only makes sense within one shared measure. Watch out for very small groups: with only a handful of people, the result can swing around a lot and mean very little. Finally, a large Cohen's d shows the difference is sizeable, but on its own it does not prove that one thing caused the other.
How to use this calculator
- Type or paste your first group's scores on the first line, with the numbers separated by commas.
- Type or paste your second group's scores on the next line in the same way.
- Let the calculator work out each group's average and spread and show the Cohen's d value.
- Read the number: bigger means a larger difference, using 0.2 for small, 0.5 for medium and 0.8 for large as a guide.
Worked example
Imagine a teacher tries a new way of teaching. The class taught the new way averages 78 on a test, while the class taught the old way averages 72. After pasting both classes' scores into the calculator, it returns a Cohen's d of about 0.5. That is a medium-sized difference, so the new method appears to help and is probably worth looking into further.
Frequently asked questions
What numbers do I put in?
Paste the individual scores for each of your two groups, with one group on each line. The calculator finds each group's average and spread on its own, so you do not have to do any maths first.
Where do I get these numbers?
They usually come from survey answers or test scores, such as a rating from 1 to 5 or a mark out of 100. Any measure where each person gives a number will work.
What is standard deviation and do I need to work it out?
Standard deviation is just a measure of how spread out the answers are. You do not need to calculate it yourself; the calculator works it out from the numbers you paste.
What counts as a big result?
Around 0.2 is small, 0.5 is medium, and 0.8 or above is large, following Cohen's well-known guide. The higher the number, the clearer the difference between your two groups.
Can I use it for more than two groups?
No. Cohen's d compares exactly two groups at a time. To compare three or more groups, run the calculator on each pair separately.
Get Started with PaperSurvey.io Software
Start your 14-day free trial now, no credit card required.