T-Test Calculator (Two Samples)
Compare the means of two independent groups. Paste each group's values on its own line or in its own box.
Learn how to calculate it yourselfEnter your values
Results update as you type.
How to enter your data
This calculator has two boxes, one for each group. Put every number from your first group in the first box and every number from your second group in the second box. Type each value and separate them with a comma, a space, or a new line, and enter only plain numbers with no words or symbols.
t statistic
Check your inputs
Enter valid values to see your result. Use the field hints or open the data guide for help.
The Two-Sample T-Test (Welch) compares the average of two separate groups to tell you whether the difference between them is likely real or just down to random chance. You enter the individual numbers from each group, and it gives you a p-value: a small p-value (usually below 0.05) means the two groups genuinely differ. The Welch version is the safe everyday choice because it does not assume the two groups are the same size or spread out by the same amount.
Calculate it yourself
Example: compare independent groups A = 2, 4, 6 and B = 1, 2, 3 with Welch’s t-test.
Follow this worked example, then repeat the steps with your own numbers.
Find each mean and sample variance
Mean A = 4; mean B = 2; sA² = (4 + 0 + 4) ÷ 2 = 4; sB² = (1 + 0 + 1) ÷ 2 = 1Each sample variance divides the squared distances from its group mean by n − 1. Both groups have n = 3.
Find the standard error of the difference
SE = √(sA² ÷ nA + sB² ÷ nB) = √(4 ÷ 3 + 1 ÷ 3) ≈ 1.2910Calculate t
t = (mean A − mean B) ÷ SE = (4 − 2) ÷ 1.2910 ≈ 1.549Calculate Welch’s degrees of freedom
df = (4/3 + 1/3)² ÷ [(4/3)²/2 + (1/3)²/2] = 50 ÷ 17 ≈ 2.941In general, the denominator is (sA²/nA)²/(nA − 1) + (sB²/nB)²/(nB − 1).
Find the two-sided probability
p = 2 × P(T with 2.941 df ≥ 1.549) ≈ 0.2209Use a t table for an approximate range, or numerical evaluation for fractional degrees of freedom. The result is not significant at 0.05.
For the displayed Cohen’s d, pooled SD = √[(2 × 4 + 2 × 1) ÷ 4] = √2.5, and d = |4 − 2| ÷ √2.5 ≈ 1.265. Welch’s test allows unequal variances; for small groups, check for strong outliers and non-normal data.
Check your answer in the calculatorBuilt into PaperSurvey.io
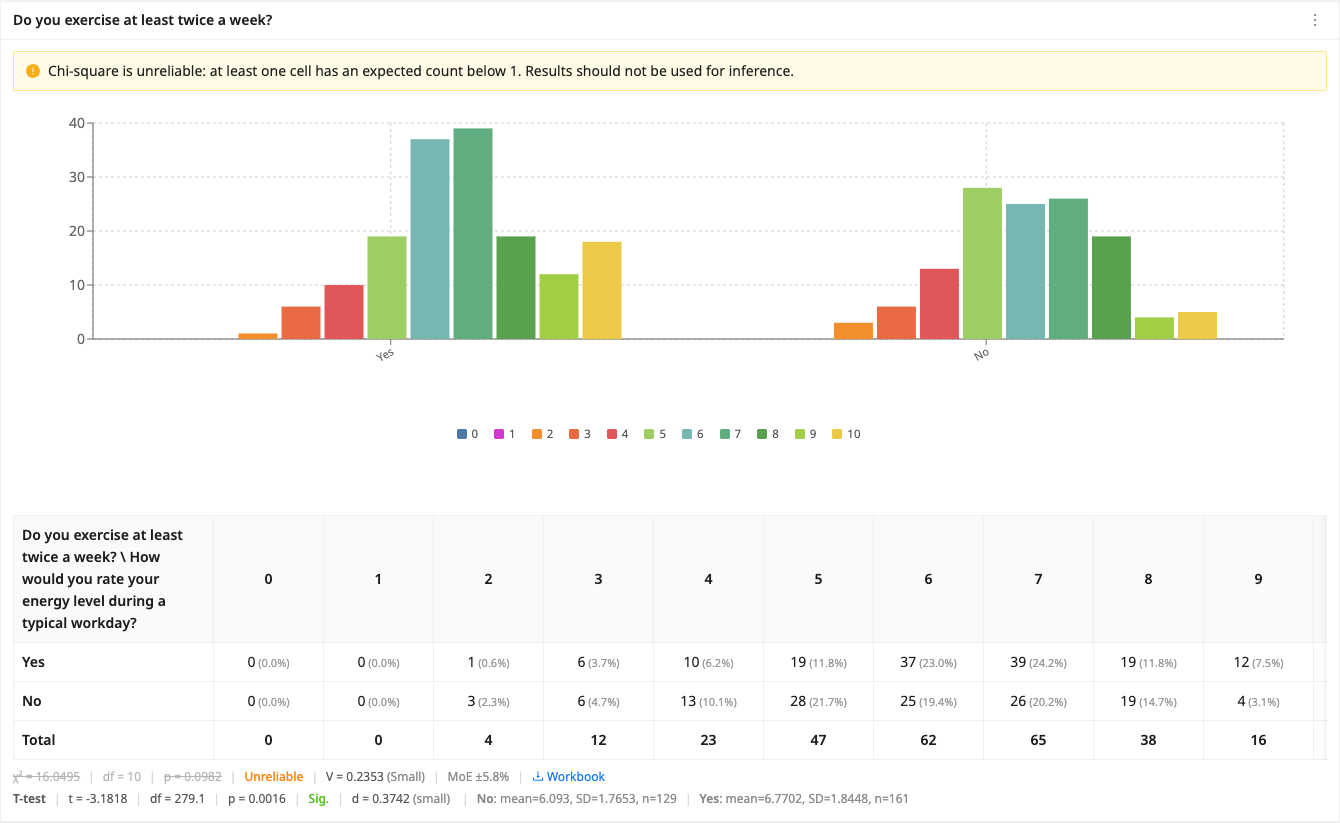
Compare a numeric question across two groups to get Welch’s t-test and each group’s summary statistics.
Where it is used
- Teachers: A teacher compares the exam scores of two different classes to see whether one class really did better or the gap is just luck.
- Small-business owners: A cafe owner compares how much customers spend at two branches to check if one location truly earns more per visit.
- HR staff: An HR officer compares staff satisfaction scores between two departments to see if one is genuinely happier than the other.
Welch's t-test
This calculator uses Welch's t-test, which does not assume the two groups have equal variances and is the recommended default for comparing two independent means. Cohen's d reports the size of the difference: 0.2 is small, 0.5 medium and 0.8 large.
When should you use it?
Use this when you have two separate groups of people or things and you want to know if their averages are really different, not just different by luck. The groups must be independent, which means no one belongs to both. Good examples are two different classes, two shop locations, or two teams. Each group should have several measurements, such as scores, prices, or times. If you measured the same people twice, like before and after a change, this is the wrong tool and you should use a paired test instead.
What does the result mean?
The main number to read is the p-value. It tells you how likely it is that the difference you see could happen by pure chance if the two groups were really the same. A small p-value means the difference is probably real. The widely used cut-off is 0.05: below 0.05 is usually called statistically significant, so you can be fairly confident the groups differ. Above 0.05 means the evidence is weak, and the gap could just be random. Always look at the two averages too.
Mistakes to avoid
Do not use it on the same people measured twice, because that needs a paired test. Do not enter percentages, totals, or averages, enter the individual raw numbers for each person or item. Make sure each number lands in the correct group box. Very small groups, such as only two or three values each, give unreliable results, so gather more if you can. Finally, remember that a significant result shows a difference exists, not that it is large or important, so always check the actual averages as well.
How to use this calculator
- Type or paste all the numbers from your first group into the first box, separating each value with a comma or Enter.
- Do the same for your second group in the second box.
- Let the calculator work out both averages and the p-value automatically.
- Read the p-value: below 0.05 means the two groups probably really differ, while above 0.05 means the difference could just be chance.
Worked example
A cafe owner compares customer spend at two branches. Branch A: 8, 10, 9, 11, 12. Branch B: 6, 7, 8, 5, 9. The averages are 10 and 7. The calculator returns a p-value of about 0.02, which is below 0.05, so the difference is statistically significant, meaning Branch A customers really do tend to spend more.
Frequently asked questions
What do I type in each box?
Put the raw numbers from one group in the first box and the numbers from the other group in the second box. Separate each value with a comma or a new line.
Where do I get these numbers?
They come from whatever you measured, such as test scores, sale amounts, wait times, or ratings. Use the actual value for each person or item, not a summary or average.
What is a p-value?
It is a number between 0 and 1 that shows how likely the difference could be down to chance. The smaller it is, the more likely the difference is real.
What p-value counts as a real difference?
The common guideline is 0.05. Below that, the difference is usually treated as real, or statistically significant. Above it, the evidence is considered weak.
Why is this called the Welch version?
Welch's test does not assume the two groups have the same spread or the same number of values. That makes it a safe and reliable choice for most everyday comparisons.
Get Started with PaperSurvey.io Software
Start your 14-day free trial now, no credit card required.