One-Way ANOVA Calculator
Compare the means of three or more groups. Put each group on its own line, with values separated by commas or spaces.
Learn how to calculate it yourselfEnter your values
Results update as you type.
How to enter your data
Put each group on its own line, and separate the numbers within a group using commas. For example, type the first group's values on line one, press Enter, then type the second group's values on the next line, and repeat for every group you want to compare. Use plain numbers only, with no words, symbols, or currency signs.
F statistic
Check your inputs
Enter valid values to see your result. Use the field hints or open the data guide for help.
A One-Way ANOVA calculator compares the averages of three or more separate groups and tells you whether the differences between them are likely real or just down to chance. You enter the numbers for each group, and it works out a p-value: a small p-value (usually below 0.05) means at least one group is genuinely different from the others. It does not tell you which group stands out, only that a real difference exists somewhere among them.
Calculate it yourself
Example: compare three groups: 1, 2, 3; 3, 4, 5; and 5, 6, 7.
Follow this worked example, then repeat the steps with your own numbers.
Find the group and overall means
Group means = 2, 4, 6; grand mean = (6 + 12 + 18) ÷ 9 = 4Measure variation between groups
SS between = 3 × (2 − 4)² + 3 × (4 − 4)² + 3 × (6 − 4)² = 24Multiply each squared difference from the grand mean by that group’s size.
Measure variation within groups
SS within = (1 + 0 + 1) + (1 + 0 + 1) + (1 + 0 + 1) = 6Within each group, square the distances from its own mean and add them.
Divide by the degrees of freedom and take the ratio
df between = 3 − 1 = 2; df within = 9 − 3 = 6; F = (24 ÷ 2) ÷ (6 ÷ 6) = 12Look up the F probability
p = P(F with 2 and 6 df ≥ 12) = 0.008An F table gives a probability range; a distribution calculation gives the decimal. This supports a difference among the means, but does not identify which pair differs.
This ordinary one-way ANOVA assumes independent observations, approximately normal errors within groups, and similar group variances.
Check your answer in the calculatorBuilt into PaperSurvey.io
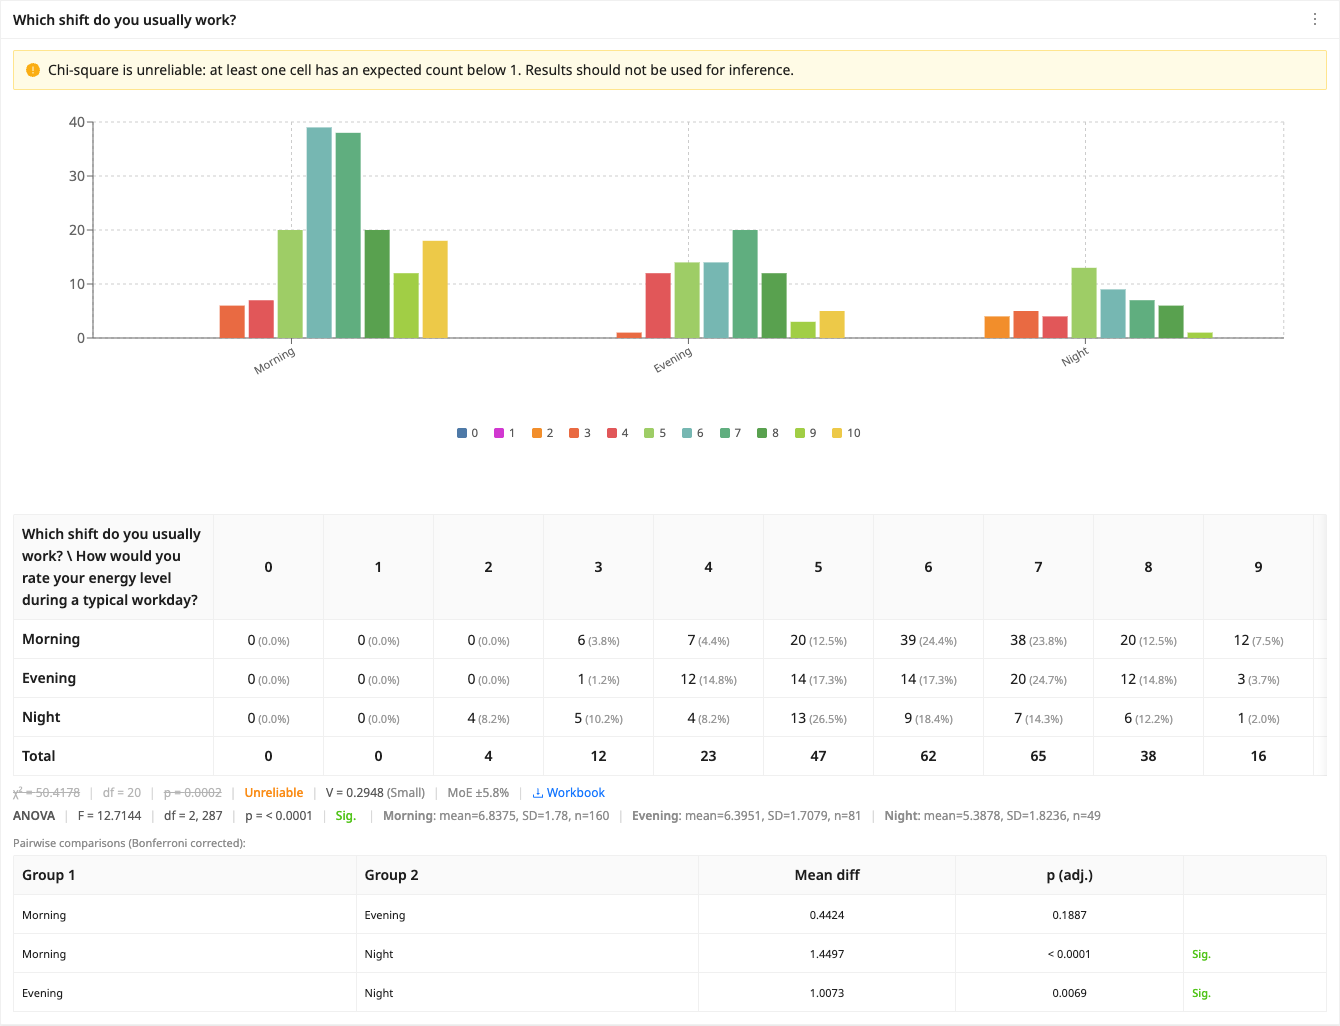
Compare a numeric question across three or more groups to see ANOVA and follow-up pairwise comparisons.
Where it is used
- Teachers: A teacher compares the test scores of three classes that learned the same topic using a different method each, to see if one method really works better.
- Small-business owners: A cafe owner checks whether average daily sales differ across their three shops before deciding where to focus attention.
- HR staff: An HR officer compares average job-satisfaction ratings from four departments to see if any team is clearly happier or unhappier than the rest.
When to use ANOVA
One-way analysis of variance (ANOVA) tests whether the means of three or more independent groups differ. A significant result tells you at least one group is different, but not which one, so follow up with pairwise comparisons.
When should you use it?
Use this when you have three or more groups and you want to compare the average of a number, such as scores, ratings, sales, or times. The groups should be separate sets of people or things, like different classes, shops, or departments. Each value should be a real measurement, not a yes/no answer or a category. If you only have two groups to compare, a t-test is the right tool instead. ANOVA is best when every group is measuring the same thing in the same units.
What does the result mean?
The main number to read is the p-value. It shows how likely you would see differences this large if the groups were really the same. A p-value below 0.05 is the widely accepted cut-off: it means the difference is statistically significant, so at least one group is probably genuinely different. A p-value above 0.05 means the differences could easily be down to chance. The F-value is also shown; a larger F points to bigger differences between groups, but the p-value is the easiest part to act on.
Mistakes to avoid
Do not use this with only two groups; use a t-test for that. Do not assume it tells you which group is different, it only says a difference exists somewhere, so you may need a follow-up test to find the standout group. Do not confuse significant with large or important; a tiny difference can be significant with lots of data. Only enter real numbers, not categories or yes/no answers. Finally, check you have typed each group on its own line so they are not mixed together.
How to use this calculator
- Enter your first group's numbers on the first line, separating each number with a comma.
- Press Enter and add the next group on a new line, using one line per group for all your groups.
- Select calculate to run the test.
- Read the p-value: below 0.05 means at least one group is genuinely different from the others.
Worked example
A shop owner compares customer satisfaction ratings out of 10 from three stores. Store A: 8, 9, 7, 8. Store B: 6, 5, 7, 6. Store C: 9, 8, 9, 10. The calculator returns a p-value of about 0.002, which is well below 0.05, so at least one store's average rating is genuinely different, and here Store C is clearly the highest.
Frequently asked questions
What do I type into the calculator?
Type the numbers for each group, one group per line, with commas between the numbers. For example, one line might read 8, 7, 9, 6. Add a new line for each group you want to compare.
Where do I get these numbers?
They come from whatever you measured, such as test scores, star ratings, sales figures, or times. Each group is one set of results, like one class or one shop.
How many groups do I need?
You need at least three groups for a One-Way ANOVA. If you only have two, use a t-test instead.
What does the p-value mean?
It is the chance of seeing differences this big if the groups were really the same. A p-value below 0.05 usually means at least one group is genuinely different.
Does it tell me which group is different?
No. It only tells you that a real difference exists somewhere among the groups. To find the exact group that stands out, you would run a follow-up test, sometimes called a post-hoc test.
Get Started with PaperSurvey.io Software
Start your 14-day free trial now, no credit card required.