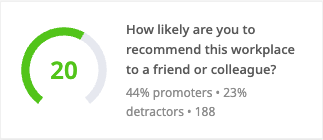
Net Promoter Score answers one question, would people recommend you. Most teams also want to know how satisfied respondents are right now (CSAT), how much effort an interaction took (CES), and what the average star rating works out to. This article walks through all three on real data from the Staff Experience Survey 2027 [Sample] demo, a 200-respondent survey that includes "Rate your overall job satisfaction" on a 1 to 5 rating scale. The survey's dashboard already carries an NPS Score widget showing 20, built from 44% promoters and 23% detractors across 188 answers, so the goal here is to put satisfaction numbers next to it.
Read the star rating on the Results tab
Open the survey and go to Analysis, then the Results tab. A rating question built with From: 1 and To: 5 renders as a bar chart of how many respondents gave each rating, with a side table of counts and percentages:
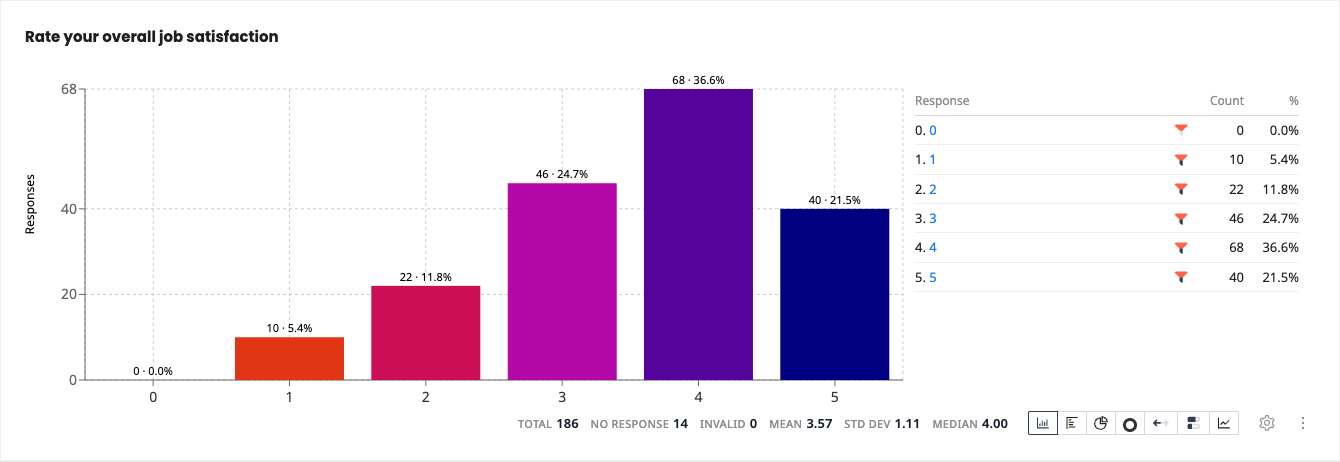
The side table reads 1: 10 (5.4%), 2: 22 (11.8%), 3: 46 (24.7%), 4: 68 (36.6%), 5: 40 (21.5%), and the footer shows TOTAL 186, NO RESPONSE 14, INVALID 0, MEAN 3.57, STD DEV 1.11, MEDIAN 4.00.
That footer Mean is already your star rating. It is the count-weighted average of the scale values:
(1×10 + 2×22 + 3×46 + 4×68 + 5×40) / 186 = 664 / 186 = 3.57
The free Star Rating Calculator computes exactly this from per-star counts, which is handy when your counts come from somewhere else, an app store listing or a review site, or when you want to show the arithmetic to a stakeholder.
Two design notes worth knowing:
- Start the scale at 1, not 0. The Results footer statistics exclude values of 0 or below, so a 0-anchored scale would silently drop its lowest ratings from the mean.
- A single-choice question also works as a star scale if its options carry numeric recode values 1 to 5, because the footer mean weights each option's numeric code by its count.
Turn it into a CSAT percentage
CSAT is a top-box metric: the percentage of responses at or above a satisfaction threshold. PaperSurvey computes it with the CSAT widget:
- Open an analysis view under Analysis and click Edit, then Add.
- Pick CSAT from the Stats category of the block library.
- The widget auto-detects a satisfaction-style question, here it picks "Rate your overall job satisfaction" on its own. You can change it with the Question picker in the inspector.
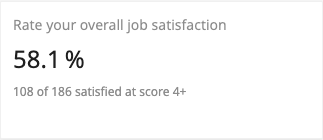
The card shows 58.1%, with the working underneath: 108 of 186 satisfied at score 4+. That is the 68 respondents who answered 4 plus the 40 who answered 5, divided by all 186 answers. The threshold defaults to 4.0 and lives in the inspector's collapsed Advanced panel as Satisfied when score is at least, so you can switch to a stricter 5-only definition and watch the score change.
The CSAT Calculator does the same satisfied-over-total arithmetic on typed-in counts, useful for combining figures from several surveys or checking a number someone else reported.
There is also a shortcut: on the Results tab, a numeric chart's ... actions menu contains an Analyze as group with CSAT Score and CES Score entries that create the pre-configured widget directly. The group appears once the survey has at least one analysis view.
Customer Effort Score
The staff survey does not include an effort question, but the workflow is identical. Add a question like "How easy was it to get help from IT?" on a 1 to 7 scale, then add the Customer Effort Score widget from the same Stats category. It shows the average effort rating with the response count, auto-selects a detected effort question, and the inspector's Effort question picker lets you point it elsewhere. Both the CSAT and CES widgets accept Number, Range, NPS, single-choice and single-choice grid questions, and both follow the filter bar at the top of the view.
The CES Calculator averages pasted ratings the same way, so you can reproduce the widget's number or score a batch of ratings collected outside PaperSurvey. Watch the scale direction: on a 1 = very difficult, 7 = very easy scale a higher average is better, but some published CES scales run the other way, so label your endpoints before you compare against a benchmark.
Churn: what the app computes and what it does not
If you ask a churn-style question in the survey itself, for example "Do you still use the staff canteen?" with Yes and No options, the Results chart's side table gives you each option's count and percentage directly, so the "No" percentage is your churn rate among respondents, and the Total and No response footer figures show how much of the sample that covers.
The accounting definition of churn, customers lost divided by customers at the start of the period, is different. PaperSurvey does not track your customers' accounts or billing, so it never computes that number. Take the counts from your own records and use the Churn Rate Calculator, which returns both the churn and retention percentages.
Trending and slicing
All of these numbers recompute as responses arrive. To compare periods, use the filter bar on the analysis view: the date dropdown offers Uploaded and Printed modes with a date range picker, and the filter list includes Tag, so you can tag each collection wave and read CSAT per wave. Any Results chart can also be saved to a view from its ... actions menu.
Honest caveats
- 186 of 200 respondents answered the satisfaction question, and 14 skipped it. People who skip are rarely a random sample, so treat CSAT from a survey as satisfaction among those who answered.
- The CSAT threshold is a choice. At 4+, this survey scores 58.1%; a 5-only definition would count just the 40 top ratings. Pick one definition and keep it constant across waves.
- Star-rating means compress a whole distribution into one number. The 3.57 here hides that 17.2% of staff answered 1 or 2, so report the chart alongside the average.