Net Promoter Score condenses loyalty into a single number between -100 and +100. Respondents answer one question on a 0 to 10 scale, and each answer lands in a bucket: 9 or 10 makes a promoter, 7 or 8 a passive, and 0 to 6 a detractor. The score is the percentage of promoters minus the percentage of detractors. This article walks through a real example, the Staff Experience Survey 2027 sample survey, where 200 employees were asked "How likely are you to recommend this workplace to a friend or colleague?" and 188 of them answered the NPS question.
Add the NPS question
- Open your survey and go to the Setup tab.
- Add a question and pick Net Promoter Score from the question type list (it sits in the Choice group).
- The scale runs to 10. By default it starts at 0, and you can set From to 1 if you prefer a 1 to 10 scale.
The same question collects answers on printed forms and on the web version of the survey, so scanned paper responses and online submissions feed the same score.
Read the score on the Results tab
Once responses arrive, open Analysis and stay on the Results sub-tab. The NPS question gets its own card with the response distribution across the 0 to 10 scale and a response table with per-value counts.
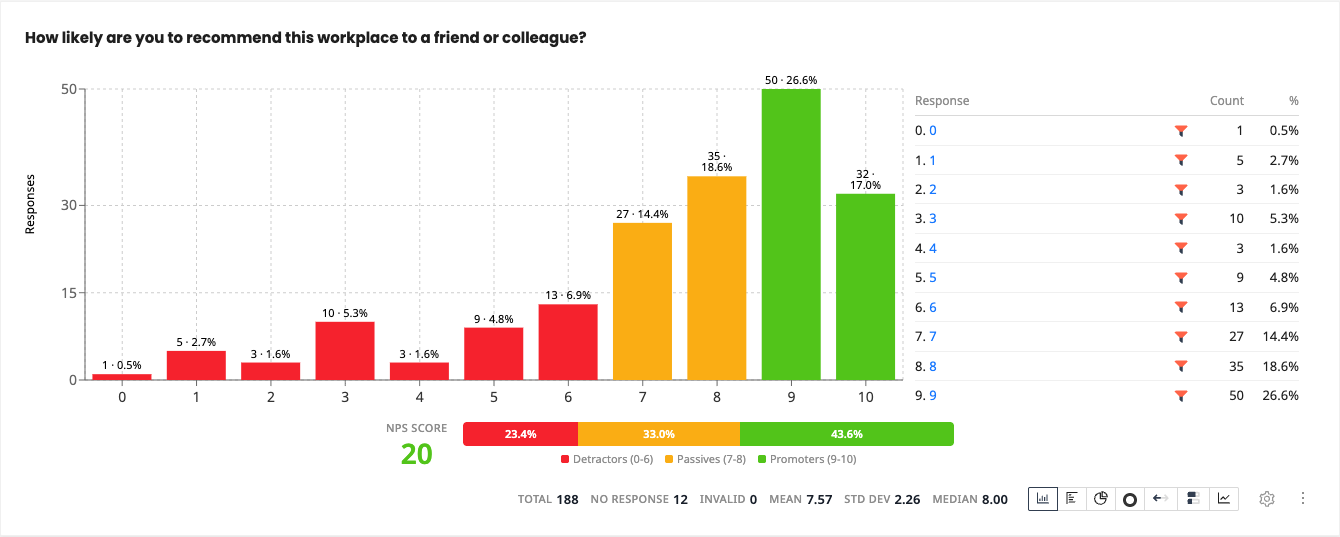
Below the chart, an NPS summary shows the score itself, labelled "NPS Score" and displayed as a plain number without a plus sign. Hovering the score shows the tooltip "Net Promoter Score ranges from -100 to +100. Calculated as % Promoters (9-10) minus % Detractors (0-6)." Next to it, a stacked bar splits the responses into detractors, passives and promoters. Segments show their percentages when wide enough, hovering a segment reveals the exact response count, and a color legend sits below the bar.
Track it on a dashboard
For an always-current view, add the NPS Score widget to an analysis view. Open a view, click Edit, then Add, and pick NPS Score from the Stats category. In the staff survey it renders a gauge showing 20 with the summary line "44% promoters • 23% detractors • 188".
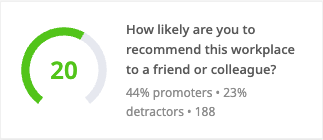
Notice that 44 minus 23 is 21, one point above the gauge. That is not a bug. The widget computes the score from the unrounded promoter and detractor percentages and rounds once at the end, while the summary line rounds each percentage separately for display. Whenever you recompute a score by hand from rounded figures, expect to be off by up to a point.
Two more things worth knowing about the widget:
- It can pool several questions. Select more than one eligible question and it sums their promoter and detractor counts before computing one combined score.
- It also accepts single-choice grid questions with 10 or more scale points. Each grid row's answers are classified by the option's numeric value, 9 or above counts as a promoter and 6 or below as a detractor. Grid rows are not picked automatically, so select the rows you want in the widget's settings.
To trend the score, add the NPS Over Time widget. It charts the score across time with a configurable interval, monthly by default, with daily, weekly, quarterly and yearly options. Both widgets honor the view's date and response filters, so a filtered view of one department shows that department's NPS.
There is also a shortcut straight from the Results tab. Click the "..." icon on the NPS chart (its tooltip reads Actions), open the Analyze as group and choose NPS Score. The pre-configured widget is created in your analysis view immediately. This menu group appears once the survey has at least one analysis view, and the NPS Score entry is only offered on NPS questions. If you have several views, the entry expands so you can pick which view to save into.
Cross-check with the free NPS calculator
The free NPS Calculator uses the identical formula: percentage of promoters minus percentage of detractors, with passives counted in the total only. You will not normally need it for data collected in PaperSurvey, since the app computes the score for you, but it is handy when some of your counts live outside the app. If last year's survey ran in another tool, enter its promoter, passive and detractor counts into the calculator and compare the result against this year's widget on equal terms. Because the calculator also computes from raw counts and rounds once, it agrees with the app's score for the same data.
Look past the single number
A score of 20 says promoters outnumber detractors, but not how the answers are spread. To see the distribution behind the score, add a Descriptive Statistics widget (in the Advanced stats category of the same Add drawer) pointed at the NPS question.
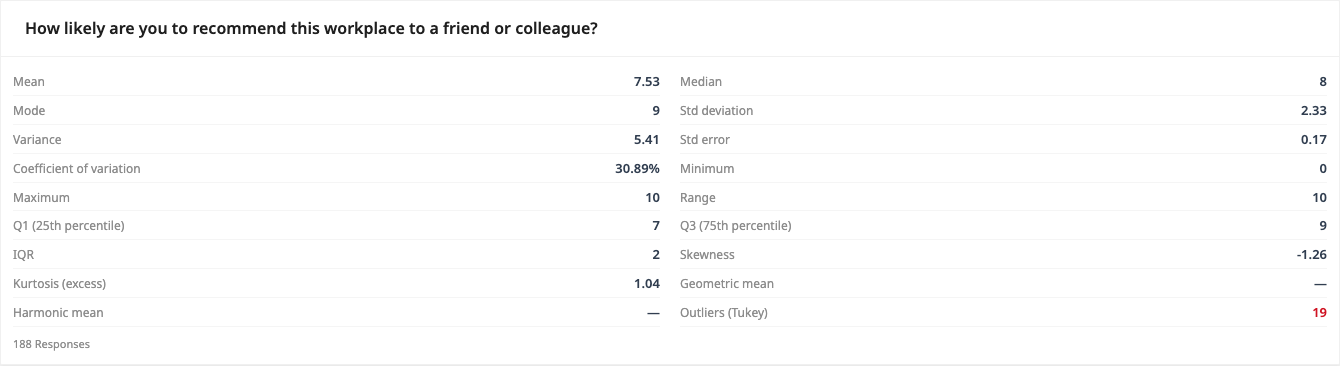
For the staff survey the widget reports a mean of 7.53, a median of 8 and a mode of 9 across the 188 responses, with skewness of -1.26 and 19 Tukey outliers highlighted in red. The picture is a strongly left-skewed distribution: most staff cluster at 8 and 9, while a small tail of very low scores pulls the mean down and fills the detractor bucket. That is exactly the pattern NPS is designed to expose. An average of 7.53 out of 10 sounds comfortable, yet the score of 20 is only moderate because every answer of 6 or below counts fully against you.
Slice the score by group
NPS questions are eligible on the Compare Responses sub-tab, so you can cross-tabulate the NPS question against department, office or salary band and let the app run a chi-square test on each pairing. The page notes that these comparisons are exploratory, which is the right way to treat them: use a significant pairing as a prompt to investigate, not as proof on its own. For ongoing segment tracking, duplicate your analysis view and apply a response filter per segment, since the NPS widgets respect those filters.
Next steps
- CSAT, Customer Effort Score and Star Ratings covers the satisfaction metrics that complement NPS.
- Chi-Square, Cramér's V and P-Values explains the significance tests behind Compare Responses.
- Creating an Analysis Dashboard shows how to build the view that hosts your NPS widgets.
- The NPS Calculator computes a score from any promoter, passive and detractor counts.