CES Calculator (Customer Effort Score)
Calculate your average Customer Effort Score. Paste the individual effort ratings, separated by commas or new lines.
Learn how to calculate it yourselfEnter your values
Results update as you type.
How to enter your data
Type or paste the rating each person gave into the single "Effort ratings" box, one number per respondent. Separate the numbers with commas or put each on its own line (spaces and tabs also work), for example: 5, 6, 4, 7, 3, 6. You do not type an average yourself; the calculator works it out from the individual ratings.
Average effort score
Check your inputs
Enter valid values to see your result. Use the field hints or open the data guide for help.
The CES Calculator works out your Customer Effort Score, a number that shows how easy or hard it felt for people to get something done with you, such as solving a problem or placing an order. You give it the effort rating each customer chose, usually on a 1 to 7 scale, and it adds them all up and shows you the average. That single average tells you, at a glance, how much effort your customers felt they had to put in.
Calculate it yourself
Example: four customers give effort ratings of 2, 3, 4 and 3 on the same scale.
Follow this worked example, then repeat the steps with your own numbers.
Add the ratings
Total rating points = 2 + 3 + 4 + 3 = 12Count the responses
n = 1 + 1 + 1 + 1 = 4Divide points by responses
CES = 12 ÷ 4 = 3.00The average stays in the units of the original rating scale.
Check the wording of your scale before interpreting the result: a high score can mean more effort or greater ease, depending on the question.
Check your answer in the calculatorUse your PaperSurvey.io results
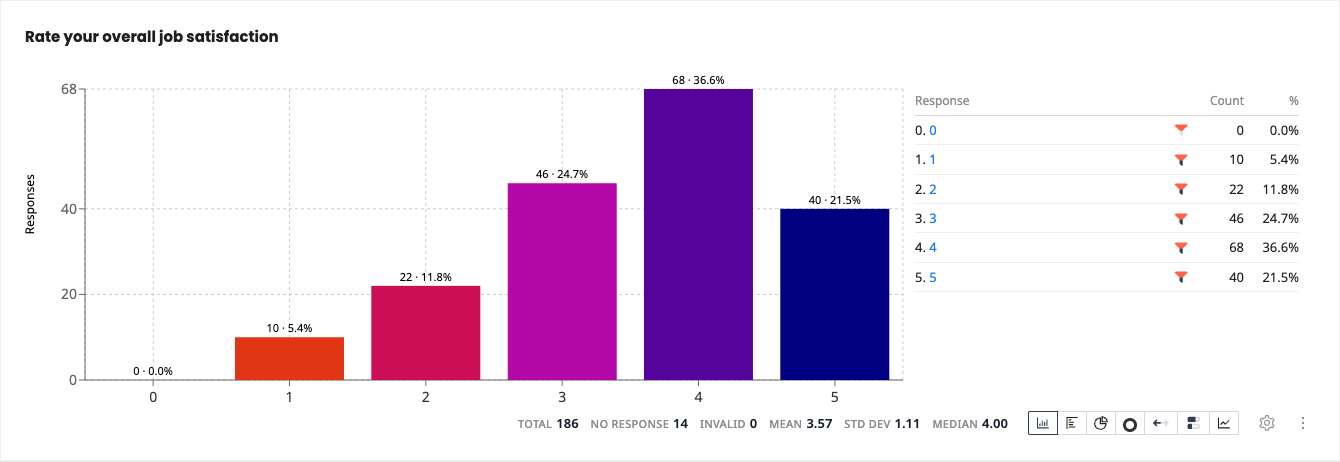
Collect an effort rating and select it in the Customer Effort Score widget to report its average and response count.
Where it is used
- Customer-service team leaders: After each support ticket is closed, they ask how easy it was to get the issue solved and average the replies to see if getting help feels smooth.
- Small-business owners: An online shop owner averages the effort ratings left after checkout to check whether buying from the site feels easy or fiddly.
- Product and website managers: A manager collects effort ratings after people sign up for an app and averages them to find where the process feels like hard work.
What is CES?
The Customer Effort Score measures how easy it was for a customer to get something done. It is the average of the effort ratings, typically collected on a 1–7 scale. Lower effort is better.
When should you use it?
Use this calculator when you have asked customers how much effort something took, and you want one clear number that sums up their answers. It fits any moment where a person has just finished a task with you, such as getting help, buying a product, returning an item, or signing up. Collect a rating from each person, usually on a 1 to 7 scale, then paste those ratings here. It turns a long list of separate scores into a single average you can watch over time.
What does the result mean?
The result is the average of all the ratings you entered, shown to two decimal places, along with how many responses it used. What counts as good depends on how you asked the question. On the common 1 to 7 version that asks whether it was easy to deal with you, a higher average is better, and a score around 5 or above is usually seen as good. If your question asked how much effort it took, a lower average is better. There is no single official benchmark, so compare your score to your own past results.
Mistakes to avoid
The biggest mistake is forgetting which way your scale runs. If your question asked about ease, a high average is good; if it asked about effort, a low average is good, so always read the number with the question wording in mind. Do not mix ratings from different scales, such as 1 to 5 and 1 to 7, in one batch, because the average becomes meaningless. Paste only the effort ratings, not other numbers like order values or dates. And avoid judging a score from just a handful of replies; gather enough responses first.
How to use this calculator
- Collect an effort rating from each customer, usually on a 1 to 7 scale.
- Type or paste all the ratings into the "Effort ratings" box, separated by commas or new lines.
- The calculator instantly shows the average effort score and how many responses it used.
- Read the average against your question wording: higher is better for "easy" questions, lower is better for "effort" questions.
Worked example
Say ten customers rate how easy it was to get help on a 1 to 7 scale and give these answers: 6, 7, 5, 6, 4, 7, 6, 5, 6, 7. Paste them in with commas, and the calculator adds them to 59 and divides by 10, giving an average effort score of 5.90 out of 7, which points to a fairly easy experience.
Frequently asked questions
What do I type in the box?
Type the effort rating each person gave, one number per respondent. Separate them with commas or new lines, like 5, 6, 4, 7.
Where do I get these numbers?
They come from a survey question such as "How easy was it to get your issue solved?" Each person picks a number, usually from 1 to 7, and those picks are what you paste in.
What scale should I use?
Most people use a 1 to 7 scale, where 7 means it was very easy. A 1 to 5 scale is also fine, as long as every rating you paste uses the same scale.
What is a good score?
On the 1 to 7 "it was easy" version, higher is better, and roughly 5 or above is usually considered good. There is no single official benchmark, so watch whether your own score rises over time.
Is a high number always better?
No, it depends on the question. If you asked how easy it was, a high number is good. If you asked how much effort it took, a low number is the good result.
Get Started with PaperSurvey.io Software
Start your 14-day free trial now, no credit card required.