Standardized assessment tools work differently from a quiz. There are no right or wrong answers: every option is valid, but each carries a different number of points, and the total maps to a category that means something (Minimal, Moderate, Severe). PaperSurvey scores these scales automatically. You assign a point value to each answer, the app sums an instrument total for every respondent as their sheet is scanned or their web form is submitted, and it labels that total with the severity band you defined. This article walks through the PHQ-9 depression screen, a nine item scale scored 0 to 27, and shows how the same setup applies to any scored questionnaire.
Points scoring versus right or wrong grading
PaperSurvey has two scoring modes, and you choose one per question in the Answer Key:
- Right / wrong answers is classic quiz grading. You tick the correct options and give the question a single weight in points. Covered in Grading Paper Tests Automatically.
- Points per answer is for scales. Every option gets its own point value (often 0, 1, 2, 3), there is no correct answer, and a respondent's score is the value of the option they picked. This article is about this mode.
Both modes need grading switched on for the survey, and both can live in the same survey.
The scenario: PHQ-9
The PHQ-9 asks how often, over the last two weeks, a person was bothered by nine problems. Each item is answered on the same four point frequency scale: Not at all (0), Several days (1), More than half the days (2), Nearly every day (3). The nine item scores add up to a total from 0 to 27, and that total maps to a severity band:
| Total score | Severity |
|---|---|
| 0 to 4 | Minimal |
| 5 to 9 | Mild |
| 10 to 14 | Moderate |
| 15 to 19 | Moderately severe |
| 20 to 27 | Severe |
Because all nine items share one scale, the natural way to build this is a single-choice grid: the nine items are the rows, and the four frequencies are the columns.
Step 1: Turn on grading
- Open your survey, go to Settings, and choose Grading in the side navigation.
- Switch on Activate test grading.
- Leave the Pass threshold empty. A pass or fail line is a quiz idea; a scale uses severity bands instead, which you set up next.
Step 2: Switch the Answer Key to Points per answer
Answer keys live on the Setup tab. For a grid, open the tools menu on the grid question itself and choose Answer Key. At the top of the modal there is a mode toggle:
- Select Points per answer.
- The correct and incorrect sections are replaced by a Points field next to each column. Enter 0, 1, 2 and 3 for Not at all, Several days, More than half the days and Nearly every day.
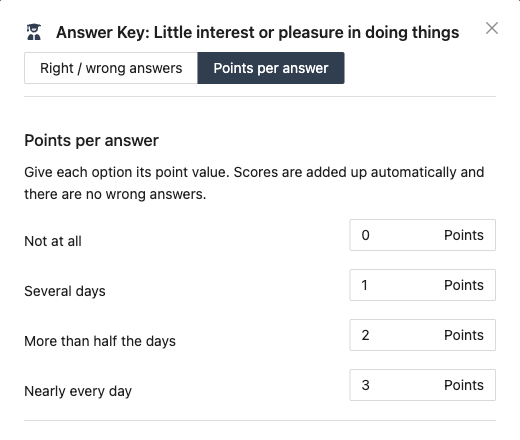
The column points are shared by every row of the grid, so you set them once, on the grid. The rows have no answer key of their own in this mode, because there is nothing per row to set. Points can be any whole number, including negative values if a scale needs them.
Step 3: Define the severity bands
Bands belong to whatever produces the total. For a grid, that is the grid itself, and the same Answer Key modal has a Score bands section below the points. (For a tool built from several separate questions, the bands live on the section that groups them, see Several questions, one tool.) Add one row per band:
- Min and Max are the inclusive ends of the range. A total of exactly 4 falls in a 0 to 4 band, and a total of 5 falls in a 5 to 9 band.
- Leave Max blank on the top band (or Min blank on the bottom band) for an open ended range, for example 20 and above.
- Label is the text shown for that range, such as Moderate.
- Color tints the band in charts.
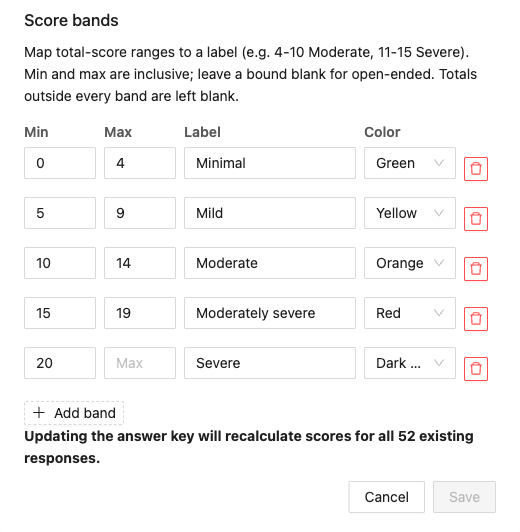
For the PHQ-9 you add five bands: 0 to 4 Minimal, 5 to 9 Mild, 10 to 14 Moderate, 15 to 19 Moderately severe, 20 and above Severe. Bands may leave gaps; a total that falls in no band is simply left unlabeled. Click Save, and the modal reminds you that scores for all existing responses will be recalculated.
What every respondent gets
As each sheet is scanned and processed, or each web form submitted, the instrument total is computed as the sum of the item point values. On the Responses tab the Total Score column shows that sum. There is no pass or fail column unless you set a pass threshold; the meaning of the score comes from its band, which you see in analysis and exports.
See the results: the Scale Score widget
Open Analysis, edit the view, and add the Scale Score widget from the Quiz category. In its settings, pick the instrument under Scale, grid or scored question. The widget shows:
- A histogram of respondent totals, with each bar colored by the band it falls in.
- The mean, median, high, low and standard deviation of the totals, and the count of respondents.
- A legend listing each band, its range, and how many respondents landed in it.
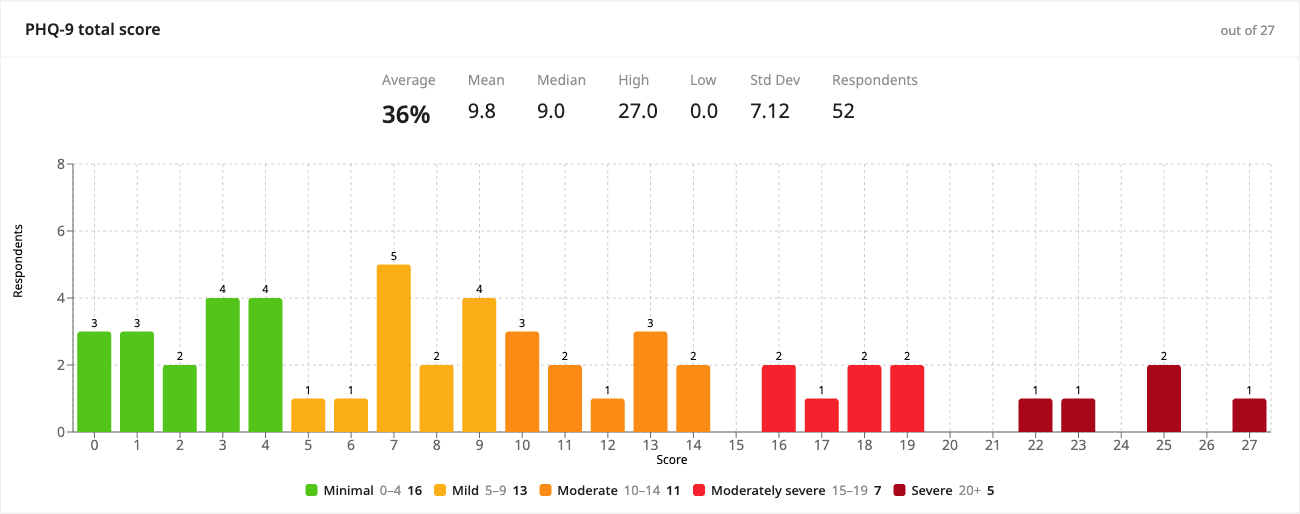
This is the headline view of a screening program: at a glance you see how many people scored in the Moderate or Severe range.
Several questions, one tool
A standardized tool is often several separate questions rather than one grid, either because the items do not share an answer scale or simply because that is how the form was built. To score those questions as one instrument, group them into a section and score the section:
- On the Setup tab, select the questions that belong to the tool and choose Group into section.
- Open the section's tools menu, choose Additional settings, and switch on Score this section as one scale.
- Add the severity bands underneath, exactly as described above.
The section adds up the scores of every scored question inside it into one total and labels that total with your bands. Sections are invisible on the printed page and on the web form, so grouping questions this way changes nothing about how the survey looks. Each question inside still needs its own points, set in its own Answer Key.
A section cannot span a page break, so a tool that is split across printed pages has to stay in one section per page or be built as a grid instead.
Which questions get banded
A band always applies to one instrument's total, so how you build the instrument decides what gets banded. There are three ways to make one.
A section scored as one scale. Any run of scored questions grouped into a section, banded on the section. Use this when the items are separate questions.
A single-choice grid. When several items share one answer scale, like the nine PHQ-9 items, a grid with the items as rows and the scale as columns is the tidiest structure: one set of column points, one total, bands on the grid. This is how the PHQ-9 and GAD-7 templates are built.
A single scored question. A standalone single-choice or multiple-choice question is a one item instrument: its total is the value of the option picked. Points go on its options; to band it, put it in a section of its own and score that section.
Why not band the whole survey? Because one form often carries more than one instrument. An intake form can include both a PHQ-9 and a GAD-7, each needing its own total (0 to 27 versus 0 to 21) and its own bands, next to unscored questions such as demographics that should not count. Banding per instrument keeps them separate and correct. Individual grid rows are likewise never banded on their own; only the instrument total is.
Two more notes:
- Reverse-scored items. If an instrument scores some items in reverse (3 down to 0 instead of 0 up to 3), keep those items in a separate grid whose columns are valued in reverse. A single grid uses one shared set of column points for all its rows.
- A grid inside a scored section counts once, through its rows, so a section can mix a grid and separate questions without double counting.
What respondents see after submitting
On a web survey you decide how much of the score to show. In Settings, under Grading, After submitting, respondents see offers three options:
- Their total score, the whole-survey total out of what the survey can award. This is the default and what every graded survey showed before.
- Their total score, plus each scale with its band, which adds one line per instrument, for example PHQ-9: 14 / 27, Moderately severe.
- Nothing, which shows the thank-you message alone.
Severity bands classify a person, so show them only when respondents are meant to see the classification.
Exports and integrations
Every scored respondent carries their band into your data, not just into the app:
- File exports. On the Responses tab, Export includes the whole-survey Total Score column and, for every scored instrument, a <instrument name> score column with that instrument's own total and a <instrument name> band column with the label, for example Moderate. This applies to Excel, CSV, SPSS, R, SAS and Stata.
- Google Sheets. A connected sheet gets the same score and band columns automatically, next to Total Score. If you have customized which columns your sheet shows, the band column is added alongside the score column and is also available to add or hide in the column picker.
- Webhooks and API. The entry payload includes a scale_bands array, one entry per scored instrument, each with the instrument's question id, name, summed score, and band label. A downstream system can route a Severe result straight into a follow-up workflow.
- Zapier. Each scored instrument appears as a flat band_<id> field you can map into any Zap.
A total that falls in no band exports as an empty cell.
Start from a template
The PHQ-9 and GAD-7 templates in the gallery come preconfigured: the grid already has points 0 to 3 on the columns, the official severity bands, grading switched on, and a Scale Score report in the analysis view. Duplicate one of them and you have a working scored scale in a couple of clicks, ready to print, scan, and read as severity bands.
Next steps
- Grading Paper Tests Automatically for right or wrong quiz scoring, weighted points and pass rates.
- Analyzing Likert Scale Data for response distributions across a battery of items.
- Creating an Analysis Dashboard to arrange the Scale Score widget alongside other charts.
- Exporting Survey Data for the full list of export formats.