NPS Calculator (Net Promoter Score)
Calculate your Net Promoter Score. Enter the number of promoters (9–10), passives (7–8) and detractors (0–6).
Learn how to calculate it yourselfEnter your values
Results update as you type.
How to enter your data
Type or paste each person's rating, a whole number from 0 to 10, and press comma or Enter after each one. You can paste a whole column of scores straight from a spreadsheet in one go. Enter one score per customer, so if 40 people answered, you enter 40 numbers.
Net Promoter Score
- % Promoters
- 60%
- % Passives
- 25%
- % Detractors
- 15%
The NPS Calculator works out your Net Promoter Score, a single number that shows how likely your customers are to recommend you. You collect answers to one question, "How likely are you to recommend us, on a scale from 0 to 10?", and the calculator turns all those ratings into one score between -100 and +100. A higher number means you have more happy customers who would recommend you than unhappy ones who would not.
Calculate it yourself
Example: you have 12 promoters (ratings 9–10), 5 passives (7–8), and 3 detractors (0–6).
Follow this worked example, then repeat the steps with your own numbers.
Count all responses
Total = 12 + 5 + 3 = 20Passives count toward the total even though they do not directly add to or subtract from NPS.
Find the promoter percentage
Promoters = 12 ÷ 20 × 100 = 60%Find the detractor percentage
Detractors = 3 ÷ 20 × 100 = 15%Subtract detractors from promoters
NPS = 60 − 15 = +45Report NPS as a score from −100 to +100, without a percent sign.
Built into PaperSurvey.io
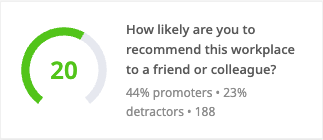
Add an NPS Score widget to calculate your score directly from collected survey responses.
Where it is used
- Small-business owners: A cafe owner asks 60 regulars to rate 0 to 10 how likely they are to recommend the cafe, then checks the score to see if word of mouth is helping.
- Customer-service teams: A support manager pastes the 0 to 10 ratings from last month's help-desk surveys to see whether people leave happy or frustrated.
- Hotel and event managers: An event organiser enters the recommend scores from a post-event feedback form to compare this year's score with last year's.
How NPS is calculated
Net Promoter Score = % promoters − % detractors. Passives are counted in the total but do not add to the score. The result ranges from −100 (everyone is a detractor) to +100 (everyone is a promoter).
What is a good NPS?
Any score above 0 means you have more promoters than detractors. Above +30 is generally good, above +50 is excellent, though benchmarks vary widely by industry.
When should you use it?
Use this calculator after you have asked people one question: how likely they are to recommend you, on a scale from 0 to 10. It is built for that question only, so it is not the right tool for star ratings, yes or no answers, or general satisfaction scores. Reach for it when you want a simple, single number that sums up how your customers feel. It is most useful when you measure the same thing regularly, for example every month or after each event, so you can see whether things are getting better or worse over time.
What does the result mean?
The result is one number between -100 and +100. Behind the scenes, people who answer 9 or 10 are counted as "promoters" (fans), 7 or 8 as "passives" (neutral), and 0 to 6 as "detractors" (unhappy). The score is the share of promoters minus the share of detractors. Any score above 0 means you have more fans than critics. As a rough guide, above 20 is seen as good, above 50 is excellent, and above 70 is outstanding. A score below 0 means more unhappy customers than happy ones.
Mistakes to avoid
Do not type in percentages or an average; enter each person's actual 0 to 10 rating, one number per customer. Remember that 7 and 8 do not add to your score at all, so lots of "okay" answers can still leave you near zero. Try not to read too much into a score from only a handful of replies, because a few answers can swing it wildly, and more responses give a steadier result. Finally, always compare like with like, using the same question and the same 0 to 10 scale each time you measure.
How to use this calculator
- Gather each customer's answer to the 0 to 10 "how likely to recommend" question.
- Type or paste every rating into the box, pressing comma or Enter after each number.
- Check that the count of numbers matches the number of people who replied.
- Read the score, from -100 to +100: higher is better, and above 0 means more fans than critics.
Worked example
Say 10 people rated you: four gave a 9 or 10, three gave a 7 or 8, and three gave a 6 or lower. That is 40 percent promoters and 30 percent detractors. The calculator subtracts 30 from 40 and shows an NPS of +10, meaning you have slightly more fans than critics.
Frequently asked questions
How do I classify responses?
On a 0–10 recommendation scale: 9–10 are promoters, 7–8 are passives and 0–6 are detractors.
What number do I type in for each person?
Type the rating that person gave to the "how likely are you to recommend us" question, from 0 to 10. Enter one number for each customer who answered.
Where do I get these numbers?
From a survey where you asked people to rate, from 0 to 10, how likely they are to recommend you. If you scanned paper forms or ran a web survey in PaperSurvey, you can copy that column of scores straight in.
What is a good NPS score?
Any score above 0 means you have more fans than critics. As a rough guide, above 20 is good, above 50 is excellent, and above 70 is outstanding. What counts as good can vary from one industry to another.
Why are scores of 7 and 8 ignored?
They count as "passives", people who are neither fans nor critics. They are still part of the total, but they do not add to or take away from your score. Only ratings of 9 to 10 and 0 to 6 move the number.
Can the score be negative?
Yes. If more people gave low scores (0 to 6) than high scores (9 or 10), the result will be below 0. That is a clear sign to look into why customers are unhappy.
Get Started with PaperSurvey.io Software
Start your 14-day free trial now, no credit card required.