Most survey questions are more interesting together than alone. Knowing the average energy rating and the average work-life balance rating tells you little on its own; knowing that the two move together tells you where to intervene. This article walks one real dataset, the Employee Wellbeing Study sample survey (300 respondents), through both tools PaperSurvey offers: the Correlation widget for Pearson and Spearman coefficients, and the regression line on Compare Responses. Along the way it maps each number to the free Correlation Calculator, Spearman Correlation Calculator and Linear Regression Calculator.
The scenario
The study asked two 1-10 rating questions: "How would you rate your energy level during a typical workday?" and "How satisfied are you with your work-life balance?". The HR team suspects the two are linked. Correlation puts a single number on how strongly they move together, and regression fits a line that predicts one from the other. Neither proves that one causes the other, and the Compare Responses page carries an on-page note reminding you the results are exploratory. A strong link is a reason to investigate, not a verdict.
Add the Correlation widget
The Statistical Deep-Dive view, which PaperSurvey builds automatically, already places correlation blocks pairing your headline metric with likely driver questions. To add one anywhere:
- Open your survey, go to Analysis and open a view (or click + New View).
- Click Add to open the Add blocks drawer. This also switches the page into editor mode.
- Under Advanced stats, pick Correlation ("Pearson and Spearman correlation between two numeric questions.").
- In the inspector, choose the two questions under First variable and Second variable. Until both are set, the card says "Click Edit, select this block, and choose two numeric questions."
Eligible questions are Number, Range, NPS, single-choice and single-choice grid rows (grid rows are offered individually). Choice questions correlate on each option's numeric recode value, the code you can edit per option, so make sure ordered options carry meaningful codes. Multiple-choice questions are not supported.

For work-life balance vs energy level the card shows Pearson r 0.685, R² 0.469 and Spearman ρ 0.679, with the footer n = 278, Pearson p < 0.001, Spearman p < 0.001.
Reading the three numbers
- Pearson r 0.685 is a fairly strong positive linear relationship. People who report more energy also report better work-life balance. On a -1 to 1 scale, survey questions rarely exceed 0.7, so this is a headline finding.
- R² 0.469 is r squared: about 47% of the variation in one answer is shared with the other. The remaining half is everything else, from workload to commute.
- Spearman ρ 0.679 is the rank-based coefficient. It only assumes the relationship is consistently upward or downward, which makes it the safer choice for ordinal rating scales, skewed data or outliers. When Pearson and Spearman land this close together, the relationship is close to linear and either coefficient tells the same story.
Both p-values below 0.001 mean a link this strong is extremely unlikely to appear by chance in 278 respondents.
The pairing happens per respondent automatically: only people who answered both questions are used, which is why n is 278 rather than 300. The widget needs at least three such respondents, otherwise it shows "Needs at least three respondents who answered both questions."
Fit a line on Compare Responses
Correlation says the two move together. Regression puts a slope on it. The Compare Responses tab inside Analysis runs a linear regression whenever the crossed pair are both numeric scales:
- Open Analysis, then the Compare Responses tab.
- In How do responses differ based on: pick the energy level question as the basis.
- Switch the toggle in the top right from Simple to Advanced. The statistics line only appears in Advanced mode.
- Find the card titled "How satisfied are you with your work-life balance?". Because both questions are rating scales, the footer shows a regression instead of a group test.
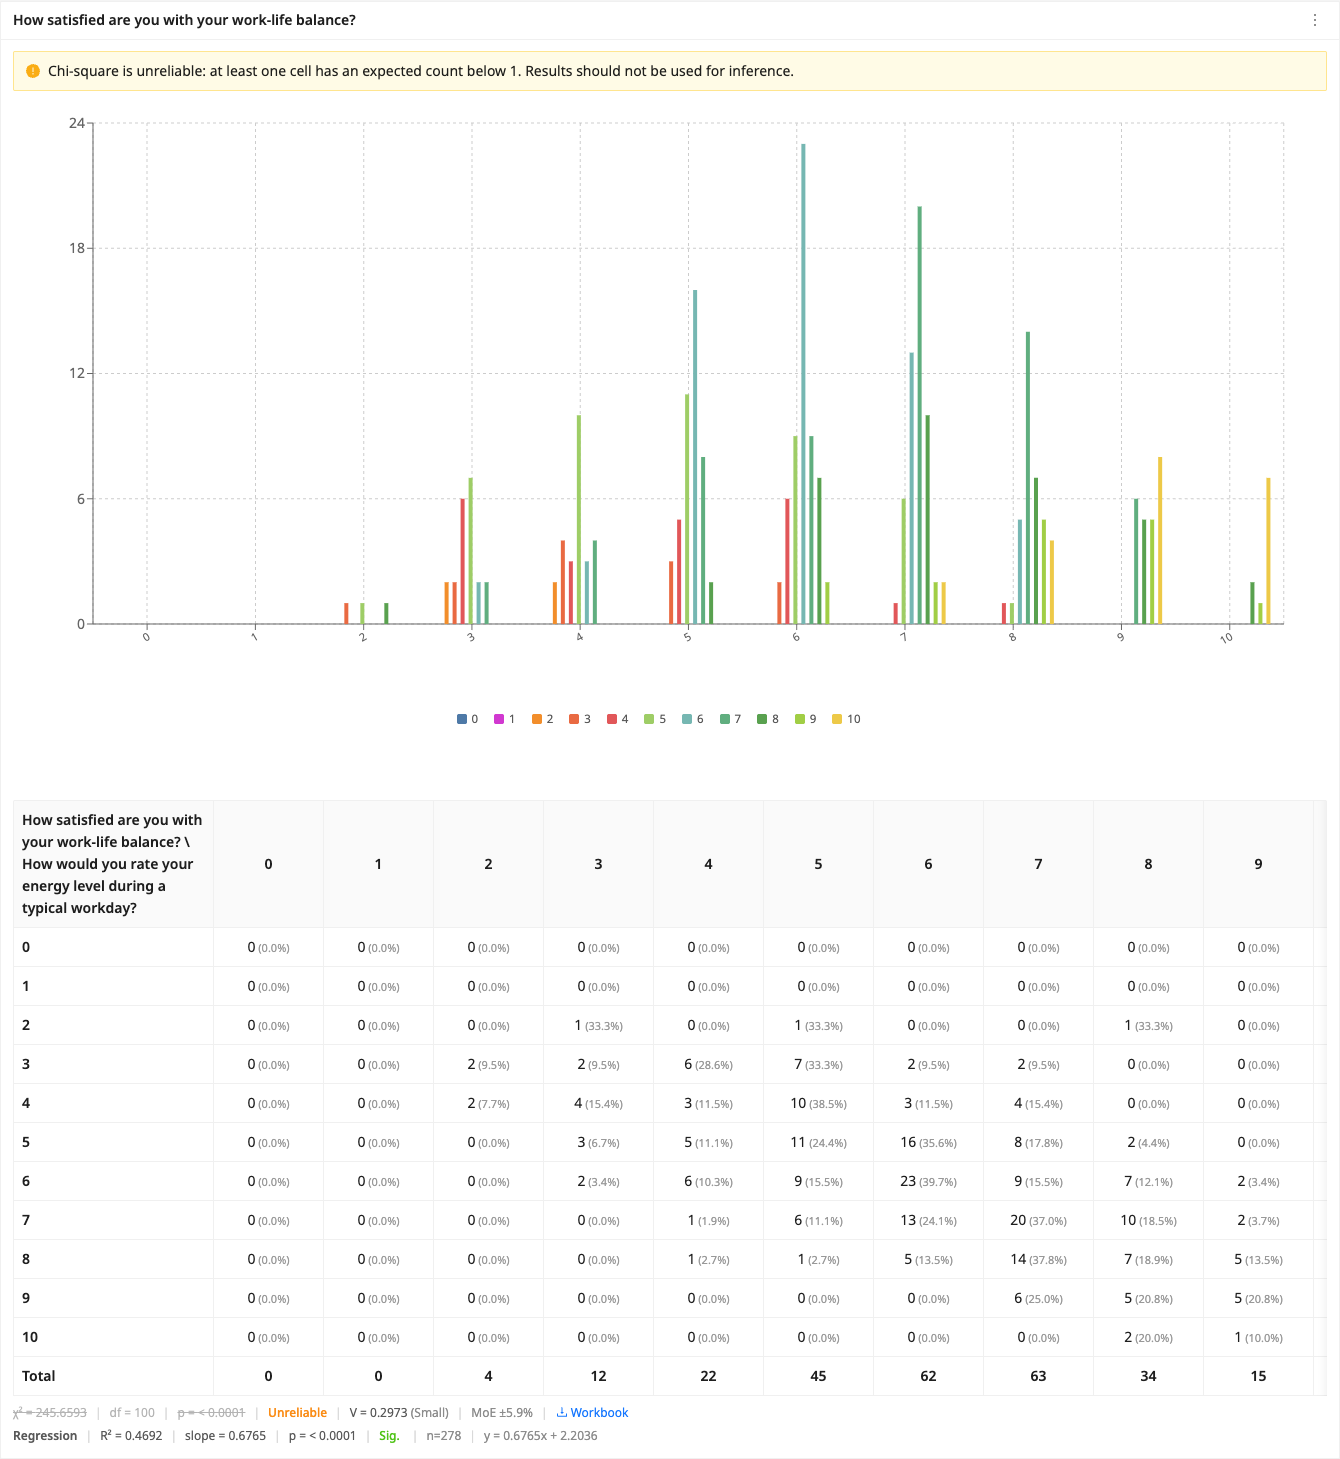
The footer reads: Regression | R² = 0.4692 | slope = 0.6765 | p = < 0.0001 | Sig. | n=278 | y = 0.6765x + 2.2036.
Note that the basis question here must be close-ended or a rating/NPS scale. Plain Number questions cannot be selected on Compare Responses even though they work in the Correlation widget, and single-choice grid rows are treated as ordered positions 1 to k on this page rather than their recode values.
Interpreting slope, intercept and R²
The equation y = 0.6765x + 2.2036 predicts work-life balance from energy. Each extra energy point is worth about 0.68 balance points on average. The intercept 2.2036 is the predicted balance at energy 0, which sits outside the 1-10 scale, so treat it as the line's anchor rather than a real prediction. Hovering the Regression label shows this interpretation spelled out in plain language.
The R² of 0.4692 matches the Correlation widget's 0.469, as it must: for a single predictor, regression R² is simply Pearson r squared (0.685² = 0.469). The p-value comes from an F-test on R² and the Sig. tag confirms the slope is statistically distinguishable from zero.
One thing this page does not compute is Spearman's ρ. The numeric-vs-numeric path on Compare Responses is Pearson-style linear regression only; for the rank-based view of the same pair, use the Correlation widget or the Spearman Correlation Calculator.
Cross-checking with the free calculators
The public calculators run the same formulas on pasted X/Y pairs, which is handy for a subset you filtered by hand or data from outside PaperSurvey:
- The Correlation Calculator returns r, R² and n. It does not report a p-value, which the in-app widget adds.
- The Linear Regression Calculator returns slope, intercept, R² and the same F-test p-value, so its output matches the Compare Responses footer digit for digit.
When you need more than a straight line
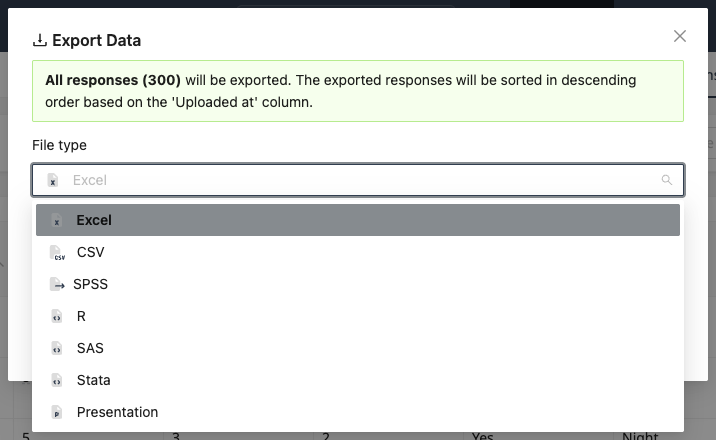
Multiple regression with several predictors, partial correlations, confidence intervals around r, or diagnostics like residual plots are jobs for a stats package. The workflow is collect with PaperSurvey, then export: open the Responses tab, click Export, and choose Excel, CSV, SPSS, R, SAS, Stata or Presentation. The SPSS .sav file carries numeric codes with value labels, and the R export bundles the data with a ready-made import script, so both questions arrive analysis-ready for lm() or SPSS's regression menus.
Next steps
- Descriptive statistics for survey data to understand each variable before correlating them
- Filtering data in analysis to run the same correlation for one department or time period
- Exporting survey data for the Excel, SPSS and R workflow in detail
- Linear Regression Calculator to try the slope and intercept math on your own pairs