Linear Regression Calculator
Fit a straight line to your data. Paste paired X and Y values to get the regression equation and R².
Learn how to calculate it yourselfEnter your values
Results update as you type.
How to enter your data
This calculator uses two boxes: one for your input values (the possible cause) and one for your result values (the outcome). Type each number separated by a comma or a new line, and keep both lists in the same order so each pair lines up. Put the same amount of numbers in both boxes.
R² (fit)
Check your inputs
Enter valid values to see your result. Use the field hints or open the data guide for help.
The Linear Regression Calculator looks at two sets of numbers that are linked, like hours studied and test scores, and finds the straight line that best fits them. It tells you how one number tends to change when the other goes up, how strong that link is, and lets you predict one value from the other. In short, it turns a scatter of data points into a simple trend you can read and use.
Calculate it yourself
Example: fit a line to the pairs (1, 2), (2, 4) and (3, 3).
Follow this worked example, then repeat the steps with your own numbers.
Find the means and centred sums
Mean X = 2; mean Y = 3; Sxx = (−1)² + 0² + 1² = 2; Sxy = (−1 × −1) + (0 × 1) + (1 × 0) = 1Sxx sums squared X deviations from its mean; Sxy sums the products of paired X and Y deviations.
Calculate the slope
Slope b = Sxy ÷ Sxx = 1 ÷ 2 = 0.5Calculate the intercept and equation
Intercept a = mean Y − b × mean X = 3 − 0.5 × 2 = 2; predicted Y = 2 + 0.5XCalculate the proportion of variation explained
Syy = (−1)² + 1² + 0² = 2; R² = Sxy² ÷ (Sxx × Syy) = 1 ÷ 4 = 0.25Check the fitted line’s test statistic
F = R² × (n − 2) ÷ (1 − R²) = 0.25 × 1 ÷ 0.75 ≈ 0.3333The upper-tail F probability with 1 and 1 degrees of freedom is about 0.6667, found using a table or numerical evaluation.
The p-value assumes independent, approximately normal errors with constant variance. Avoid extending the fitted line far beyond the observed X values.
Check your answer in the calculatorBuilt into PaperSurvey.io
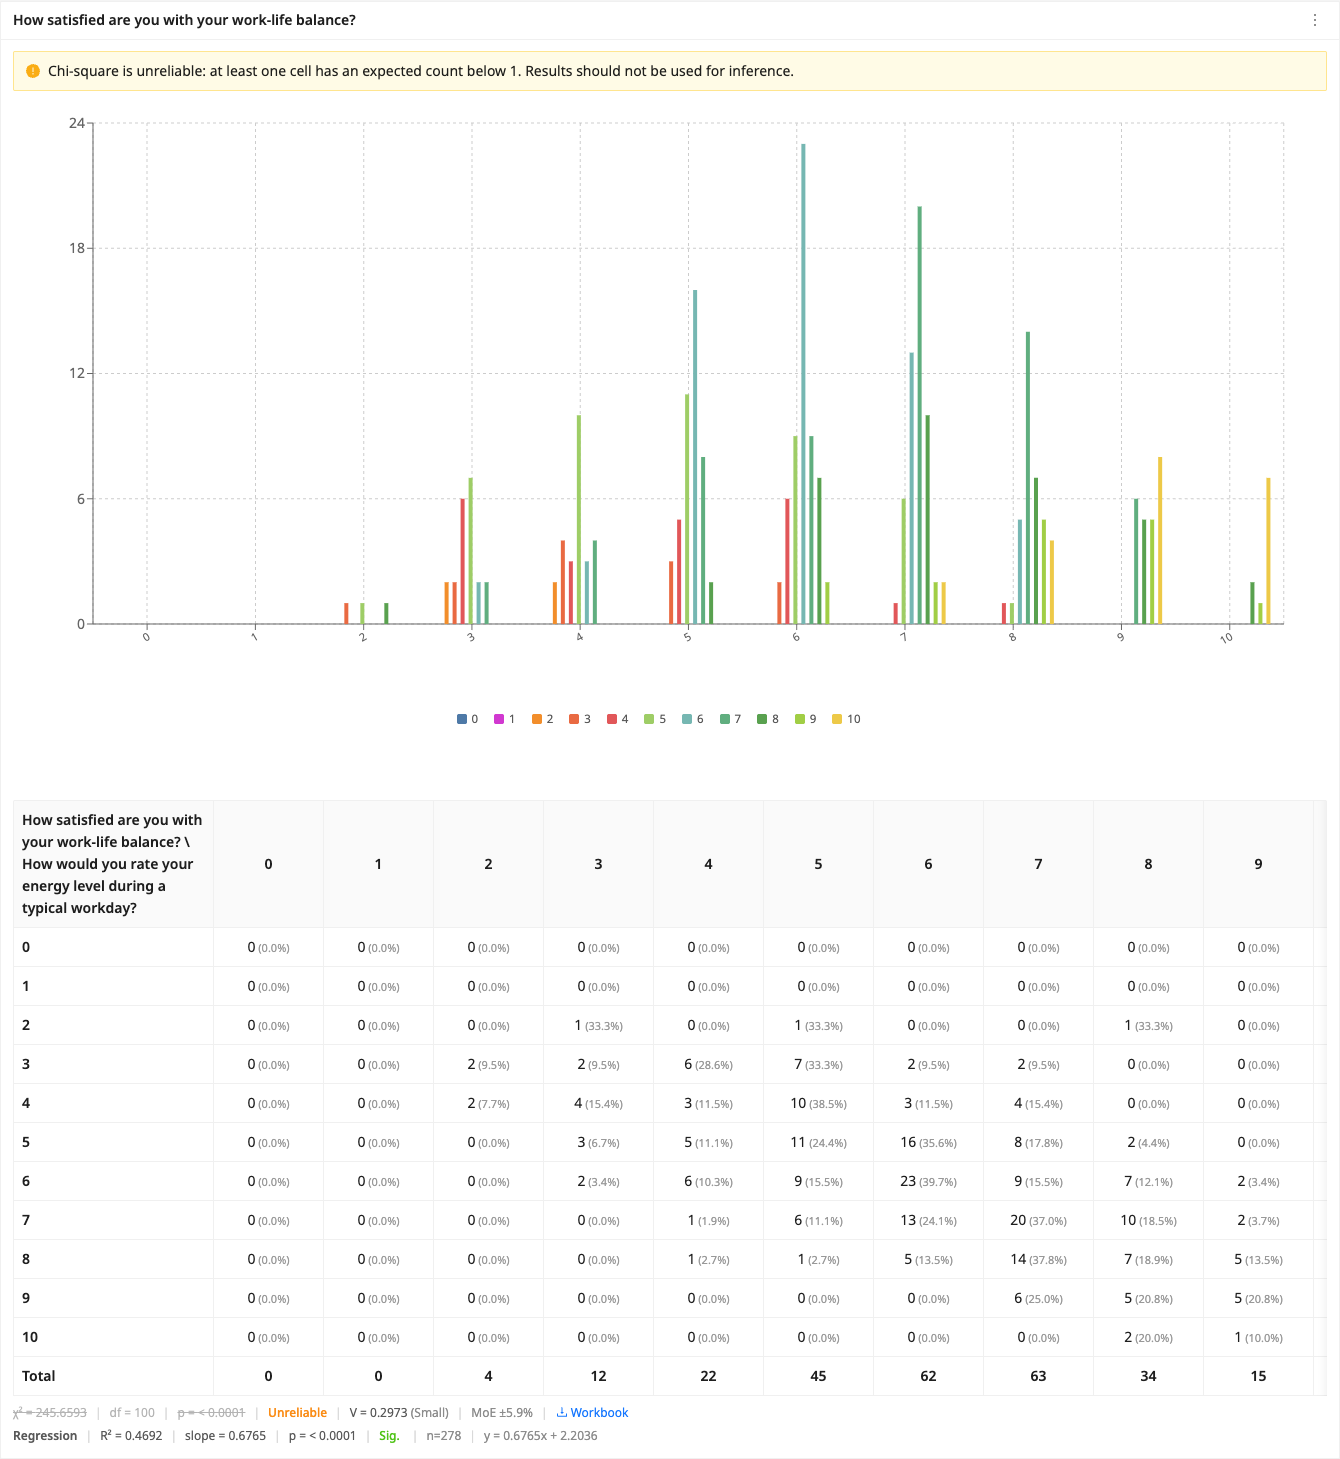
Compare two numeric scales in Advanced mode to read the fitted equation, R² and regression p-value.
Where it is used
- Teachers: A teacher checks whether the hours each student spent studying line up with their exam scores.
- Small-business owners: A shop owner sees whether spending more on advertising each month is linked to higher sales.
- Event organisers: An organiser checks whether the ticket price for past events is linked to how many people showed up.
What regression gives you
Simple linear regression finds the best-fit straight line predicting Y from X. The slope is how much Y changes per unit of X, and R² is the share of variation in Y explained by X, from 0 to 1.
When should you use it?
Use it when you have two numbers recorded for each person, product, or day, and you want to know if they move together. One number is the thing you think has an effect, like hours studied or money spent on ads. The other is the result you care about, like a test score or sales total. The calculator draws the best straight line through your points, shows how strong the link is, and lets you estimate the result for a new input value you have not measured yet.
What does the result mean?
You get a slope, a starting value, and usually a number called R-squared. The slope tells you how much the result goes up or down each time the input rises by one. The starting value is where the line begins when the input is zero. R-squared runs from 0 to 1 and shows how well the line fits your points: closer to 1 means the points sit tightly along the line. As a rough guide, above 0.7 is a strong fit and below 0.3 is weak.
Mistakes to avoid
A close fit does not prove that one thing causes the other; something else may be behind both. Make sure your two lists stay in the same order so each pair belongs together, and enter the same amount of numbers in each box. Use several points, not just two or three, or the line means very little. This tool only fits straight lines, so it can miss curved patterns. Finally, avoid predicting far outside the range of numbers you entered, because the line may not hold there.
How to use this calculator
- Enter your input numbers (the possible cause) in the first box, each separated by a comma or a new line.
- Enter your result numbers (the outcome) in the second box, in the same order so each pair matches.
- Check that both boxes have the same amount of numbers, then run the calculation.
- Read the slope and starting value to see the relationship, and use R-squared to judge how well the line fits.
Worked example
Say a teacher records hours studied and test scores for five students: 1, 2, 3, 4, and 5 hours, with scores of 52, 58, 63, 71, and 74. The calculator gives a line of about: score = 46.5 + 5.7 times hours. That means each extra hour of study is linked to about 5.7 more points, and the fit is very strong (R-squared about 0.99). For 6 hours of study, it would predict a score of roughly 81.
Frequently asked questions
What do I type in each box?
Put your input numbers, the possible cause, in one box and your result numbers, the outcome, in the other. Separate each number with a comma or a new line, and keep both lists in the same order.
Where do I get these numbers?
They come from your own records, such as a spreadsheet, a survey, or a sales report. Each row should have two measurements taken for the same person, day, or item.
What does the slope tell me?
It shows how much the result changes each time the input goes up by one. A slope of 5 means the result rises by about 5 for every one-unit increase in the input.
What is a good R-squared value?
R-squared goes from 0 to 1, and closer to 1 means the line fits better. As a rough guide, above 0.7 is a strong fit and below 0.3 is weak.
Does a strong result prove one thing causes the other?
No. It only shows that the two numbers tend to move together. Something else could be driving both, so treat the link as a useful clue, not as proof.
Get Started with PaperSurvey.io Software
Start your 14-day free trial now, no credit card required.