Chi-Square Test Calculator
Test whether two categorical variables are related. Paste your contingency table with one row per line and counts separated by spaces or commas.
Learn how to calculate it yourselfEnter your values
Results update as you type.
How to enter your data
Enter your numbers as a table of counts, where each count is how many people or items fall into one combination. Put each row group on its own line, and separate the counts in that row with commas. For example, one line for "Men" with coffee and tea counts (40, 60), and a second line for "Women" (70, 30). Use plain whole numbers, not percentages.
Chi-square statistic
Check your inputs
Enter valid values to see your result. Use the field hints or open the data guide for help.
A Chi-Square Test of Independence checks whether two things you have sorted people or items into are connected, or just happen to line up by chance. For example, it can tell you if gender and drink choice are linked, or if that pattern is probably random. You give it a table of counts, and it gives back a p-value that tells you how likely the link is real.
Calculate it yourself
Example: a two-by-two count table has first row 12, 8 and second row 8, 12.
Follow this worked example, then repeat the steps with your own numbers.
Find the row, column and grand totals
Each row totals 20; each column totals 20; N = 40Calculate the expected counts
Expected = row total × column total ÷ N = 20 × 20 ÷ 40 = 10 in every cellAdd each cell’s chi-square contribution
χ² = (12 − 10)² ÷ 10 + (8 − 10)² ÷ 10 + (8 − 10)² ÷ 10 + (12 − 10)² ÷ 10 = 1.6Find the degrees of freedom
df = (rows − 1) × (columns − 1) = (2 − 1) × (2 − 1) = 1Look up the upper-tail probability
P(χ² with 1 df ≥ 1.6) ≈ 0.2059Use a chi-square table to bracket the probability, or numerical evaluation for this decimal value. It is above 0.05.
Use counts from independent observations. Small expected counts can make the chi-square approximation unreliable; for a small two-by-two table, consider Fisher’s exact test.
Check your answer in the calculatorBuilt into PaperSurvey.io
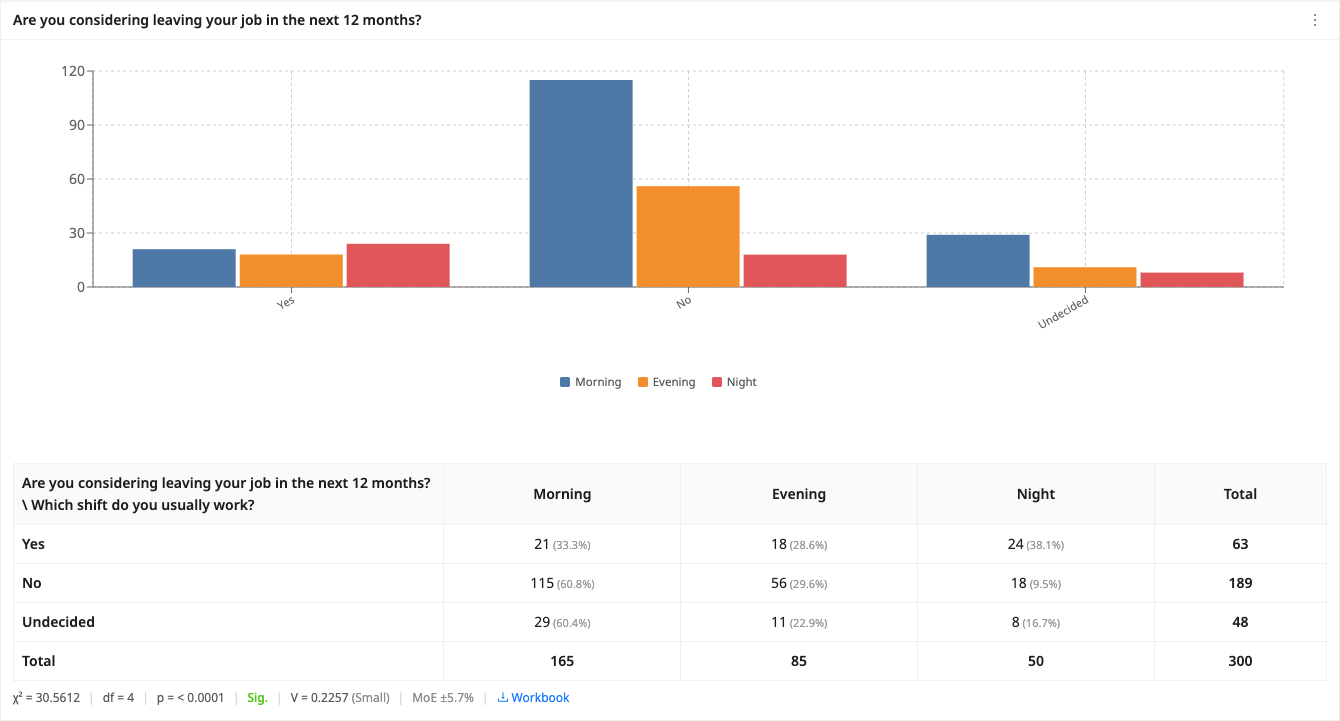
Compare categorical survey questions to see their cross-tab, chi-square statistic and significance test together.
Where it is used
- Small-business owners: A cafe owner checks whether men and women differ in choosing coffee versus tea, using counts from a quick customer survey.
- Teachers: A teacher tests whether students who attended extra revision sessions were more likely to pass or fail than those who did not.
- HR staff: An HR officer looks at whether staff in different departments differ in whether they said yes or no to a new flexible-hours policy.
What the chi-square test does
The chi-square test of independence checks whether two categorical variables (for example gender and product preference) are associated. A small p-value (below 0.05) means the variables are very likely related. Cramér’s V measures how strong that association is.
When should you use it?
Use this test when you have two questions that each sort people into named groups, and you want to know if the two are related. Both questions must be categories, not measurements. Good examples are gender (man or woman) against choice (coffee or tea), or department (sales or support) against answer (yes or no). You need the actual head counts for each combination, such as how many women chose tea. It does not work with averages, scores, or numbers like age or income.
What does the result mean?
The main answer is the p-value, a number between 0 and 1. It tells you how likely you would see a pattern this strong purely by chance if the two things were truly unrelated. A small p-value means the link is probably real. The widely used cut-off is 0.05: if the p-value is below 0.05, people usually call the relationship statistically significant, meaning it is unlikely to be luck. A p-value above 0.05 means you do not have strong evidence of a real link. The chi-square number itself just measures how far your counts sit from what pure chance would produce, and bigger means a stronger signal.
Mistakes to avoid
Do not type in percentages or averages. This test needs raw whole-number counts of people or items. Make sure each person is counted only once, in one box. Be careful with very small groups: if the expected number in any box is below about five, the result can be unreliable, so try to collect more responses. Also remember this test only tells you whether two things are linked, not which one causes the other, and not how big or useful the link is.
How to use this calculator
- Sort your responses into two categories and count how many people fall into each combination.
- Enter the counts as a table: put each row group on its own line, with the counts separated by commas.
- Double-check that every count is a whole number and that each person is counted only once.
- Read the p-value: if it is below 0.05, the two categories are likely related; if it is above 0.05, there is no strong evidence of a link.
Worked example
Suppose a cafe owner surveys 200 customers. Among 100 men, 40 chose coffee and 60 chose tea. Among 100 women, 70 chose coffee and 30 chose tea. Entered as two rows (40, 60 on one line and 70, 30 on the next), the calculator returns a chi-square value of about 18.2 and a p-value well below 0.001. Because that p-value is far below 0.05, the result shows that drink choice really does differ between men and women, and is very unlikely to be chance.
Frequently asked questions
How do I enter my data?
Put each category on its own line and separate the group counts with commas or spaces. For example, a 2×2 table is two lines of two numbers.
What numbers do I type into each box?
Type the count of how many people or items fall into each combination of your two categories. For example, the number of women who chose tea. Always use whole numbers, never percentages.
Where do I get these numbers?
Count them from your survey answers, sign-up sheet, spreadsheet, or sales records. Group your responses by the two things you are comparing, then count how many fall into each combination.
What is a p-value in plain words?
It is the chance of seeing a pattern this strong if the two things were actually unrelated. A low p-value suggests the link is real, not just luck.
What p-value counts as a real result?
The common rule is that a p-value below 0.05 means the relationship is statistically significant. Above 0.05 means you do not have strong evidence of a link.
Does a significant result mean one thing causes the other?
No. The test only shows that two things tend to go together. It cannot prove that one causes the other, since something else could be behind the pattern.
Get Started with PaperSurvey.io Software
Start your 14-day free trial now, no credit card required.