P-Value Calculator
Turn a test statistic into a p-value. Choose the distribution, enter the statistic and its degrees of freedom.
Learn how to calculate it yourselfEnter your values
Results update as you type.
How to enter your data
Enter your survey counts as a small table: put each group on its own line, and separate the counts within a line with commas. For example, one line for women and one line for men, each showing the number who said yes and the number who said no. Use whole counts of people only, not percentages or averages.
p-value
two-tailed
- Significant at 0.05?
- Yes
The P-Value Calculator checks whether a difference in your survey results is real or just down to chance. You enter your counts and it gives you a p-value, a number between 0 and 1. A small p-value (commonly under 0.05) means the difference is unlikely to be random luck, so you can be more confident it is genuine; a large one means the gap could easily have happened by chance.
Calculate it yourself
Example: convert a z statistic of 2 into a two-sided p-value.
Follow this worked example, then repeat the steps with your own numbers.
Look up the cumulative normal probability
Φ(2) ≈ 0.97725In a standard normal table, find the probability to the left of z = 2. Φ is the cumulative distribution function.
Find the upper tail
P(Z ≥ 2) = 1 − 0.97725 = 0.02275Include the equally extreme negative tail
Two-sided p = 2 × 0.02275 = 0.04550This counts both Z ≥ 2 and Z ≤ −2. The result is below a preselected 0.05 threshold.
For t, use the t distribution with the stated degrees of freedom and double one tail. Chi-square and F use only the upper tail; do not double it. Distribution tables give rounded values, while the calculator evaluates them numerically. A p-value is not the probability that the null hypothesis is true.
Check your answer in the calculatorBuilt into PaperSurvey.io
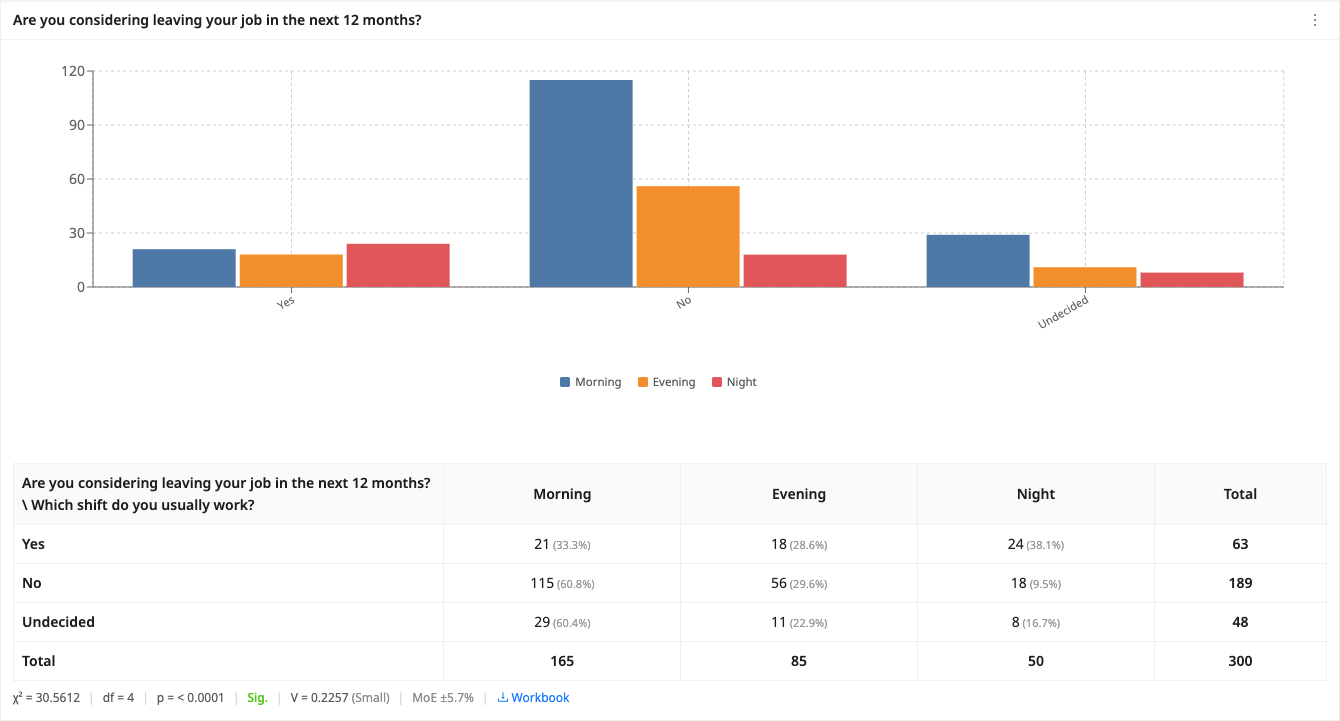
Read the p-value for a survey comparison together with its test, effect size and underlying counts.
Where it is used
- Teachers: A teacher checks whether boys and girls in a class really answered a feedback question differently, or whether the gap is just chance.
- Small-business owners: A shop owner sees if more repeat customers than new customers rate the service 'excellent', or if it only looks that way.
- HR staff: An HR officer tests whether staff in two departments gave genuinely different answers about job satisfaction.
What a p-value means
The p-value is the probability of seeing a result at least as extreme as yours if there were really no effect. A p-value below 0.05 is the usual threshold for calling a result statistically significant.
When should you use it?
Use it when you have counts from two or more groups and want to know if a difference between them is real or could just be random. For example, more women than men ticked 'yes', or one branch scored higher than another. It works with counts of people who chose each answer, not opinions or averages. If you only have one group with nothing to compare it to, or you just want percentages, this tool is not the one you need.
What does the result mean?
The result is a p-value, a number from 0 to 1. It tells you how likely you would see a difference this big if there were really no difference at all. A small p-value means the result is unlikely to be chance, so the difference is probably real. A large p-value means the gap could easily be random. The most widely used cut-off is 0.05: below it, results are usually called 'statistically significant'. Above 0.05, treat the difference as unproven.
Mistakes to avoid
Do not type percentages or averages; enter the actual head counts of people. Do not read a small p-value as proof the difference is large or important; it only says the difference is probably not chance. With very few responses, even a real difference can be missed, so gather enough answers first. Do not keep re-testing until you drop below 0.05, as that creates false alarms. And a p-value above 0.05 does not prove the groups are the same, it just means no difference has been shown.
How to use this calculator
- Enter your first group on the first line, typing its counts separated by commas (for example 40, 10).
- Add each other group on its own new line, keeping the answers in the same order.
- Check that every number is a whole count of people, not a percentage or average.
- Read the p-value: below 0.05 usually means a real difference, above 0.05 means it could be chance.
Worked example
Say 45 of 50 women and 30 of 50 men ticked 'satisfied'. You enter two lines: 45, 5 and 30, 20. The calculator returns a p-value of about 0.001, far below 0.05, so the difference between women and men is very unlikely to be down to chance.
Frequently asked questions
What number do I type in each box?
Type the count of people, the actual number who gave each answer. For example, if 40 women said yes and 10 said no, that line is 40, 10.
Where do I get these numbers?
Count them from your survey results. PaperSurvey can total them for you automatically once your paper or web surveys have been scanned in.
What is a p-value in plain words?
It is the chance that the difference you see is just random luck. The smaller it is, the more likely the difference is real.
What p-value counts as good?
There is no single 'good' value, but the common rule is that anything below 0.05 is treated as a real, 'statistically significant' difference.
Can I use percentages instead of counts?
No. The calculator needs whole counts of people. Percentages hide how many answers you had, and the number of responses changes the result.
Get Started with PaperSurvey.io Software
Start your 14-day free trial now, no credit card required.