Skewness and Kurtosis Calculator
Measure the shape of your distribution. Paste your data to get sample skewness and excess kurtosis.
Learn how to calculate it yourselfEnter your values
Results update as you type.
How to enter your data
Type or paste your numbers into the single input box, separating each value with a comma, a space, or a new line (for example: 4, 5, 3, 5, 2). Enter one number for every item you measured, and include only numbers, with no words or blank entries.
Skewness
Check your inputs
Enter valid values to see your result. Use the field hints or open the data guide for help.
The Skewness and Kurtosis Calculator looks at a list of numbers and describes their shape. Skewness tells you whether the numbers lean to one side, and kurtosis tells you how often unusually high or low values show up compared with a normal bell curve. Together they help you see whether your data is balanced or distorted before you rely on its average.
Calculate it yourself
Use 1, 2, 3 and 4 to calculate adjusted sample skewness and sample excess kurtosis.
Follow this worked example, then repeat the steps with your own numbers.
Standardize each observation
n = 4; mean = 2.5; s = √(5/3). For each value, z = (value − 2.5) ÷ s.s is the sample standard deviation. Keep its full precision for the following steps.
Add the cubes and fourth powers
Σz³ = 0; Σz⁴ = 3.69.The symbol Σ means add the expression for every observation. The cubes cancel because these values are symmetric.
Apply the sample skewness adjustment
Skewness = n × Σz³ ÷ [(n − 1)(n − 2)] = 4 × 0 ÷ 6 = 0.Apply the excess-kurtosis adjustment
Excess kurtosis = [n(n + 1) × Σz⁴ ÷ ((n − 1)(n − 2)(n − 3))] − [3(n − 1)² ÷ ((n − 2)(n − 3))] = 12.3 − 13.5 = −1.2.
These are the adjusted sample formulas, matching Excel SKEW and KURT. Skewness needs at least three observations; kurtosis needs four, and neither is defined when every value is identical.
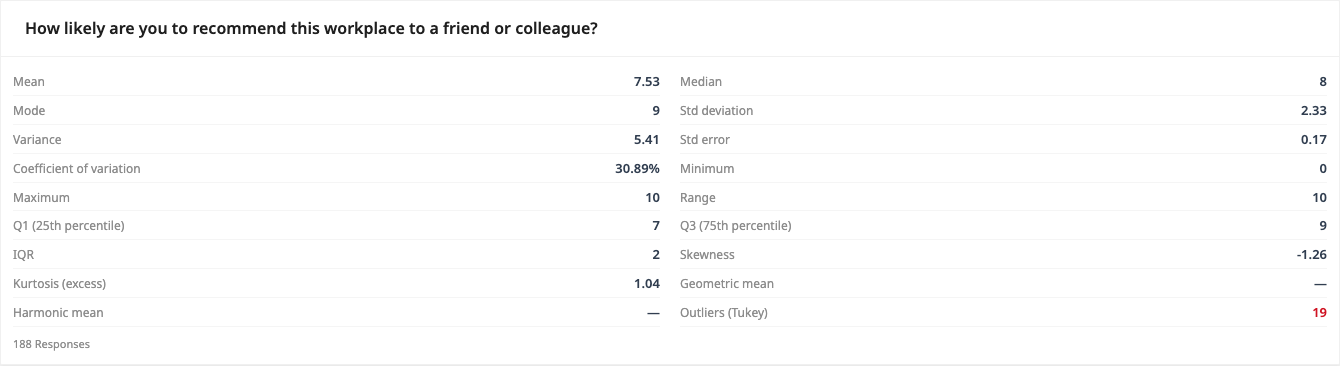
Check your answer in the calculatorBuilt into PaperSurvey.io
Use the skewness and kurtosis rows to look beyond the average when reviewing numeric survey answers.
Where it is used
- Teachers: A teacher enters the exam scores for a class to see whether most students clustered near the top or a few low marks are dragging the class average down.
- Customer-service managers: A support manager pastes in call-waiting times to check whether a handful of very long waits are distorting the picture of how quick the team usually is.
- Market researchers: A researcher checks the shape of survey ratings to see whether opinions are evenly spread or bunched at one end before reporting the results.
Reading skewness and kurtosis
Skewness measures asymmetry: positive means a longer right tail, negative a longer left tail. Excess kurtosis measures tailedness relative to a normal distribution: positive means heavier tails and more outliers.
When should you use it?
Use this calculator when you have a set of numbers and want to understand their shape, not just their average. It helps when you are checking survey ratings, test scores, prices, waiting times, or any list of measurements. Skewness tells you if the numbers lean to one side. Kurtosis tells you whether you have a lot of unusually high or low values. This is useful before you trust an average, because a few extreme numbers can quietly pull that average off to one side without you noticing.
What does the result mean?
You get two numbers. Skewness shows lopsidedness: near zero means the numbers are fairly balanced, a positive value means a tail of high numbers on the right, and a negative value means a tail of low numbers on the left. A common guide treats skewness between -0.5 and 0.5 as fairly symmetric, and beyond -1 or 1 as strongly one-sided. Kurtosis shows how often extreme values appear. Many tools report it so that zero equals a normal bell curve, a higher number means more outliers, and a lower number means fewer.
Mistakes to avoid
Do not use too few numbers. With only a handful of values, skewness and kurtosis jump around and mean very little, so aim for at least a few dozen. Only enter numbers, not words or category labels like yes or no, because those cannot be measured on a scale. Watch for typos, because one number typed with an extra zero can swing the whole result. Remember these two figures describe shape only. They do not tell you whether a result is good or bad, just how the values are spread out.
How to use this calculator
- Type or paste your numbers into the box, separating each one with a comma, a space, or a new line.
- Check that you have entered only numbers, with no blank spaces or text entries.
- Press the calculate button.
- Read the two results: skewness for lopsidedness and kurtosis for how often extreme values appear.
Worked example
Say a coffee shop records how long ten customers waited, in minutes: 2, 2, 3, 3, 3, 4, 4, 4, 5, 12. Most waits are short, but one twelve-minute wait stretches out to the right. The calculator returns a positive skewness of roughly 2, showing the numbers are strongly lopsided toward high values, mainly because of that single long wait.
Frequently asked questions
What do I type into the calculator?
Enter your list of numbers, separating each one with a comma, a space, or a new line. You only need the numbers, one value for each thing you measured.
Where do I get these numbers?
They come from your own records, such as survey ratings, test marks, sales figures, or timings. In PaperSurvey you can pull them straight from the answers you have collected.
What does skewness mean in plain words?
It tells you if your numbers lean to one side. A tail of high numbers gives a positive value, a tail of low numbers gives a negative value, and near zero means the numbers are balanced.
What does kurtosis mean in plain words?
It tells you how often very high or very low values appear. A higher number means more extreme outliers than a normal bell curve would have.
What counts as a good value?
There is no good or bad, only shape. As a rough guide, skewness between -1 and 1 is considered fairly normal, and kurtosis near zero looks like a standard bell curve.
Get Started with PaperSurvey.io Software
Start your 14-day free trial now, no credit card required.