Outlier Calculator
Detect outliers using the interquartile range (Tukey) method. Paste your data below.
Learn how to calculate it yourselfEnter your values
Results update as you type.
How to enter your data
Type or paste your numbers into the box, separating each one with a comma, a space, or a new line. You can also copy a column of figures straight from a spreadsheet and paste it in. Use plain numbers only, with no currency signs, units, or words mixed in.
Outliers found
Check your inputs
Enter valid values to see your result. Use the field hints or open the data guide for help.
The Outlier Calculator finds numbers in your list that stand out as unusually high or low compared to the rest. It uses the IQR method, which looks at the middle half of your numbers to work out a normal range, then flags any value that falls well outside it. This helps you spot data points that might be typos, one-off events, or genuinely unusual results worth a second look.
Calculate it yourself
Check the sorted values 1, 2, 3, 4 and 100 using the 1.5 × IQR rule.
Follow this worked example, then repeat the steps with your own numbers.
Find the first and third quartiles
Q1 = 2; Q3 = 4.Use positions (n − 1) × 0.25 and (n − 1) × 0.75 in the sorted list, starting at position zero. Interpolate when a position is fractional.
Calculate the interquartile range
IQR = Q3 − Q1 = 4 − 2 = 2.Calculate the fences
Lower fence = 2 − (1.5 × 2) = −1. Upper fence = 4 + (1.5 × 2) = 7.Identify values outside the fences
100 > 7, so 100 is the only flagged outlier.A value exactly on a fence is not flagged. An outlier flag is a reason to investigate, not an instruction to delete the observation.
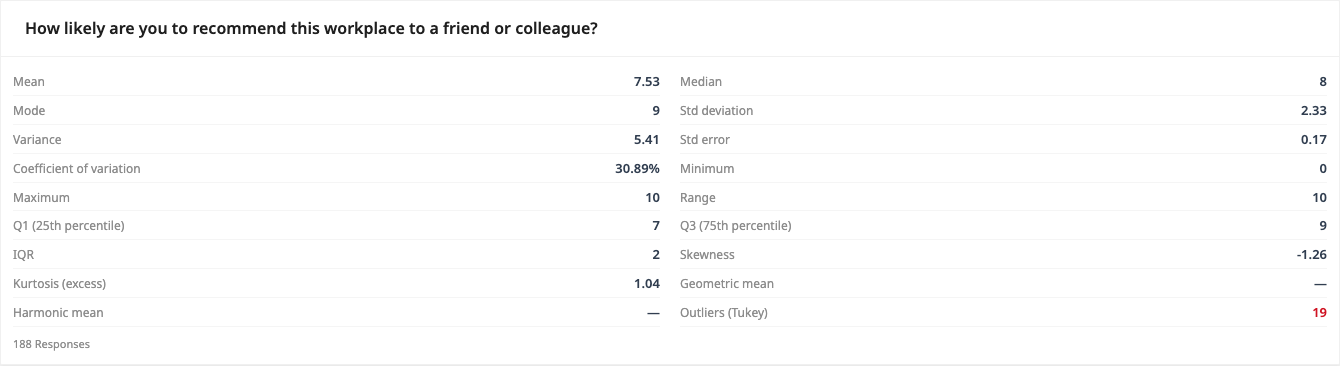
Built into PaperSurvey.io
Check the Tukey outlier count in Descriptive Statistics before investigating unusual responses.
Where it is used
- Teachers: A teacher pastes in a class's exam marks to see if any score is so unusually high or low that it is worth double-checking.
- Small-business owners: A café owner enters the month's daily takings to spot a day that was far busier or quieter than the rest.
- Customer-service teams: A support manager checks call-handling times to find the few calls that took far longer than everyone else's.
The 1.5 × IQR rule
A value is flagged as an outlier if it falls below Q1 − 1.5 × IQR or above Q3 + 1.5 × IQR, where IQR is the interquartile range. This is the standard method behind box plots.
When should you use it?
Use this tool whenever you have a list of numbers and want to check if any of them stand out as much higher or lower than the rest. It works well for test scores, prices, daily sales, ratings, response times, ages, or any measurement you collect. It is most useful before you work out an average, because a single odd value can pull an average up or down and give a misleading picture. Aim for at least a handful of numbers so the result is meaningful.
What does the result mean?
The calculator works out a normal range from the middle half of your numbers, then shows two cut-off points, a lower one and an upper one. Any number below the lower point or above the upper point is listed as an outlier, meaning it sits unusually far from the rest. There is no single good or bad answer here. The widely used guideline is the 1.5 times IQR rule: values beyond that distance from the middle are treated as outliers worth checking. No outliers simply means your numbers are fairly consistent.
Mistakes to avoid
Do not paste text, currency signs, or units along with your numbers, as these can stop the tool working. Avoid running it on only two or three values, because there is too little data to judge what is normal. Remember that an outlier is not automatically a mistake. It might be a genuine, important result, so investigate before deleting or changing anything. Also check for simple typos first, such as an extra zero, since these are a common reason a number looks unusual. Keep all numbers in the same units.
How to use this calculator
- Type or paste your numbers into the box, separating each one with a comma, a space, or a new line.
- Make sure you have entered several numbers and that there is no text, currency signs, or units mixed in.
- Start the calculation, or let the tool update the result as you type.
- Read the normal range and the list of flagged outliers, then check any flagged numbers to see if they are real or a mistake.
Worked example
Suppose a shop records these daily sales: 10, 12, 13, 14, 15, 16, 18 and 45. The calculator works out a normal range of about 5.75 to 23.75. The value 45 sits above the top of that range, so it is flagged as an outlier, pointing to a day that was unusually busy and worth a closer look.
Frequently asked questions
What do I type in the box?
Type or paste your list of numbers, separating each one with a comma, a space, or a new line. Use plain numbers only, with no words, currency signs, or units.
Where do I get these numbers?
They usually come from a spreadsheet, a survey, a till report, or your own records. You can copy a column of figures and paste it straight in.
What is an outlier in plain terms?
It is a number that sits far away from most of the others in your list, either much higher or much lower. It can be a genuine unusual result or simply a typing mistake.
What does IQR mean?
IQR stands for interquartile range, which is just the spread of the middle half of your numbers. The tool uses it to decide what counts as a normal range and what falls outside it.
Does an outlier mean the number is wrong?
Not always. An outlier is only a flag that a value is unusual, so check it before acting. Sometimes it is a real result you want to keep, and sometimes it is an error to fix.
Get Started with PaperSurvey.io Software
Start your 14-day free trial now, no credit card required.