Cramér's V Calculator
Measure how strongly two categorical variables are associated. Paste a contingency table, one row per line.
Learn how to calculate it yourselfEnter your values
Results update as you type.
How to enter your data
Enter your counts as a small table. Put each row on its own line, and separate the numbers within a row with commas. Each row is one category of the first thing (like "In town" and "Out of town"), and each column is one category of the second thing (like "Liked" and "Disliked"), so a cell holds the count of people in that exact combination.
Cramér's V
Check your inputs
Enter valid values to see your result. Use the field hints or open the data guide for help.
The Cramer's V Calculator measures how strongly two "category" questions are linked, for example whether someone's age group is related to which product they chose. You type in a table of counts, and it gives back a single number between 0 and 1. A number near 0 means the two things are barely related, while a number near 1 means they are very strongly related.
Calculate it yourself
Example: measure association in a two-by-two table with rows 12, 8 and 8, 12.
Follow this worked example, then repeat the steps with your own numbers.
Calculate the expected counts
N = 40; expected count in each cell = 20 × 20 ÷ 40 = 10Calculate chi-square
χ² = 4 × (2² ÷ 10) = 1.6Each observed count is 2 away from its expected count, so all four contributions are equal.
Adjust for the table dimensions
k = smaller of (rows − 1) and (columns − 1) = 1; N × k = 40Calculate the effect size
V = √[χ² ÷ (N × k)] = √(1.6 ÷ 40) = √0.04 = 0.200
V measures strength, not direction or statistical significance. The p-value shown by the calculator comes from a separate upper-tail chi-square lookup.
Check your answer in the calculatorBuilt into PaperSurvey.io
Use the V statistic on a categorical comparison to assess the size of an association alongside its p-value.
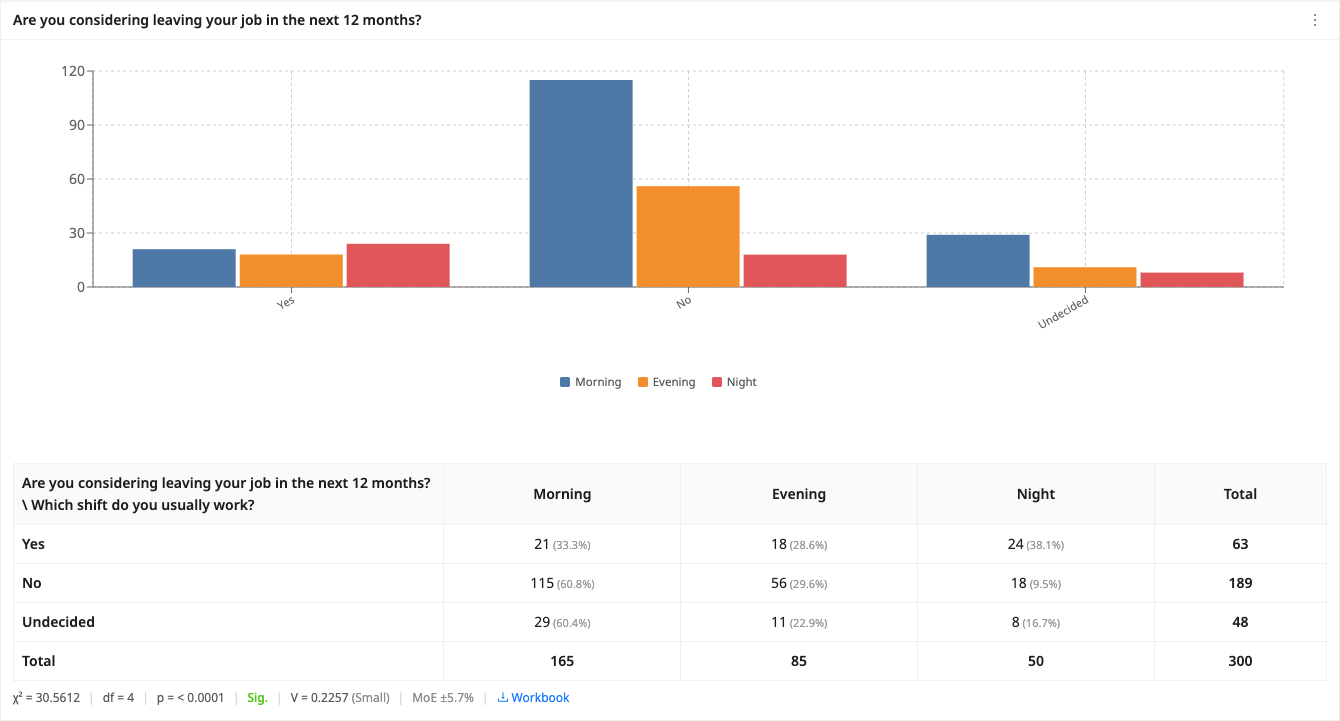
Where it is used
- Teachers: A teacher checks whether the class a student is in is related to whether they passed or failed the end-of-term test.
- Small-business owners: A shop owner sees if the branch a customer visited is linked to whether they left a positive or negative review.
- HR staff: An HR officer looks at whether an employee's department is connected to whether they stayed with or left the company.
Reading Cramér's V
Cramér's V ranges from 0 (no association) to 1 (perfect association). As a rough guide, 0.1 is small, 0.3 is medium and 0.5 or above is large. It is derived from the chi-square statistic and the table size.
When should you use it?
Use this calculator when you want to know if two "category" questions are related. A category question has answers that are labels, not numbers, such as yes or no, male or female, or which branch someone visited. Cramer's V tells you how closely one category is tied to another. It works with tables of any size, so you can compare two groups or many at once. If your data is made of real numbers, like age in years or money spent, this is not the right tool for that.
What does the result mean?
The result is a single number between 0 and 1. A value near 0 means there is almost no link between your two categories. A value near 1 means they are very strongly linked, so knowing one tells you a lot about the other. For a simple two-by-two table, a common guideline is that about 0.1 is a small link, about 0.3 is a moderate link, and 0.5 or more is a strong link. Larger tables shift these marks, so treat them only as a rough guide.
Mistakes to avoid
Make sure every row has the same number of counts, or the table will not line up. Enter the actual number of people or responses in each cell, not percentages. Do not use this for number answers like age or price, because it is only for categories. Remember that a strong Cramer's V shows two things move together, but it does not prove that one causes the other. Finally, very small samples can give misleading results, so gather enough responses first.
How to use this calculator
- Build your table: list each group as a row and each answer choice as a column, then count how many responses fall in each cell.
- Enter the counts, putting one row on each line and separating the numbers with commas.
- Check that every row has the same number of values, then run the calculation.
- Read the result, a number between 0 and 1, where higher means a stronger link between the two categories.
Worked example
A cafe asks 100 customers whether they liked a new muffin, split by where they live. In town, 30 liked it and 20 did not. Out of town, 10 liked it and 40 did not. You enter "30, 20" on the first line and "10, 40" on the second line. The calculator returns a Cramer's V of about 0.41, a moderate to strong link, suggesting that where someone lives and whether they like the muffin are related.
Frequently asked questions
What do I type in each cell of the table?
Type the count, meaning the number of people or responses that fall into that exact combination of categories. For example, how many women answered "yes."
Where do I get these numbers?
Count them from your survey results or a spreadsheet. PaperSurvey can produce these tallies for you automatically once your paper or web surveys are scanned in.
What does the final number mean?
It is a score from 0 to 1 showing how strongly two categories are related. Closer to 1 means a stronger link, and closer to 0 means a weaker link.
Does a high value mean one thing causes the other?
No. A high value only shows the two categories are related. It does not prove that one causes the other.
What size table can I use?
Any size. You can use two rows and two columns, or many rows and columns, as long as every row has the same number of values.
Get Started with PaperSurvey.io Software
Start your 14-day free trial now, no credit card required.