Z-Score Calculator
Standardise a value. Enter the raw value, the mean and the standard deviation to get its z-score.
Learn how to calculate it yourselfEnter your values
Results update as you type.
How to enter your data
Type each of your numbers into the box and press comma or Enter after each one, or paste the whole list at once with the numbers separated by commas or new lines. Enter plain numbers only, with no words, money signs, or percent symbols, and use a dot for any decimals, such as 4.5. If the calculator asks, also enter the single value you want to measure against the group.
Z-score
- Percentile
- 93.3%
The Z-Score Calculator tells you how far one number sits above or below the average of a group, measured in "standard deviations" (a standard way of describing how spread out the numbers are). A z-score of 0 means the number is exactly average, a positive score means it is above average, and a negative score means it is below. The bigger the score, the more unusual that number is compared with the rest of the group.
Calculate it yourself
Example: a value of 85 comes from a distribution with mean 70 and standard deviation 10.
Follow this worked example, then repeat the steps with your own numbers.
Find the distance from the mean
x − mean = 85 − 70 = 15Divide by the standard deviation
z = (x − mean) ÷ SD = 15 ÷ 10 = 1.5Check the result in the original units
Mean + z × SD = 70 + 1.5 × 10 = 85The value is 1.5 standard deviations above the mean. A negative z-score would be below the mean.
Look up the normal percentile
Φ(1.5) × 100 ≈ 0.93319 × 100 ≈ 93.3%A standard normal table gives the area below 1.5. This percentile assumes a normal distribution; it is not a rank calculated from raw data.
Use your PaperSurvey.io results
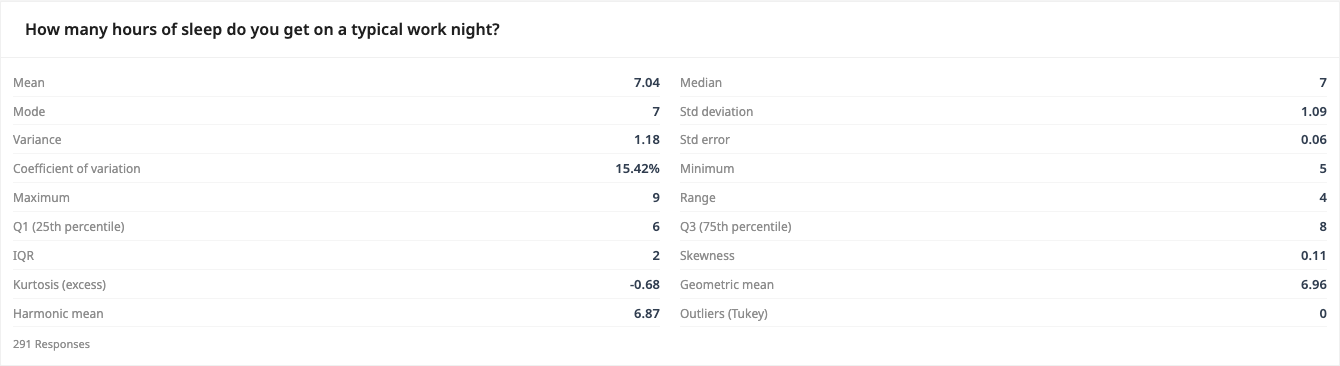
Use a question’s mean and standard deviation to standardize an individual response in this calculator.
Where it is used
- Teachers: A teacher enters every pupil's test score and checks how far one pupil's mark sits above or below the class average.
- Small-business owners: A cafe owner enters daily sales for the month to see whether one unusually quiet day was really out of the ordinary.
- HR and staff-survey teams: An HR officer enters each department's staff satisfaction rating to spot a team whose result is far from the company average.
What is a z-score?
A z-score expresses how many standard deviations a value sits above or below the mean. A z-score of 0 is exactly average; +1 is one standard deviation above the mean. It lets you compare values from different scales.
When should you use it?
Use it when you have a group of numbers and want to know whether one of them is normal or unusual compared with the rest. It works well for test scores, survey ratings, prices, times, or any measurement where you already have several results to compare. Instead of guessing whether a number is high or low, the z-score gives you a clear figure. It is most useful when you have a good handful of numbers, roughly ten or more, so that the average and the spread are meaningful.
What does the result mean?
The result is the z-score. Zero means the number matches the group average exactly. A score of plus 1 means it sits one standard deviation above average, and minus 1 means one below. As a rough guide, about two thirds of everyday values fall between minus 1 and plus 1, and about 95 percent fall between minus 2 and plus 2. So a score beyond plus or minus 2 is fairly unusual, and beyond plus or minus 3 is rare and worth a closer look.
Mistakes to avoid
Do not mix different things in one list, such as prices and ages, because the result becomes meaningless. Enter every number, not just the high or low ones, or the average will be wrong. Check for typos like an extra zero, which can throw off the whole calculation. Remember a high z-score is not automatically good or bad, it only means unusual, so decide what that means for your situation. A tiny list of only two or three numbers will not give a reliable result.
How to use this calculator
- Type or paste your list of numbers, separating each one with a comma, Enter, or a new line.
- Check that only plain numbers are entered, with a dot for any decimals and no text, money signs, or percent symbols.
- Enter or select the single value you want to measure against the group, if the calculator asks for one.
- Read the z-score: 0 is average, a positive number is above average, a negative number is below, and anything beyond plus or minus 2 is unusual.
Worked example
Suppose five shops sold 20, 22, 25, 28, and 30 units. The average is 25. One shop sold 30, which is 5 above the average. Given how spread out this group is, that works out to a z-score of about 1.3, meaning that shop performed above average but not unusually so.
Frequently asked questions
What numbers do I type in?
Type the group of numbers you want to compare, for example every test score in a class or every rating from a survey. The calculator works out the average and spread for you.
Where do I get these numbers?
They usually come from your own records, such as a spreadsheet of scores, sales, or survey answers. If your survey was scanned in PaperSurvey, you can export the results and paste the column of numbers here.
What does a z-score of 0 mean?
It means that number is exactly equal to the average of the group. It is neither high nor low compared with the rest.
Is a high z-score good or bad?
Neither on its own. A high positive score just means the number is far above average, and a negative score means far below. Whether that is good or bad depends on what you are measuring.
What counts as an unusual score?
As a rough rule, a z-score between minus 2 and plus 2 is fairly normal. A score beyond plus or minus 2 is uncommon, and beyond plus or minus 3 is rare.
Get Started with PaperSurvey.io Software
Start your 14-day free trial now, no credit card required.