Fisher's Exact Test Calculator
Test association in a 2×2 table, even with small counts. Enter the four cell values.
Learn how to calculate it yourselfEnter your values
Results update as you type.
How to enter your data
This calculator uses a two-by-two table of whole numbers, which are simply counts of people or items. Put each group on its own line, with the two counts separated by a comma, so you enter four whole numbers in total. For example, type "8, 2" on the first line and "3, 7" on the second. Use plain counts, never percentages or averages.
p-value (two-tailed)
Significant (p < 0.05)
The Fisher's Exact Test Calculator checks whether two yes/no things are really linked, using small counts. It is built for a small two-by-two table: two groups, where each person or item falls into one of two outcomes, such as pass or fail. It gives you a p-value, a single number that tells you how likely your result could have happened just by chance rather than being a real difference.
Calculate it yourself
Use the 2 × 2 table with first row 8, 2 and second row 1, 5.
Follow this worked example, then repeat the steps with your own numbers.
Write down the fixed row and column totals
Row totals = 10 and 6; column totals = 9 and 7; total = 16.Find the probability of the observed table
P(observed) = C(9, 8) × C(7, 2) ÷ C(16, 10) = 189/8008 ≈ 0.02360.C(n, k) = n! ÷ [k!(n − k)!] counts combinations, and n! is the product of the integers from 1 through n.
Enumerate tables with the same totals
The upper-left cell can be 3, 4, 5, 6, 7, 8 or 9. For each x, use P(x) = C(9, x) × C(7, 10 − x) ÷ C(16, 10).Add probabilities no greater than the observed one
Include x = 3, 8 and 9: p = (84 + 189 + 7) ÷ 8008 ≈ 0.03497.This is the two-sided probability-ordering definition used by this calculator. Larger tables make the enumeration laborious; a spreadsheet helps.
Built into PaperSurvey.io
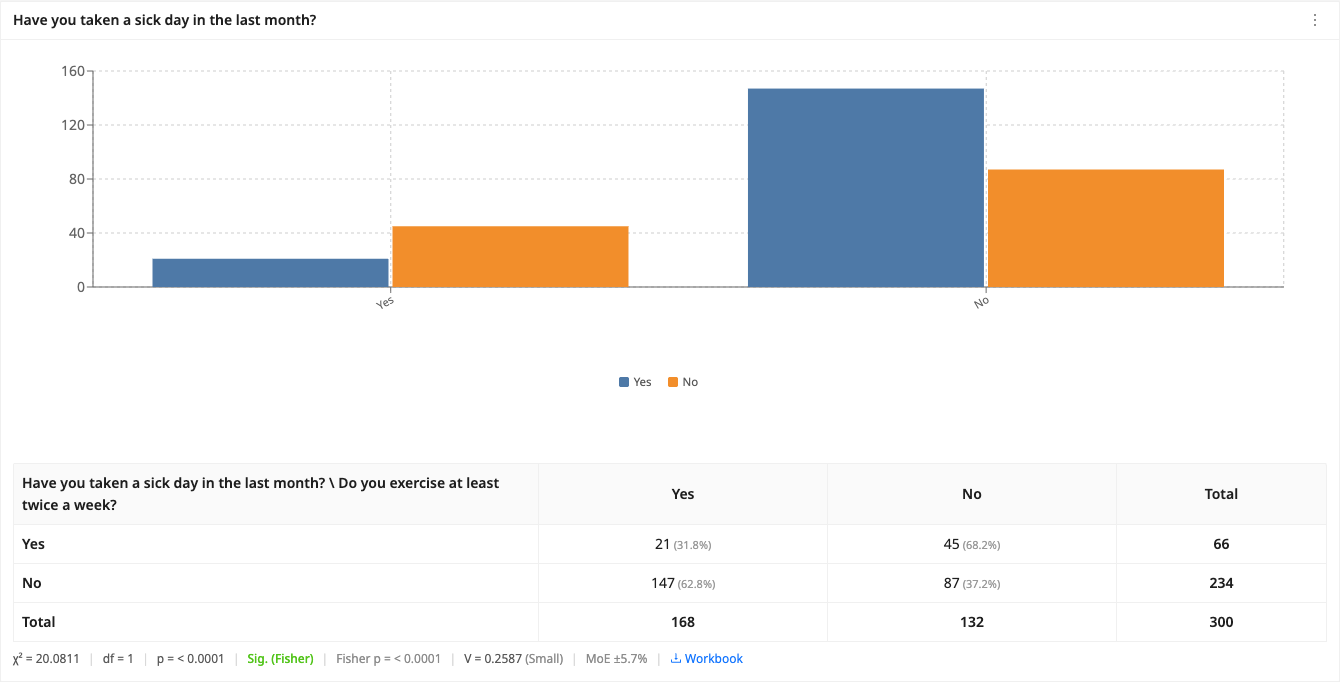
Compare two binary questions in Advanced mode to get Fisher’s exact test alongside the cross-tab.
Where it is used
- Teachers: A teacher checks whether more students passed an exam after a new study method compared with the old one, using a small class.
- Small-business owners: A cafe owner tests whether customers who were given a loyalty card came back more often than those who were not.
- HR staff: An HR manager looks at whether men and women were hired at different rates from a small pool of job applicants.
When to use Fisher’s exact test
Fisher’s exact test is preferred over chi-square for 2×2 tables with small expected counts (under 5). It computes an exact p-value rather than an approximation.
When should you use it?
Use it when you have two groups and each person or item falls into one of two outcomes, like pass or fail, or yes or no, and your numbers are small. It is especially handy when your totals are modest or when some of the four counts are under five. The test answers one question: is the split you see between the two groups a real difference, or could it easily be down to chance? It is the usual choice when a chi-square test warns that your sample is too small to trust. Great for quick before-and-after or group-versus-group checks.
What does the result mean?
The main result is the p-value, a number between 0 and 1. It tells you how likely you would see a difference this big, or bigger, if the two things were not actually linked. A small p-value means the difference is probably real. A large one means it could easily be chance. The widely used cut-off is 0.05. Below that, people usually call the result statistically significant, meaning it is unlikely to be a fluke. Above 0.05, treat the difference as unproven rather than as proof that the groups are the same.
Mistakes to avoid
Enter counts, not percentages or averages. The test needs the actual number of people or items in each box. Do not count the same person twice, since each one belongs in exactly one box. Remember that a significant p-value shows a link, not that one thing caused the other. A p-value above 0.05 does not prove the two groups are identical, it may just mean you do not have enough data yet. Finally, do not add extra rows or columns. This test is built only for a simple two-by-two table.
How to use this calculator
- Enter the four counts from your two-by-two table, one group per line, with the two numbers separated by a comma.
- Double-check that each number is a whole count of people or items, not a percentage or an average.
- Press the calculate button to run the test.
- Read the p-value: below 0.05 usually means a real difference, while above 0.05 means it could be chance.
Worked example
Suppose 10 people tried a new checkout process and 8 finished their purchase, while 10 people used the old checkout and only 3 finished. You would enter "8, 2" on the first line and "3, 7" on the second. The calculator returns a p-value of about 0.07. Since that is above 0.05, the difference looks promising but is not yet strong enough to be sure.
Frequently asked questions
What do I type in each box?
Type the four whole numbers from your two-by-two table: how many in each group fell into each of the two outcomes. Use plain counts, not percentages.
Where do I get these numbers?
Count them from your own records, survey answers, or a tally sheet. For example, how many people in each group answered yes and how many answered no.
What does the p-value tell me?
It is the chance of seeing a difference this large if the two things were truly unrelated. A small number, usually under 0.05, suggests the difference is real.
What counts as a good result?
There is no good or bad, but a p-value below 0.05 is the common line for calling a result meaningful. Above 0.05 means the difference is not proven.
How is this different from a chi-square test?
Both check whether two categories are linked, but Fisher's Exact Test is more reliable when your numbers are small or some counts are under five.
Get Started with PaperSurvey.io Software
Start your 14-day free trial now, no credit card required.