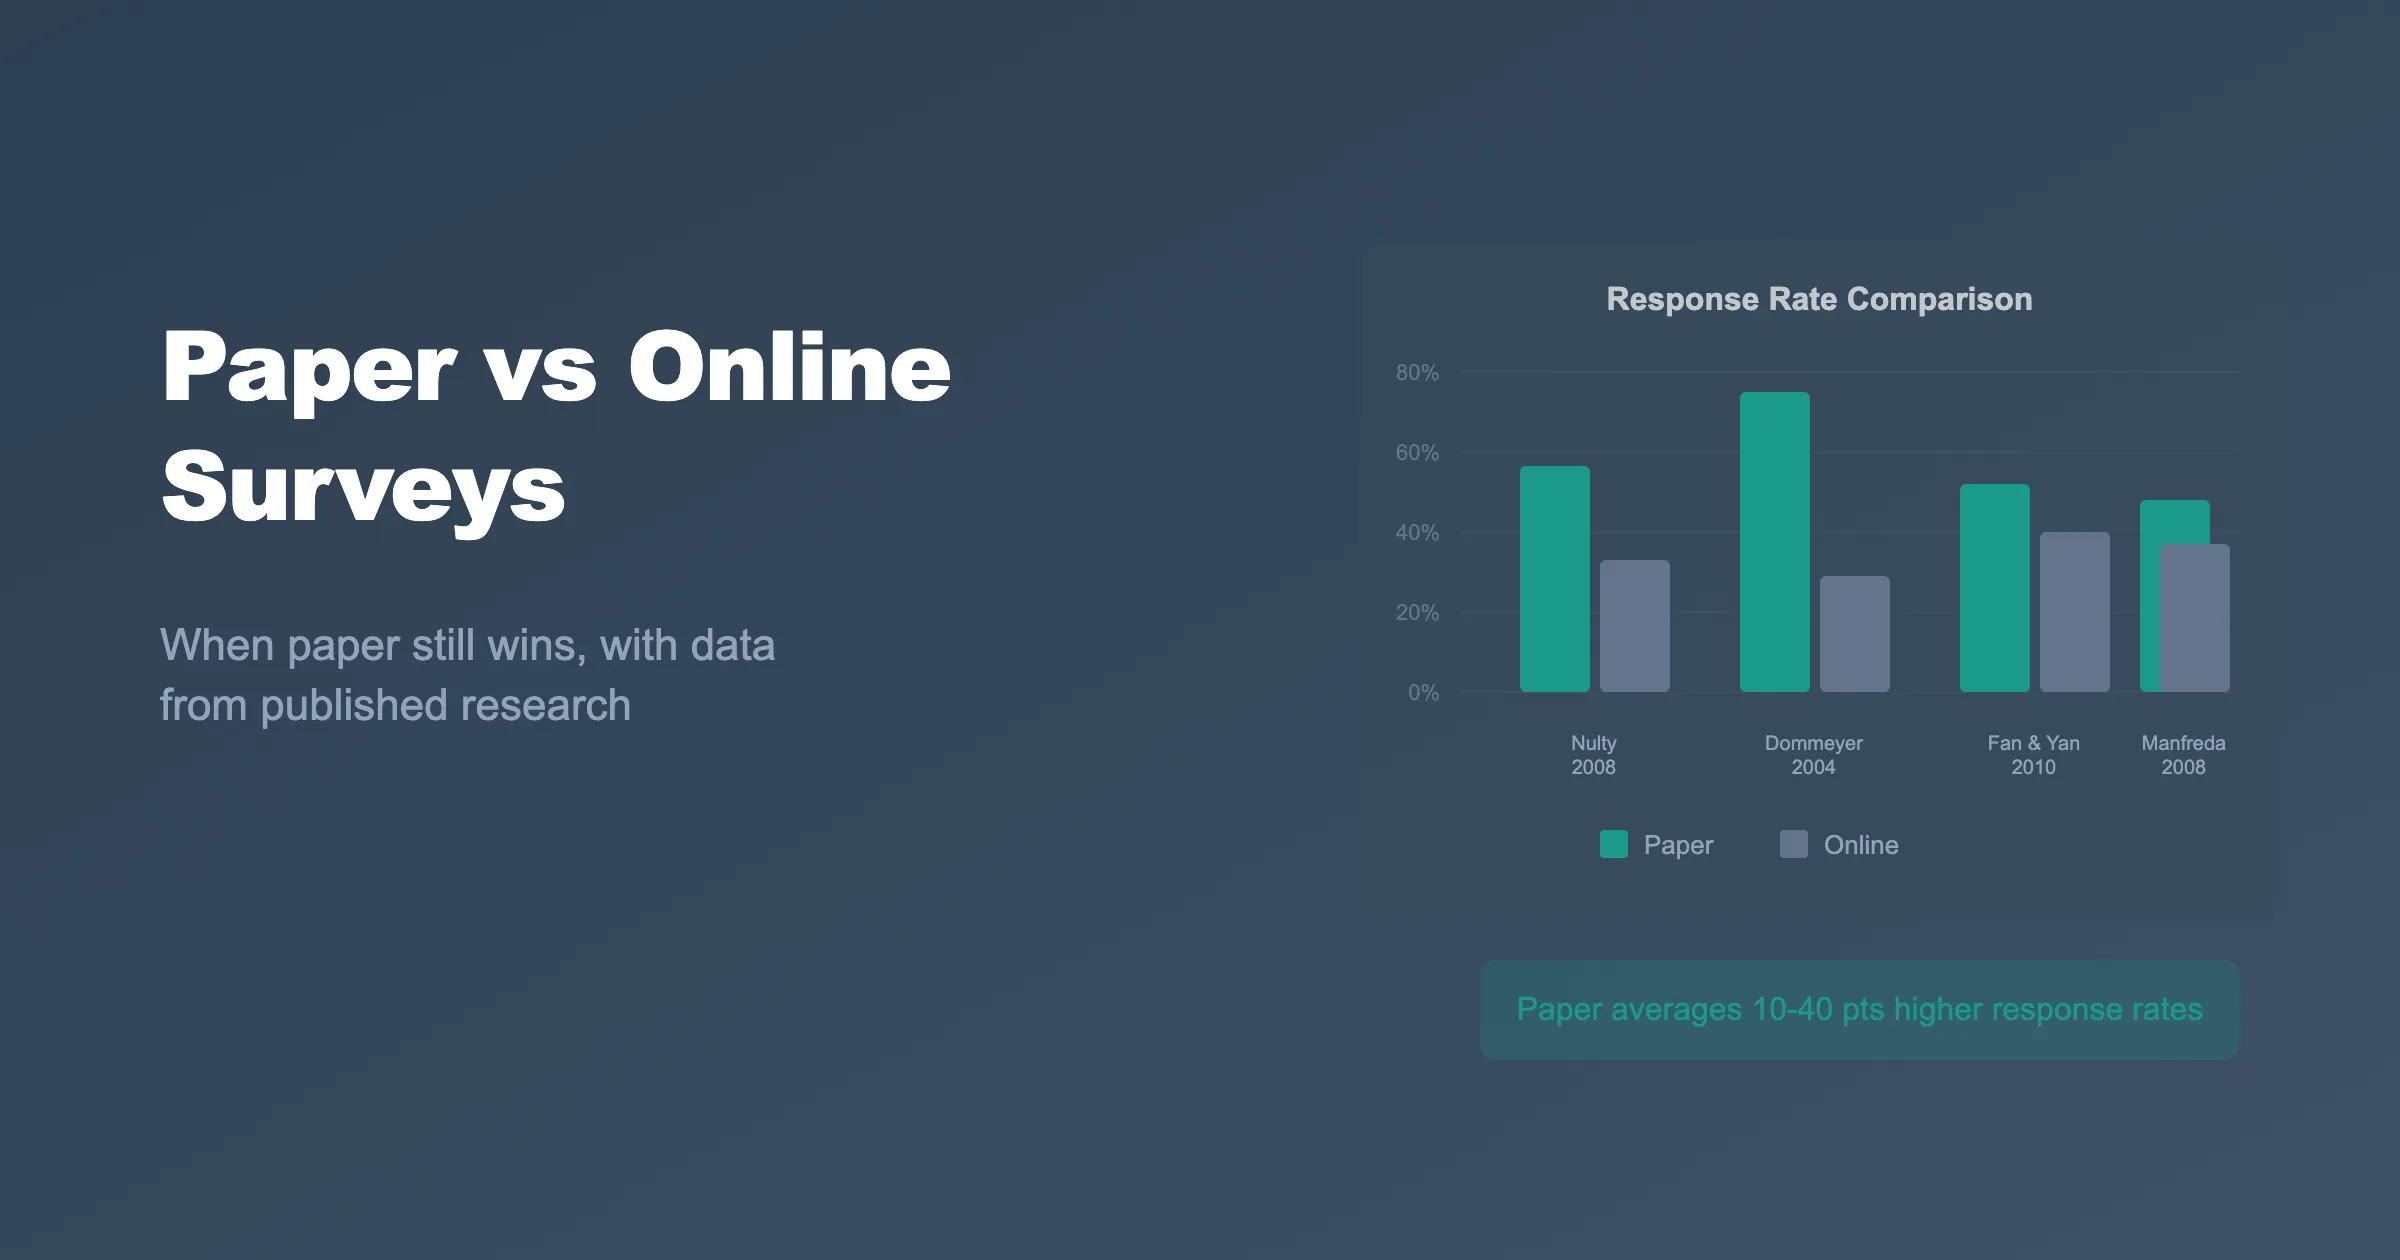
Online surveys are cheaper to distribute, faster to deploy, and easier to analyze, and for many use cases they are the right choice. But a persistent finding across decades of research is that paper surveys achieve higher response rates than online alternatives. This is not nostalgia. It is what the published evidence shows, and modern OCR now removes the old argument against paper.
The Response Rate Gap: What the Research Shows
The most frequently cited study on paper versus online response in higher education is Nulty (2008), in Assessment & Evaluation in Higher Education, which found paper course evaluations consistently outperformed online, often by 20 percentage points or more. Broader mode-comparison research tells the same story: paper still draws far more responses than screens, with in-person paper around 75 to 90 percent and mailed paper around 56 percent, versus roughly 33 percent for web surveys (Shih & Fan, 2008; Meyer et al., 2020). A meta-analysis of 45 studies found web response rates averaged 11 percentage points below other modes, including mail (Manfreda et al., 2008). Dillman, Smyth, and Christian (2014) document that well-designed mail surveys, with pre-notification and follow-ups, stay competitive with or ahead of web. Where response rate drives the validity of findings, a gap of this size is substantial.
Why Paper Gets Higher Response Rates
Several mechanisms explain the advantage:
- Physical salience. A questionnaire on a desk is harder to ignore than an email lost in a crowded inbox.
- Reciprocity. A printed form signals real effort, which raises the felt obligation to respond.
- Less fatigue. Inboxes are saturated with survey links, so paper stands out precisely because it is uncommon.
- Accessibility. Paper needs no device, connection, or digital literacy, so it reaches people that web surveys exclude.
- Fewer exits. No browser tabs, push notifications, or timeouts, so abandonment is lower.
Demographics Where Paper Dominates
The advantage is strongest in specific populations:
- Older adults (65+). A study of Medicare beneficiaries found a paper response rate of 44% versus 16% online (Couper et al., 2007).
- Rural and low-connectivity communities. They respond far better to mailed paper than to web invitations they may never receive.
- Healthcare patients. Satisfaction and health behavior studies see higher paper response, especially among older and lower-income patients.
- Students in class. Evaluations completed on paper during class finish at high rates; the same survey online after class does not.
- Deskless employees. Factory, field, and warehouse staff respond better to paper handed out at meetings than to an email link.
Coverage Bias in Online-Only Surveys
Response rate is only half the story. Coverage bias, the systematic exclusion of groups who never enter the sample, is more serious, because those groups often differ on exactly what you are measuring and no weighting fully corrects it. An online-only survey excludes anyone without a device, a connection, or the skills to complete a web form. Even in the United States, about 6% of adults do not use the internet at all (Pew Research Center, 2024), and many others get online only through a phone, which makes a long web form harder to finish than a single paper page. For representative public health, government, and social science work, paper reaches people that online methods miss.
Data Quality: Longer, More Thoughtful Responses
Denscombe (2009), in the International Journal of Social Research Methodology, found that paper respondents give longer, more detailed open-ended answers, while online respondents more often skip open-ended questions or answer minimally. For work that leans on qualitative data, that quality difference can matter as much as the response rate.
Compliance, Legal, and Institutional Requirements
Some data collection must happen on paper: clinical trial consent and instruments under many regulators, census and government programs that keep paper to cover everyone, safety and compliance audits in regulated industries, paper ballots as the primary or backup record, and review boards that require paper consent. Here paper is not optional. The question is how efficiently it becomes digital data.
The Old Weakness of Paper, Now Solved
The historical case against paper was always manual data entry: slow, costly, and error-prone. Modern OCR and OMR remove most of that typing. With PaperSurvey.io you design a survey in an online builder, print on plain paper with any printer, scan with a flatbed, document scanner, or phone, upload by browser, email, or Dropbox, and process responses automatically, including handwriting via AI-powered recognition. Export the reviewed data to Excel, CSV, SPSS, or Google Sheets. Recognition itself runs in minutes; the review time depends on your forms. Validation and recognition settings flag answers such as double-marked choices or low-confidence handwriting for a person to check, and a quick spot-check of accepted pages helps find misreads the flags miss.
When to Choose Paper
Paper is the stronger choice when your audience includes older adults, rural communities, or anyone with limited internet, when representative sampling rules out coverage bias, in low-connectivity field settings and group settings like classrooms and events, when regulations mandate physical forms, or when open-ended answer quality matters.
When Digital Makes More Sense
Online is the better choice when your audience is young, urban, and digitally engaged, when you need rapid turnaround and real-time results, when printing and postage are out of budget, when you need complex real-time branching, or when geography makes paper logistics impractical.
The Hybrid Approach
Often the best strategy is both. PaperSurvey.io runs paper and web responses for one survey: hand printed forms to the populations that respond better on paper, share a web link for everyone else, and merge all responses into a single dataset. This mixed-mode design captures the strengths of each method without the limits of either.
References
- Couper, M. P., Kapteyn, A., Schonlau, M., & Winter, J. (2007). Noncoverage and nonresponse in an Internet survey. Social Science Research, 36(1), 131-148.
- Denscombe, M. (2009). Item non-response rates: A comparison of online and paper questionnaires. International Journal of Social Research Methodology, 12(4), 281-291.
- Dillman, D. A., Smyth, J. D., & Christian, L. M. (2014). Internet, Phone, Mail, and Mixed-Mode Surveys: The Tailored Design Method (4th ed.). Wiley.
- Manfreda, K. L., Bosnjak, M., Berzelak, J., Haas, I., & Vehovar, V. (2008). Web surveys versus other survey modes: A meta-analysis comparing response rates. International Journal of Market Research, 50(1), 79-104.
- Meyer, V. M., et al. (2020). Response rates across survey modes: A comparative review.
- Nulty, D. D. (2008). The adequacy of response rates to online and paper surveys: What can be done? Assessment & Evaluation in Higher Education, 33(3), 301-314.
- Pew Research Center. (2024). Internet/Broadband Fact Sheet.
- Shih, T.-H., & Fan, X. (2008). Comparing response rates from web and mail surveys: A meta-analysis. Field Methods, 20(3), 249-271.
Try It Free
You can try this without touching your budget. The 14-day free trial needs no credit card: design a survey, print it, scan the returns, and watch clean data land in Excel or SPSS. Start your free trial and see how paper and digital can work together.