
A training program wants to know if it improved participants' confidence. The obvious approach is a survey before and a survey after, then compare the averages. It sounds airtight. In practice it hides a problem that has tripped up program evaluators for decades: people do not measure themselves against a fixed ruler.
When someone rates their confidence as a 4 out of 5 before a workshop, and a 4 again afterward, it is tempting to conclude nothing changed. But the workshop may have taught them how much they did not know, so their internal definition of "confident" shifted. The two 4s are not measured on the same scale. This is called response-shift bias, and it means a straightforward pre/post comparison can understate, hide, or even reverse a real effect.
One practical answer is to ask about before and after together, in a single question, after the experience. This post explains why that works, when to use it, and how to build it into a survey that runs on paper or online.
The Problem With Separate Pre and Post Surveys
The standard pre/post design assumes the measuring instrument stays constant. Howard (1980), in a widely cited paper in Evaluation Review, showed that this assumption often fails. When a program changes how people understand the very thing being measured, their frame of reference moves between the pre-test and the post-test. He called the result response-shift bias, and demonstrated that it could mask genuine gains.
Sprangers and Schwartz (1999) developed this into a formal model in health-related quality of life research, where the effect is especially important: a treatment can change how a patient interprets "good health," so their self-rating shifts for reasons that have nothing to do with their actual condition improving or declining.
There are practical problems too. Separate surveys require matching each person's before and after responses, which is hard when responses are anonymous. Attrition means some people answer the pre-test but not the post-test, biasing the comparison. And the pre-test itself can sensitize respondents, changing how they respond later.
The Retrospective Approach
The alternative is to collect both ratings at the end, asking respondents to rate themselves both as they are now and as they were before. This is the retrospective pretest, or post-then-pre design.
Because both ratings are given at the same moment, from the same frame of reference, they are measured on the same internal scale. Rockwell and Kohn (1989) introduced the post-then-pre method in program evaluation for exactly this reason. Pratt, McGuigan, and Katzev (2000), writing in the American Journal of Evaluation, found that retrospective pre-test measures often detected program effects that a conventional pre/post design missed, and attributed the difference to the elimination of response shift.
Nimon, Zigarmi, and Allen (2011) reviewed the approach and confirmed that retrospective measures can give a more accurate picture of self-reported change when the construct being measured is itself affected by the intervention.
The retrospective design is not a universal replacement. It measures perceived change rather than change in an external truth, so it carries its own risk of recall bias and social desirability, and it is best suited to self-assessed attitudes, skills, and confidence rather than objective facts. But when the goal is to capture how much people feel they have changed on a dimension the program itself reshaped, asking before and after together is often the more honest measurement.
The Before/After Table
The cleanest way to ask this on a form is a side-by-side table. Each row is a statement. On the left, the respondent rates it for one condition; on the right, the same statement on the same scale for the other condition. Because the two scales sit next to each other, the respondent anchors both ratings against the same reference point, which is the whole idea.
The format is not limited to program pre/post. The same layout fits any paired comparison where you want two ratings of the same item under different conditions:
- Before and after a training, treatment, or intervention.
- Then and now, for retrospective change over a period.
- Expectation versus experience, comparing what people anticipated with what they received.
- Importance versus performance, a staple of customer experience research, where each attribute is rated both for how much it matters and how well you deliver it.
In every case the value comes from the visual pairing. Putting the two ratings on one line, sharing one scale, makes the comparison explicit for the respondent and keeps both halves of the answer on a single record for you.
Designing a Before/After Table
A few design choices make these tables work well, most of them shared with good grid design generally (Tourangeau, Couper, and Conrad, 2004, showed that spacing, alignment, and grouping all shape how respondents read a grid):
- Keep the statements parallel. Each row should be a single, clear item. Avoid double-barreled statements that ask about two things at once, since a split rating becomes uninterpretable.
- Use the same scale on both sides. The comparison only holds if the left and right rate identically. Mixing a 5-point scale on one side and a 4-point on the other breaks it.
- Label both sides clearly. Head the left and right columns unambiguously ("Before the program" / "After the program") so respondents never wonder which is which.
- Keep the row count moderate. Grids invite straight-lining, where respondents mark the same column down the page. A handful of well-chosen rows produces better data than a long matrix.
- Give a one-line instruction. On paper you cannot enforce completion with validation, so a short "Please mark one box on each side of every row" reduces missed cells.
Building a Before/After Table in PaperSurvey
PaperSurvey.io includes a dedicated Before/After Table question type. Each row carries a statement in the middle, with the same rating scale printed on both the left and the right, so respondents rate every item under both conditions in one compact grid. It prints with properly spaced checkboxes and reads back automatically through optical mark recognition, with no manual data entry.

You define the shared rating scale once as the options, add each statement as a row, and label the two sides. Because both sides share the same scale, the left and right ratings come back as separate, cleanly scanned values on the same response record, ready to compare.

As with every PaperSurvey question type, the same survey can collect responses on paper and through a web link, so an in-person cohort and a remote one can be measured with the identical instrument and analyzed together. Results export to CSV, Excel, SPSS, Stata, SAS, and R, so computing the before-to-after difference for each statement is straightforward in whatever tool you use.
Seeing the Change in Your Results
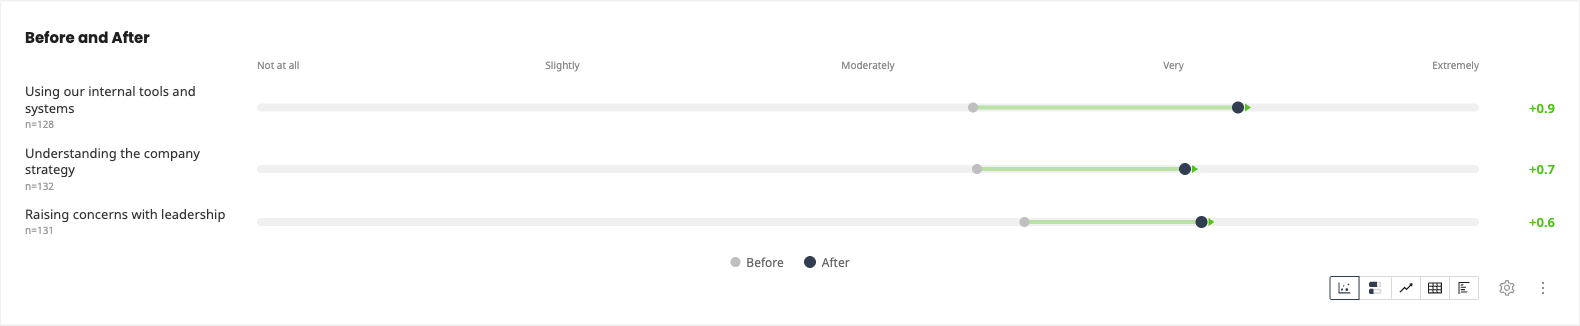
Because both ratings live on the same response record, PaperSurvey analyzes a Before/After Table as paired data instead of two unrelated questions. The default results view plots the average rating for each statement before and after on the shared scale, with the size and direction of the change alongside, so the shift is visible at a glance.
Averages can hide movement, so a second view classifies every respondent who answered both sides of a row as improved, unchanged, or declined. This answers the question a mean difference cannot: how many people actually moved, and in which direction.

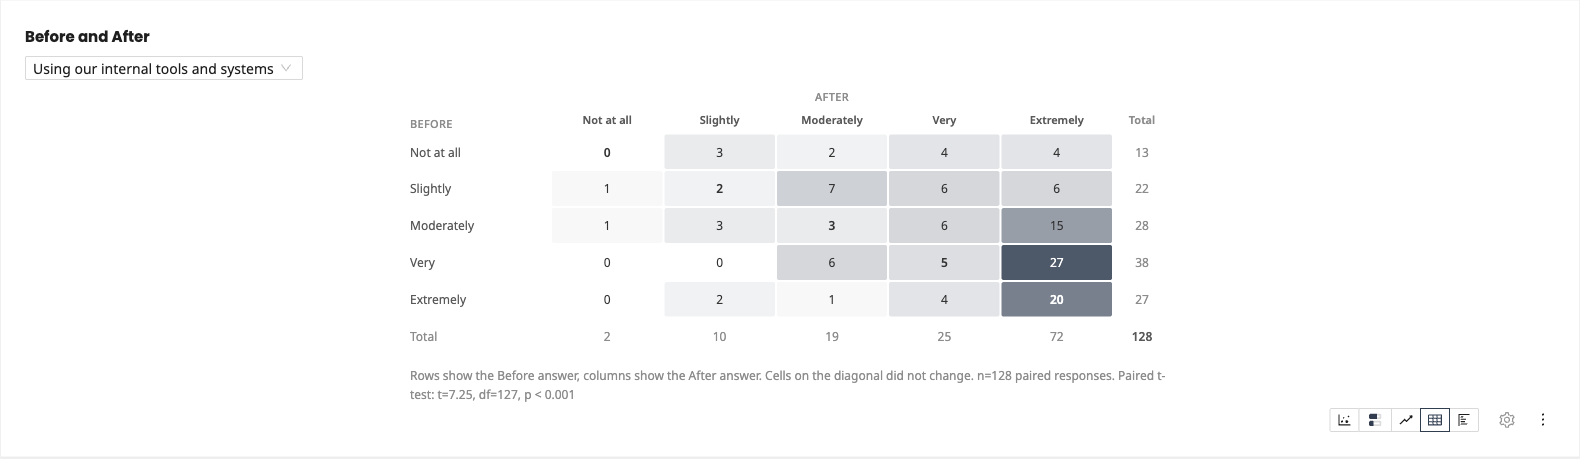
For a single statement, a transition matrix counts how respondents moved between every pair of ratings. The diagonal holds those who gave the same rating twice, and the cells around it show exactly where the movement happened. A paired t-test on the same responses indicates whether the average change is statistically distinguishable from zero. Only respondents who answered both sides of a row are included in these paired views, so partial answers never distort the change figures.
A stacked distribution view comparing the full before and after response distributions is also available, and every view exports to PowerPoint together with the rest of your report.
When to Use Which Design
Neither approach is universally correct. Use a conventional pre/post design when you can reliably match individuals over time and the construct you measure is stable and externally anchored, such as a test score or a measured outcome. Use a retrospective before/after table when you are measuring self-assessed attitudes, skills, or confidence that the intervention itself may reshape, when responses are anonymous and cannot be matched across two surveys, or when you can only reach respondents once, after the experience.
Many evaluations benefit from combining them: an objective measure for the outcome that has a fixed scale, and a before/after table for the self-perceived change where response shift is a genuine risk. The point is to match the measurement design to how the thing being measured actually behaves, rather than defaulting to two separate surveys because that is the familiar habit.
The Bottom Line
Measuring change is harder than subtracting one average from another. When a program changes how people understand what you are measuring, separate before and after surveys can quietly mislead you. Asking about before and after together, in a single side-by-side question answered after the experience, holds the frame of reference constant and keeps both halves of the answer on one record. On paper, where you often get one shot at each respondent, that single-question design is not just more accurate, it is frequently the only practical option.
References
- Howard, G. S. (1980). Response-shift bias: A problem in evaluating interventions with pre/post self-reports. Evaluation Review, 4(1), 93-106.
- Nimon, K., Zigarmi, D., & Allen, J. (2011). Measures of program effectiveness based on retrospective pretest data: Are all created equal? American Journal of Evaluation, 32(1), 8-28.
- Pratt, C. C., McGuigan, W. M., & Katzev, A. R. (2000). Measuring program outcomes: Using retrospective pretest methodology. American Journal of Evaluation, 21(3), 341-349.
- Rockwell, S. K., & Kohn, H. (1989). Post-then-pre evaluation. Journal of Extension, 27(2).
- Sprangers, M. A. G., & Schwartz, C. E. (1999). Integrating response shift into health-related quality of life research: A theoretical model. Social Science & Medicine, 48(11), 1507-1515.
- Tourangeau, R., Couper, M. P., & Conrad, F. (2004). Spacing, position, and order: Interpretive heuristics for visual features of survey questions. Public Opinion Quarterly, 68(3), 368-393.
Start your free trial and build a Before/After Table for paper or web.