<?xml version="1.0" encoding="UTF-8"?>
<?xml-stylesheet href="/vendor/feed/atom.xsl" type="text/xsl"?>
<feed xmlns="http://www.w3.org/2005/Atom" xml:lang="en-US">
                        <id>https://www.papersurvey.io/help/feed</id>
                                <link href="https://www.papersurvey.io/help/feed" rel="self"></link>
                                <title><![CDATA[PaperSurvey.io Help Center]]></title>
                    
                                <subtitle></subtitle>
                                                    <updated>2026-08-07T10:22:21+00:00</updated>
                        <entry>
            <title><![CDATA[How Do I Cancel or Upgrade My Account?]]></title>
            <link rel="alternate" href="https://www.papersurvey.io/help/subscription/article/cancel-or-upgrade-account" />
            <id>https://www.papersurvey.io/3</id>
            <author>
                <name><![CDATA[PaperSurvey.io]]></name>
            </author>
            <summary type="html">
                <![CDATA[<p>Your needs may change over time, and PaperSurvey makes it simple to adjust your subscription accordingly. You can upgrade, downgrade, or cancel at any time through your account settings, with fair prorated billing and no penalties.</p>
<h2>Upgrading or Changing Your Plan</h2>
<p>To modify your subscription:</p>
<ol>
<li>Go to your <a href="/app/settings/subscription">Subscription settings</a></li>
<li>Select the plan that best fits your needs</li>
<li>Confirm the change</li>
</ol>
<p>Upgrades take effect immediately. Your new plan starts a fresh billing cycle on the day you upgrade, and unused time on your old plan is applied as credit to the first invoice, so there is no double billing or lost time. Before you confirm, the confirmation screen shows the exact amount that will be charged.</p>
<p><strong>Example:</strong> If you are halfway through a $20/month plan and upgrade to $50/month, you will receive a $10 credit and pay $40 for your first month on the new plan. Your renewal date resets to the day you upgrade.</p>
<h2>Downgrading Your Plan</h2>
<p>Downgrading is scheduled rather than immediate. Choose a lower plan in your subscription settings and the change takes effect at the end of your current billing period. You keep your current plan and limits until then, there is no charge today, and you can cancel the scheduled change at any time before it takes effect. Your data and surveys remain fully intact.</p>
<h2>Canceling Your Subscription</h2>
<p>To cancel:</p>
<ol>
<li>Navigate to <a href="/app/settings/subscription">Subscription settings</a></li>
<li>Click the red "Cancel" button</li>
<li>Your subscription remains active until the end of your current billing period</li>
</ol>
<p><strong>Important notes about cancellation:</strong></p>
<ul>
<li>You keep full access until your billing period ends</li>
<li>Your surveys, responses, and data are not deleted when you cancel</li>
<li>You can reactivate anytime without losing your work</li>
<li>No cancellation fees or penalties</li>
</ul>
<h2>Need to Pause Instead?</h2>
<p>If you need a temporary break, cancel your subscription and your data stays safe. When you are ready to continue, simply resubscribe and pick up where you left off.</p>
<h2>Questions or Concerns?</h2>
<p>If you are considering cancellation due to an issue we might help resolve, please contact <a href="mailto:support@papersurvey.io">support@papersurvey.io</a>. We are here to help and may have solutions you have not considered.</p>]]>
            </summary>
                                    <updated>2026-07-18T08:45:27+00:00</updated>
        </entry>
            <entry>
            <title><![CDATA[Anonymously and Securely Verifying Paper Survey Responses]]></title>
            <link rel="alternate" href="https://www.papersurvey.io/help/scanning/article/how-can-multiple-users-verify-responses" />
            <id>https://www.papersurvey.io/4</id>
            <author>
                <name><![CDATA[PaperSurvey.io]]></name>
            </author>
            <summary type="html">
                <![CDATA[<p>After collecting survey responses, you may have pending verifications due to low recognition accuracy or handwritten fields. To manage costs, PaperSurvey puts the data verification process in your hands, allowing you to choose who will perform this task. That could be you, your employees, students, or outsourced personnel.</p>
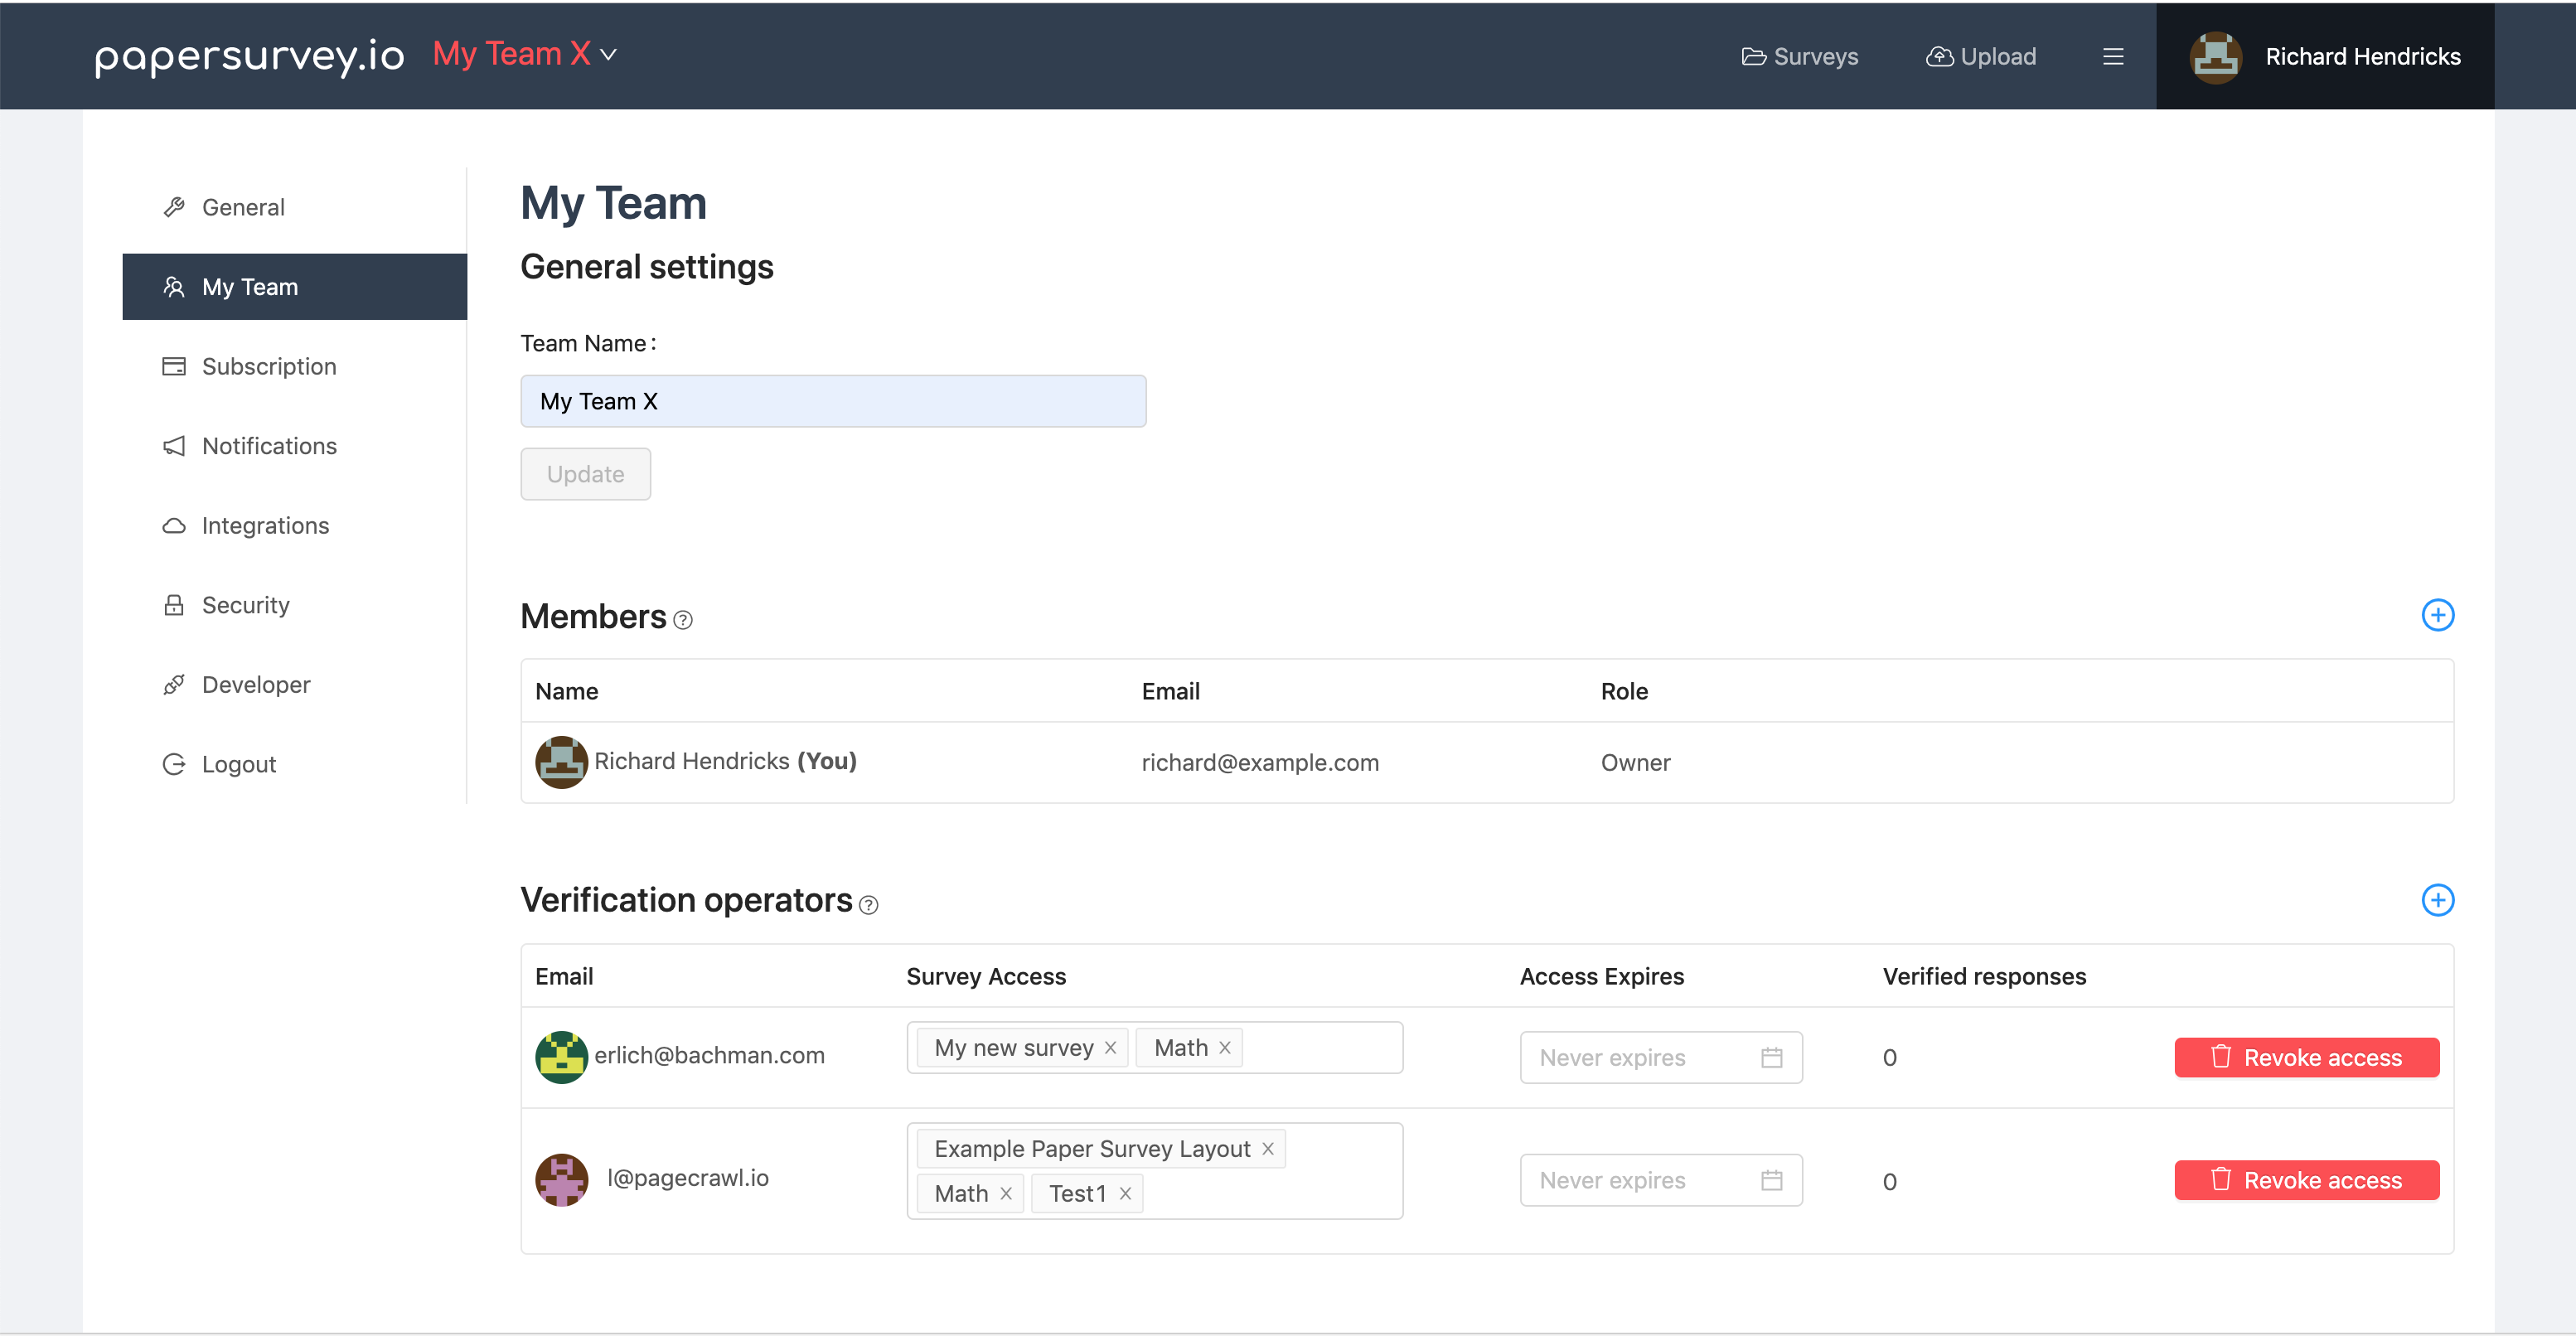
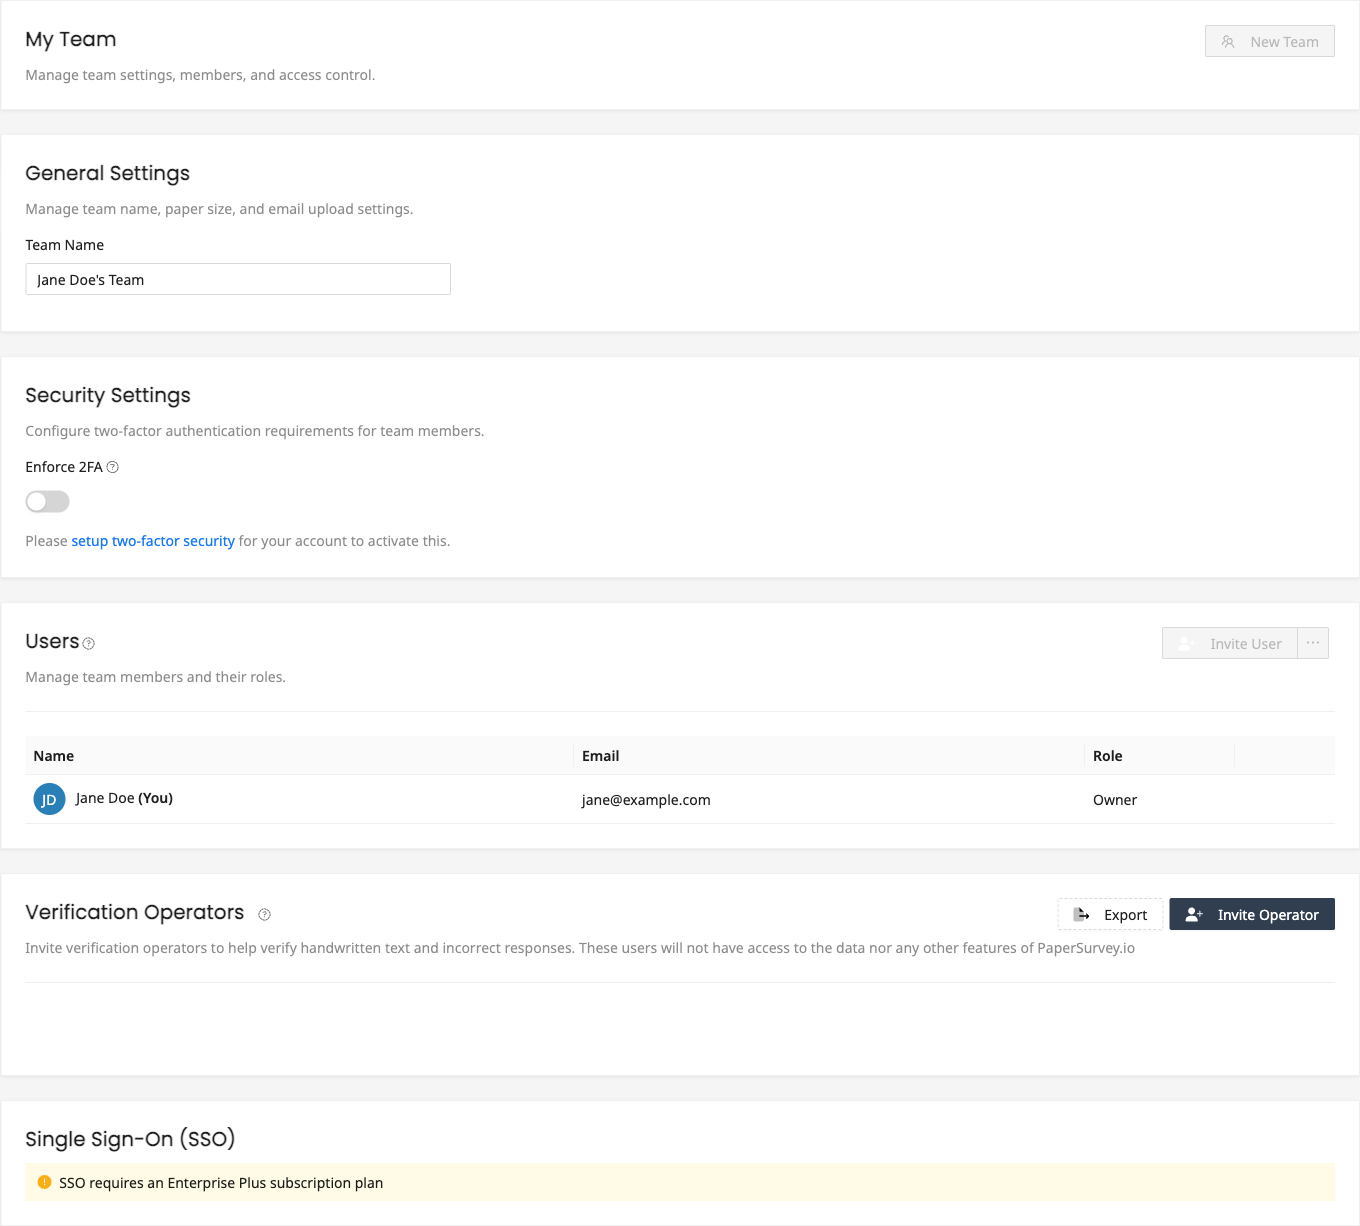
<p><img src="/images/blog/team-settings.png" alt="My team settings" /></p>
<center><i>You can access your team settings <a href="/app/settings/team">here</a></i></center>
<h2>How to Invite Someone to Your Account</h2>
<p>You have several options for inviting additional users to your account.</p>
<ol>
<li>
<p><strong>Member Access</strong>: Invite users as members, granting them full access to <a href="https://papersurvey.io">papersurvey.io</a>. They can create, update, or remove surveys and responses. This method is suitable for users you completely trust.</p>
</li>
<li>
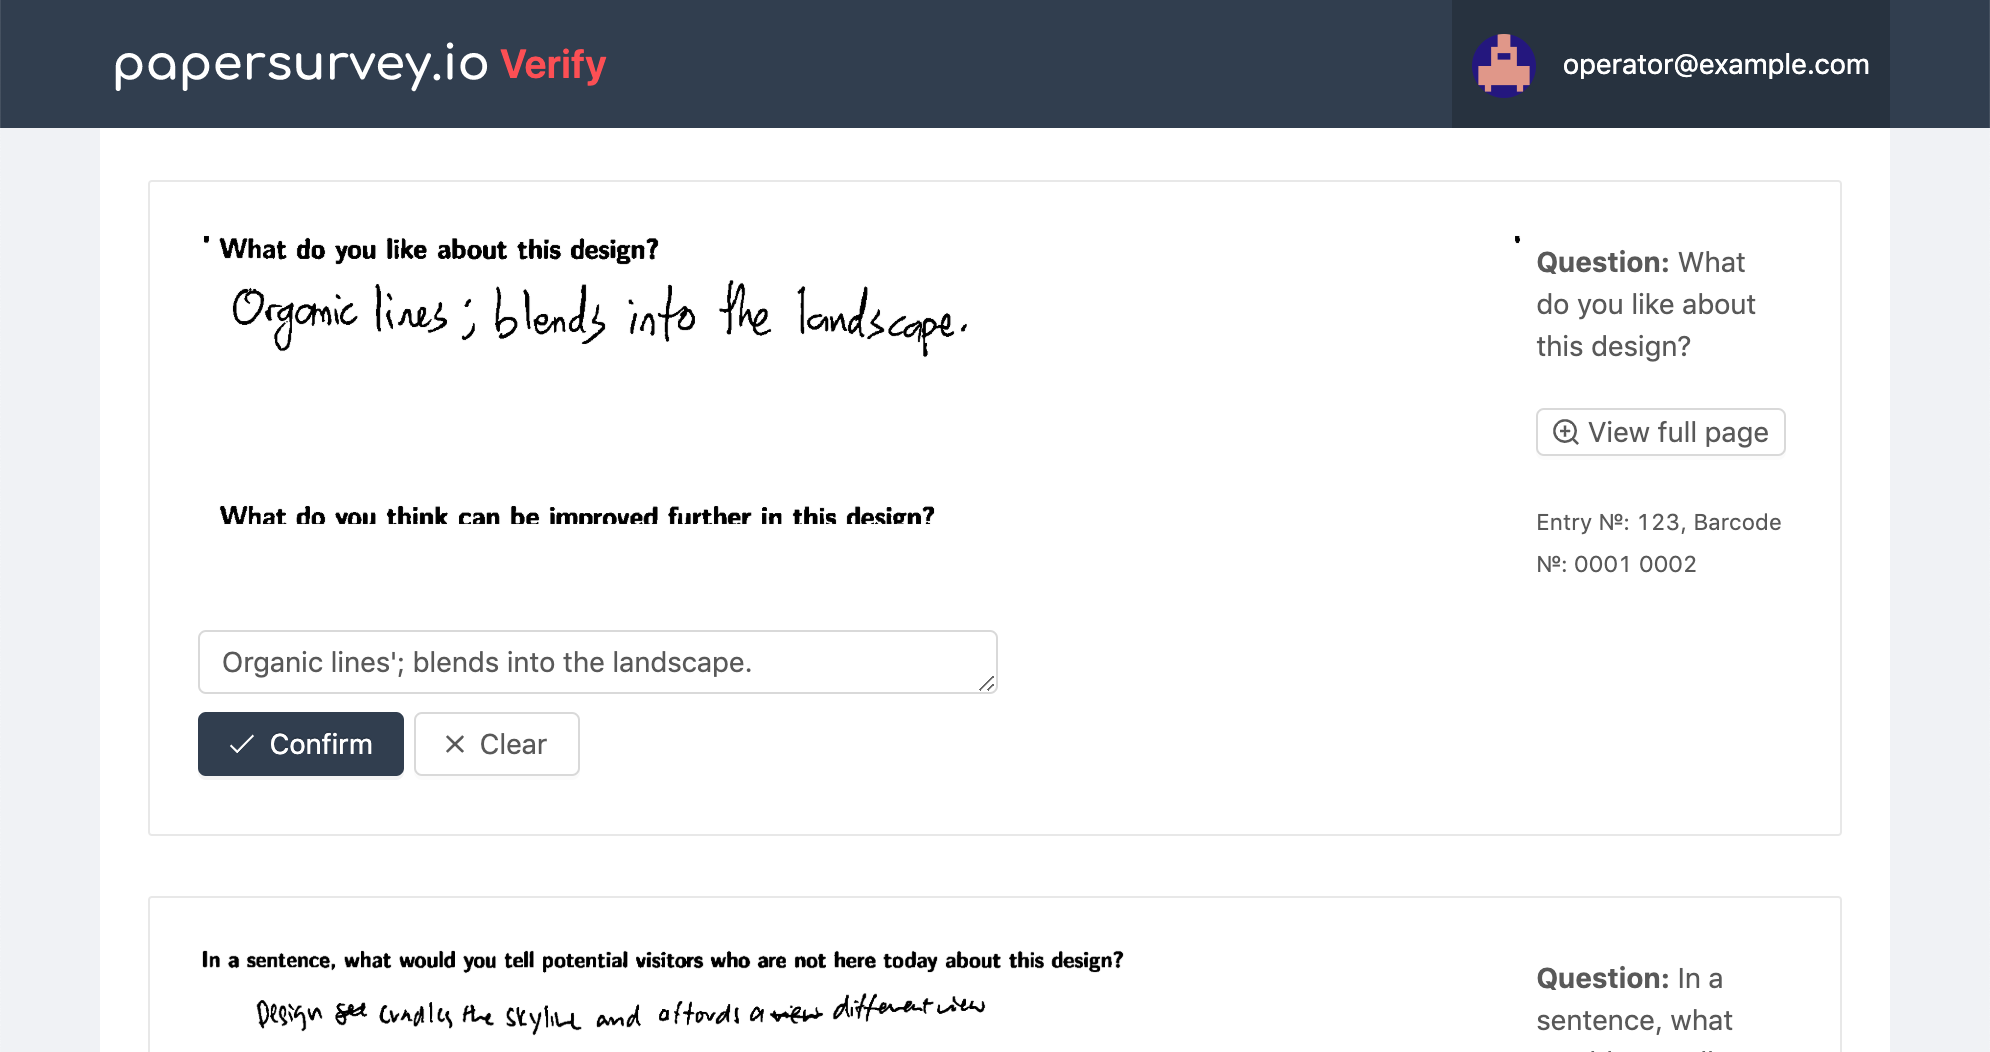
<p><strong>Verification Operator Access</strong>: Invite users as verification operators, providing access to the verification area for specific surveys in your account. You can set a limit on their access duration. This approach is ideal when you want individuals to verify responses without giving them full access to collected data. It also ensures anonymous response verification, as operators can only view question excerpts and, if necessary, open the full page.</p>
</li>
</ol>
<p><img src="/images/blog/verification-access.png" alt="Verification access view" /></p>
<center><i>This is what Verification Operators see when they open the link.</i></center>
<br />
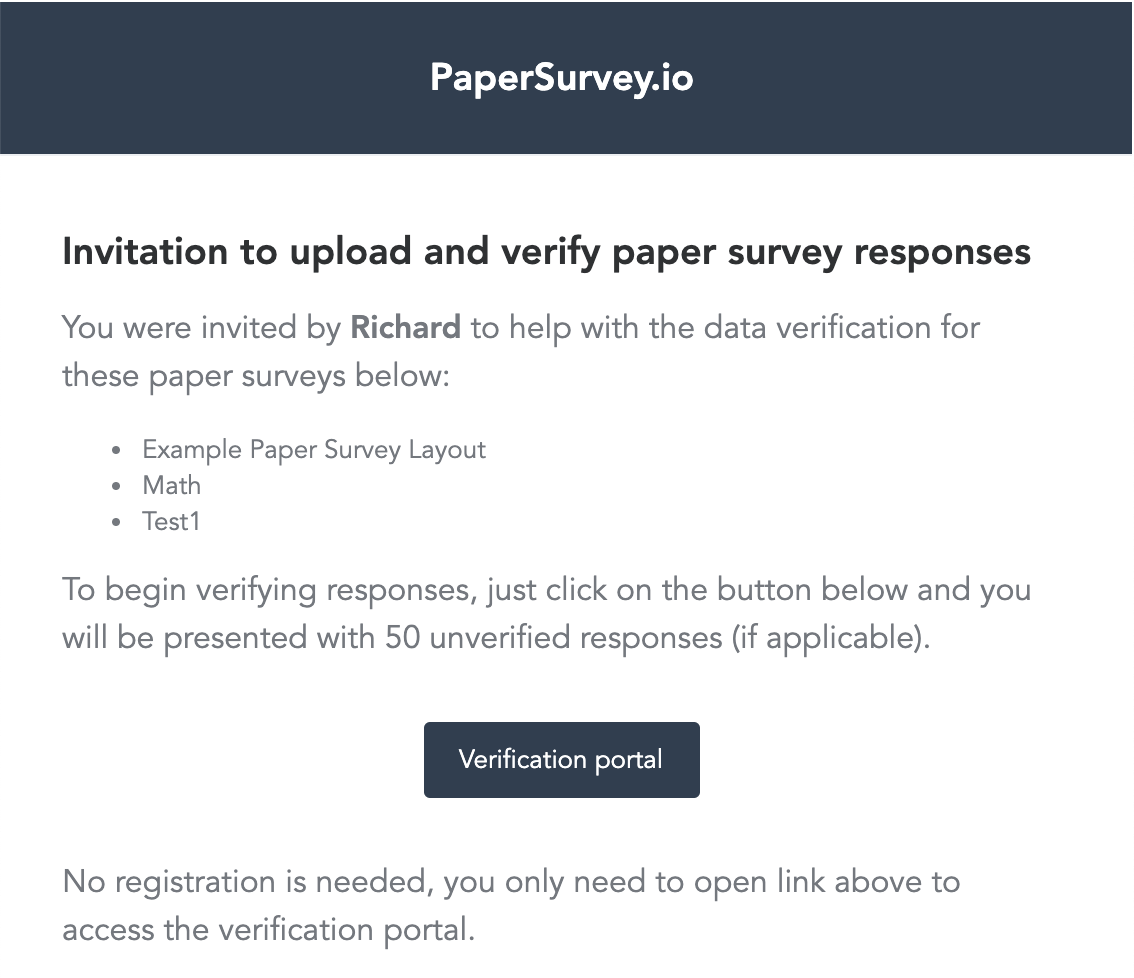
<p>Verification Operators do not need to register an account on <a href="https://papersurvey.io">papersurvey.io</a>. To begin verification, they only need to open an unguessable link sent to their email address.</p>
<p><img src="/images/blog/email-verification-access.png" alt="Verification operator email" /></p>
<center><i>Email sent to Verification Operator.</i></center>
<p>To get started, visit your <a href="/app/settings/team">team settings</a> and invite the people you need.</p>]]>

            </summary>
                                    <updated>2026-03-29T04:30:48+00:00</updated>
        </entry>
            <entry>
            <title><![CDATA[Multi-Column Paper Survey Layouts]]></title>
            <link rel="alternate" href="https://www.papersurvey.io/help/form-design/article/multi-column-paper-survey-layout" />
            <id>https://www.papersurvey.io/5</id>
            <author>
                <name><![CDATA[PaperSurvey.io]]></name>
            </author>
            <summary type="html">
                <![CDATA[<p>When your survey contains many short questions, a single-column layout can waste paper and make the form feel unnecessarily long. Multi-column layouts let you arrange questions side by side, making better use of the page and creating a more compact, respondent-friendly form.</p>
<h2>Creating multi-column layouts</h2>
<ol>
<li>
<p><strong>Add a Multi Column question type</strong></p>
<ul>
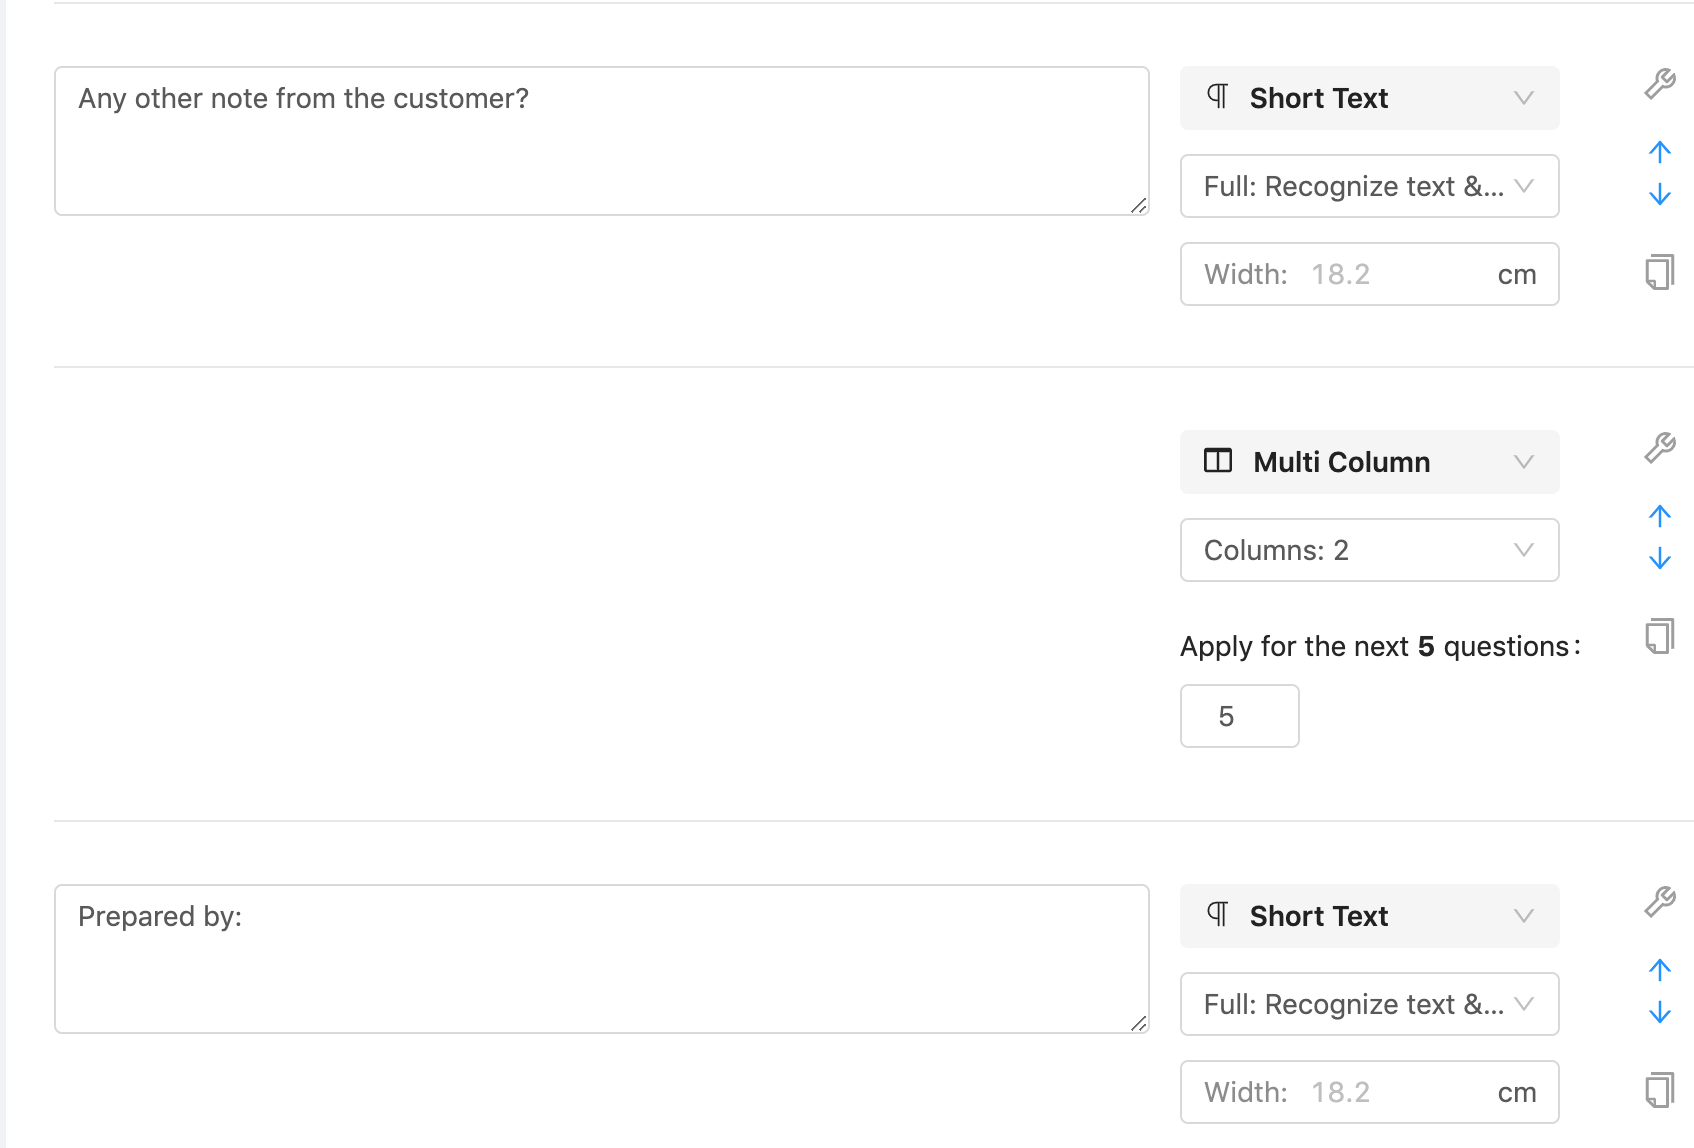
<li>Click "Add new question" in the survey builder</li>
<li>Select <strong>"Multi Column"</strong> from the question types</li>
<li>This creates a container for your columned questions</li>
</ul>
<p><img src="/images/blog/designer-multicolumn.png" alt="Multi-Column Survey Designer" /></p>
</li>
<li>
<p><strong>Configure your columns</strong></p>
<ul>
<li>Choose the number of columns, from 2 to 5</li>
<li>Set how many of the following questions the layout applies to, using the "Apply for the next N questions" field. You may enter 1000 to include all of the questions in the multi-column layout.</li>
<li>Questions automatically flow into the specified column layout</li>
</ul>
<p><img src="/images/blog/paper-multicolumn.png" alt="Multi-Column Question Type" /></p>
</li>
<li>
<p><strong>Fine-tune the layout (optional)</strong></p>
<ul>
<li><strong>Column widths</strong> can stay equal, follow a ratio preset such as 2 : 1, or use custom relative values per column</li>
<li><strong>Placement</strong> can be switched from Automatic to Manual to control exactly which questions land in which column</li>
<li>The <strong>Center</strong> switch centers the content of the columns</li>
</ul>
</li>
</ol>
<h2>Best use cases</h2>
<p>Multi-column layouts work best for:</p>
<ul>
<li>Yes/No questions</li>
<li>Short demographic questions</li>
<li>Checkbox lists with brief labels</li>
<li>Rating scales with few options</li>
<li>Quick screening questions</li>
</ul>
<h2>Design considerations</h2>
<ul>
<li><strong>Keep questions short.</strong> Long text breaks the column flow.</li>
<li><strong>Use consistent question types.</strong> Mixing types can look cluttered.</li>
<li><strong>Test readability.</strong> Ensure text remains legible when compressed.</li>
<li><strong>Consider response space.</strong> Leave adequate room for handwritten answers.</li>
</ul>
<h2>Making it work</h2>
<p>Preview your layout before printing to catch any issues. Group related questions in the same multi-column section, and reserve standard single-column layout for complex questions that need more space. Balancing visual density with respondent ease ensures your survey remains approachable.</p>
<p>Multi-column layouts can reduce your survey from multiple pages to a single sheet, saving printing costs and improving completion rates.</p>]]>

            </summary>
                                    <updated>2026-07-17T12:49:14+00:00</updated>
        </entry>
            <entry>
            <title><![CDATA[How to Handle Blank and Instruction Pages]]></title>
            <link rel="alternate" href="https://www.papersurvey.io/help/recognition/article/ignore-blank-pages-from-scanned-documents" />
            <id>https://www.papersurvey.io/6</id>
            <author>
                <name><![CDATA[PaperSurvey.io]]></name>
            </author>
            <summary type="html">
                <![CDATA[<p>When scanning batches of paper surveys, your documents often include pages that should not be processed, such as blank backs, cover sheets, or instruction pages. PaperSurvey provides both automatic blank-page detection and a manual IGNORE marker system so you can keep your scanning workflow efficient without generating unnecessary errors.</p>
<h2>Automatic blank page detection</h2>
<p>The system automatically removes truly blank pages during processing. Pages with visible marks or notes are kept and flagged for review to ensure no data is accidentally lost.</p>
<p>Pages are kept (rather than discarded) when they contain:</p>
<ul>
<li>Handwritten notes or marks</li>
<li>Stray pen marks or scribbles</li>
<li>Coffee stains or shadows</li>
<li>Poor scan quality creating artifacts</li>
</ul>
<p>Skipped pages appear in the "Skipped" count on your survey's Uploads page and do not count towards your processed pages. If a real page was skipped because the scan came out too light, rescan it with a darker scanner setting and upload it again.</p>
<h2>Including instruction or cover pages</h2>
<p>Many surveys include additional pages such as cover sheets with study information, instruction pages for participants, consent forms, or reference materials. You can include these pages in your scans without triggering processing errors by using the IGNORE marker system.</p>
<h2>How to mark pages to ignore</h2>
<h3>Method 1: Add the IGNORE QR code manually</h3>
<p>Add this QR code to any page you want to exclude from processing:</p>
<p><img src="https://www.papersurvey.io/number/IGNORE" alt="qr code" /></p>
<p><strong>Placement options:</strong></p>
<ul>
<li>Bottom-right corner (recommended)</li>
<li>Top-left corner</li>
</ul>
<p>When the system detects this QR code, the page is automatically skipped without generating errors.</p>
<h3>Example with IGNORE code</h3>
<p><img src="/images/blog/example-cover-page.png" alt="Cover page with QR code" /></p>
<h3>Method 2: Add a cover page in settings</h3>
<p>For a cover page that prints with every copy of your survey:</p>
<ol>
<li>Go to Survey Settings and find the Cover Page section</li>
<li>Click "Upload Cover Page PDF" and select your PDF file</li>
<li>Keep the "Include QR code" option enabled (it is on by default)</li>
<li>The system automatically adds the IGNORE code</li>
</ol>
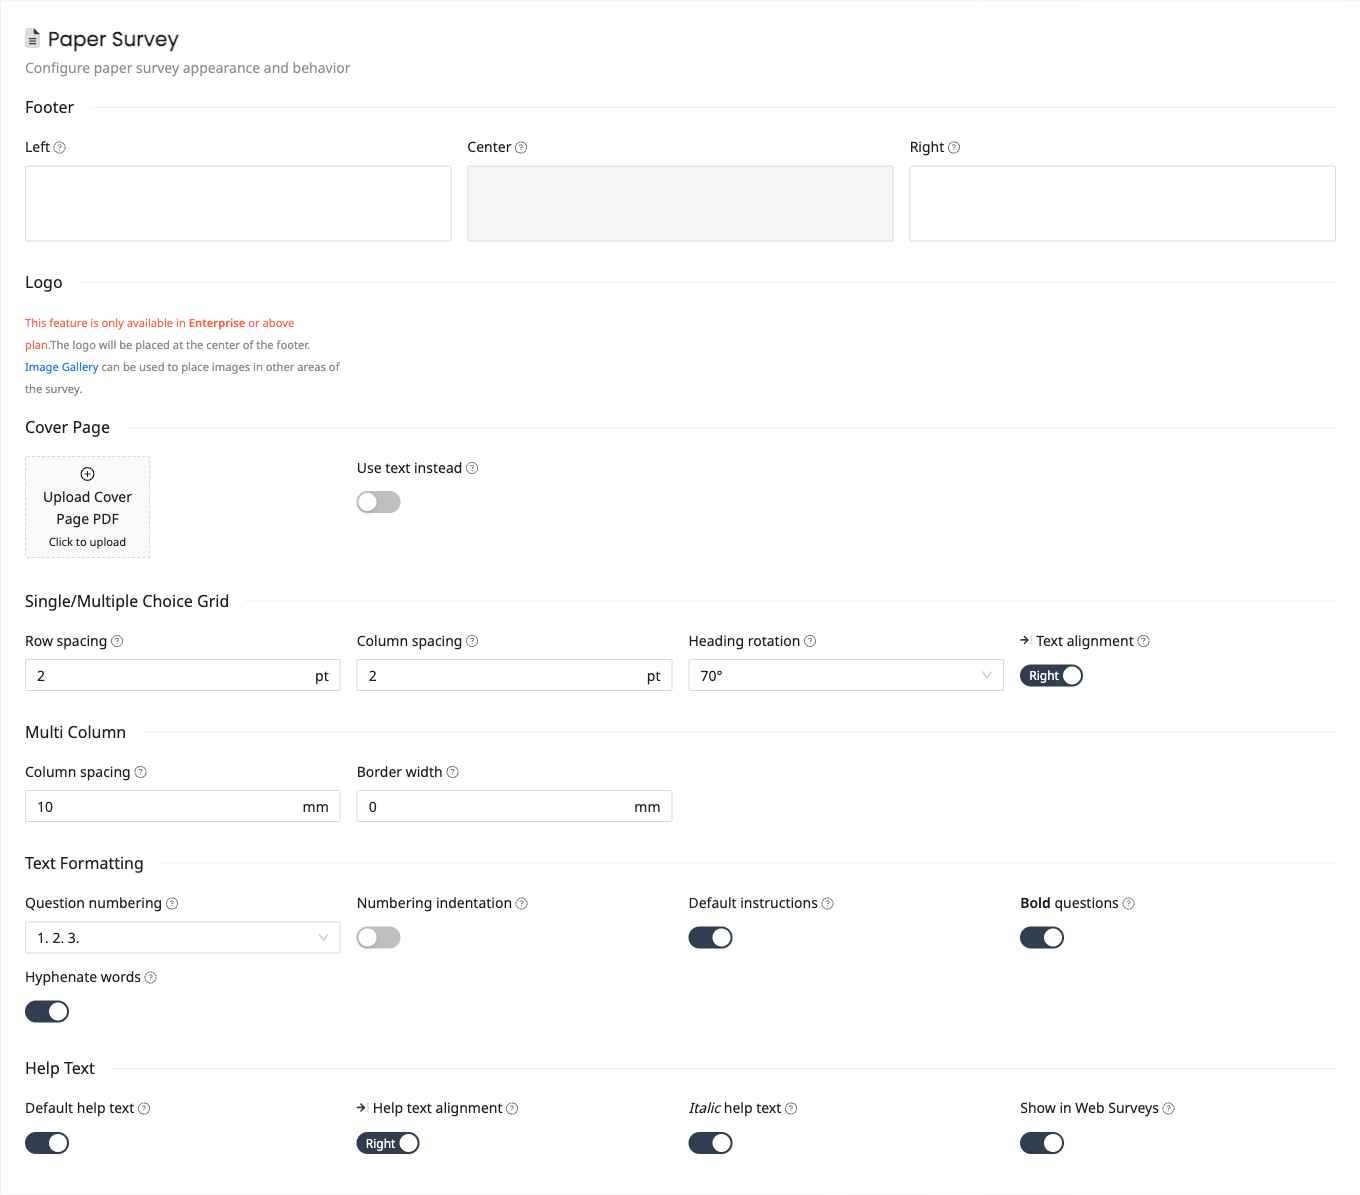
<p>If you prefer not to upload a PDF, enable "Use text instead" to write the cover page contents directly. The text cover prints as the first page without corner marks or footers, and the IGNORE code is added the same way.</p>
<p><img src="/images/blog/survey-settings-page.png" alt="Automatic cover page generation" /></p>
<p>This approach ensures consistent formatting across all copies, places the IGNORE code automatically, excludes cover pages from processing, and eliminates the need for manual QR code placement.</p>
<h2>Common issues and solutions</h2>
<p><strong>Instruction pages generating errors:</strong> Add the IGNORE QR code before scanning.</p>
<p><strong>Mixed single/double-sided scanning:</strong> IGNORE codes help manage blank reverse sides automatically.</p>
<p>Test your setup with a small batch first, ensure QR codes are clearly visible after printing, and train staff on which pages should have IGNORE codes. This system gives you complete control over which pages are processed while maintaining efficient batch scanning workflows.</p>]]>
            </summary>
                                    <updated>2026-07-18T07:29:35+00:00</updated>
        </entry>
            <entry>
            <title><![CDATA[What File Formats Are Supported for Scanning?]]></title>
            <link rel="alternate" href="https://www.papersurvey.io/help/recognition/article/supported-scanning-formats" />
            <id>https://www.papersurvey.io/7</id>
            <author>
                <name><![CDATA[PaperSurvey.io]]></name>
            </author>
            <summary type="html">
                <![CDATA[<p>Choosing the right file format and scanner settings has a significant impact on recognition accuracy and upload speed. PaperSurvey accepts several common file formats, with PDF being the recommended choice for the best overall results.</p>
<h2>Supported formats</h2>
<ul>
<li><strong>PDF (.pdf)</strong> - Recommended</li>
<li><strong>JPEG (.jpg/.jpeg)</strong> - Common for single pages</li>
<li><strong>PNG (.png)</strong> - Good for high-quality scans</li>
<li><strong>TIFF (.tiff/.tif)</strong> - Professional scanning</li>
<li><strong>HEIC (.heic)</strong> - iPhone photos</li>
<li><strong>HEIF (.heif)</strong> - Modern mobile photos</li>
</ul>
<h2>Recommended format: PDF</h2>
<p>PDF is the preferred format because it combines multiple pages into a single file, compresses efficiently for faster uploads, maintains quality while reducing file size, and works universally across all scanners.</p>
<h2>Optimal scanning settings</h2>
<p>For the best recognition results, use these settings:</p>
<h3>Resolution</h3>
<ul>
<li><strong>300 DPI</strong> (dots per inch) is the sweet spot</li>
<li>Higher resolution will not improve accuracy</li>
<li>Lower resolution may cause recognition errors</li>
</ul>
<h3>Color mode</h3>
<ul>
<li><strong>Grayscale</strong> or <strong>Black &amp; White</strong></li>
<li>Color scanning is unnecessary and increases file size</li>
<li>Grayscale handles lighter marks better than pure black/white</li>
</ul>
<h3>File format</h3>
<ul>
<li><strong>PDF</strong> with compression enabled</li>
<li>Multi-page document mode</li>
<li>Automatic page size detection</li>
</ul>
<h2>Example scanner configuration</h2>
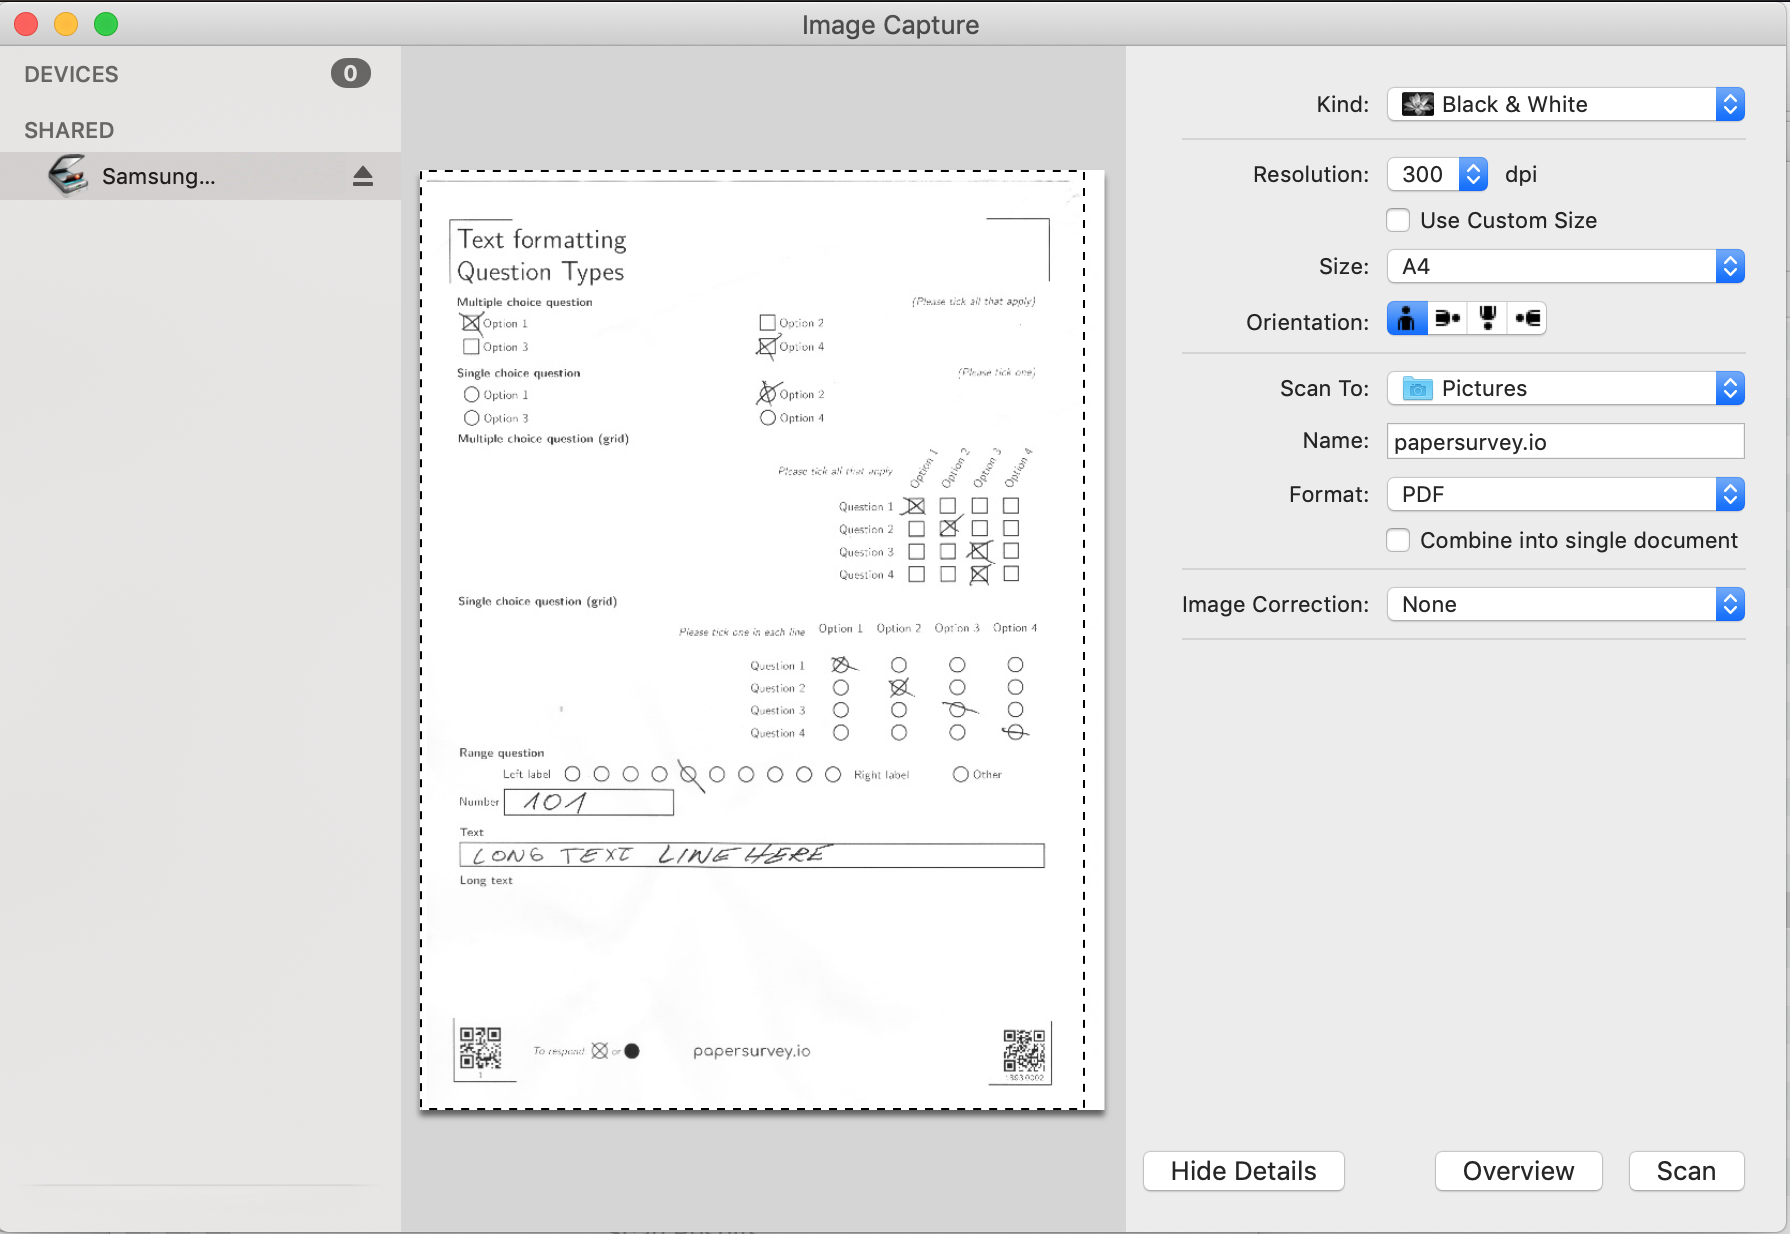
<p>Here is how optimal settings look in Image Capture (macOS):</p>
<p><img src="/images/blog/scanning-settings-image-capture.png" alt="Image Capture (macOS)" /></p>
<h2>Format comparison</h2>
<table>
<thead>
<tr>
<th>Format</th>
<th>Multi-page</th>
<th>File size</th>
<th>Upload speed</th>
<th>Best for</th>
</tr>
</thead>
<tbody>
<tr>
<td>PDF</td>
<td>Yes</td>
<td>Small</td>
<td>Fast</td>
<td>All surveys (recommended)</td>
</tr>
<tr>
<td>TIFF</td>
<td>Yes</td>
<td>Large</td>
<td>Slow</td>
<td>Archival quality</td>
</tr>
<tr>
<td>JPEG</td>
<td>No</td>
<td>Medium</td>
<td>Medium</td>
<td>Single pages</td>
</tr>
<tr>
<td>PNG</td>
<td>No</td>
<td>Large</td>
<td>Slow</td>
<td>High detail</td>
</tr>
<tr>
<td>HEIC/HEIF</td>
<td>No</td>
<td>Small</td>
<td>Fast</td>
<td>iPhone and mobile photos</td>
</tr>
</tbody>
</table>
<h2>Common scanning mistakes</h2>
<h3>Wrong settings</h3>
<ul>
<li><strong>Too high resolution</strong> (600+ DPI) wastes space without improving accuracy</li>
<li><strong>Color scanning</strong> triples file size unnecessarily</li>
<li><strong>No compression</strong> creates huge files that slow down uploads</li>
</ul>
<h3>File handling</h3>
<ul>
<li><strong>Mixed formats</strong> cause inconsistency; stick to one format per batch</li>
<li><strong>Huge files</strong> are rejected; the maximum size is 512MB per file</li>
</ul>
<p>You can upload all pages in a single multi-page PDF, or upload each page as a separate file. Both work equally well. Page orientation does not matter either; pages can be scanned in landscape, portrait, or even upside down, as long as all four corner marks are visible and the content is legible.</p>
<h2>Scanner-specific guidance</h2>
<h3>Office multifunction printers</h3>
<ul>
<li>Look for the "Scan to PDF" option</li>
<li>Enable multi-page mode</li>
<li>Use the document feeder for batch scanning</li>
</ul>
<h3>Desktop scanners</h3>
<ul>
<li>Install manufacturer software for full PDF support</li>
<li>Configure default settings for consistency</li>
<li>Clean the glass regularly</li>
</ul>
<h3>Mobile scanning</h3>
<ul>
<li>Use dedicated scanning apps (not the camera)</li>
<li>Ensure good, even lighting</li>
<li>Check PDF export options before uploading</li>
</ul>
<h2>Other ways to upload</h2>
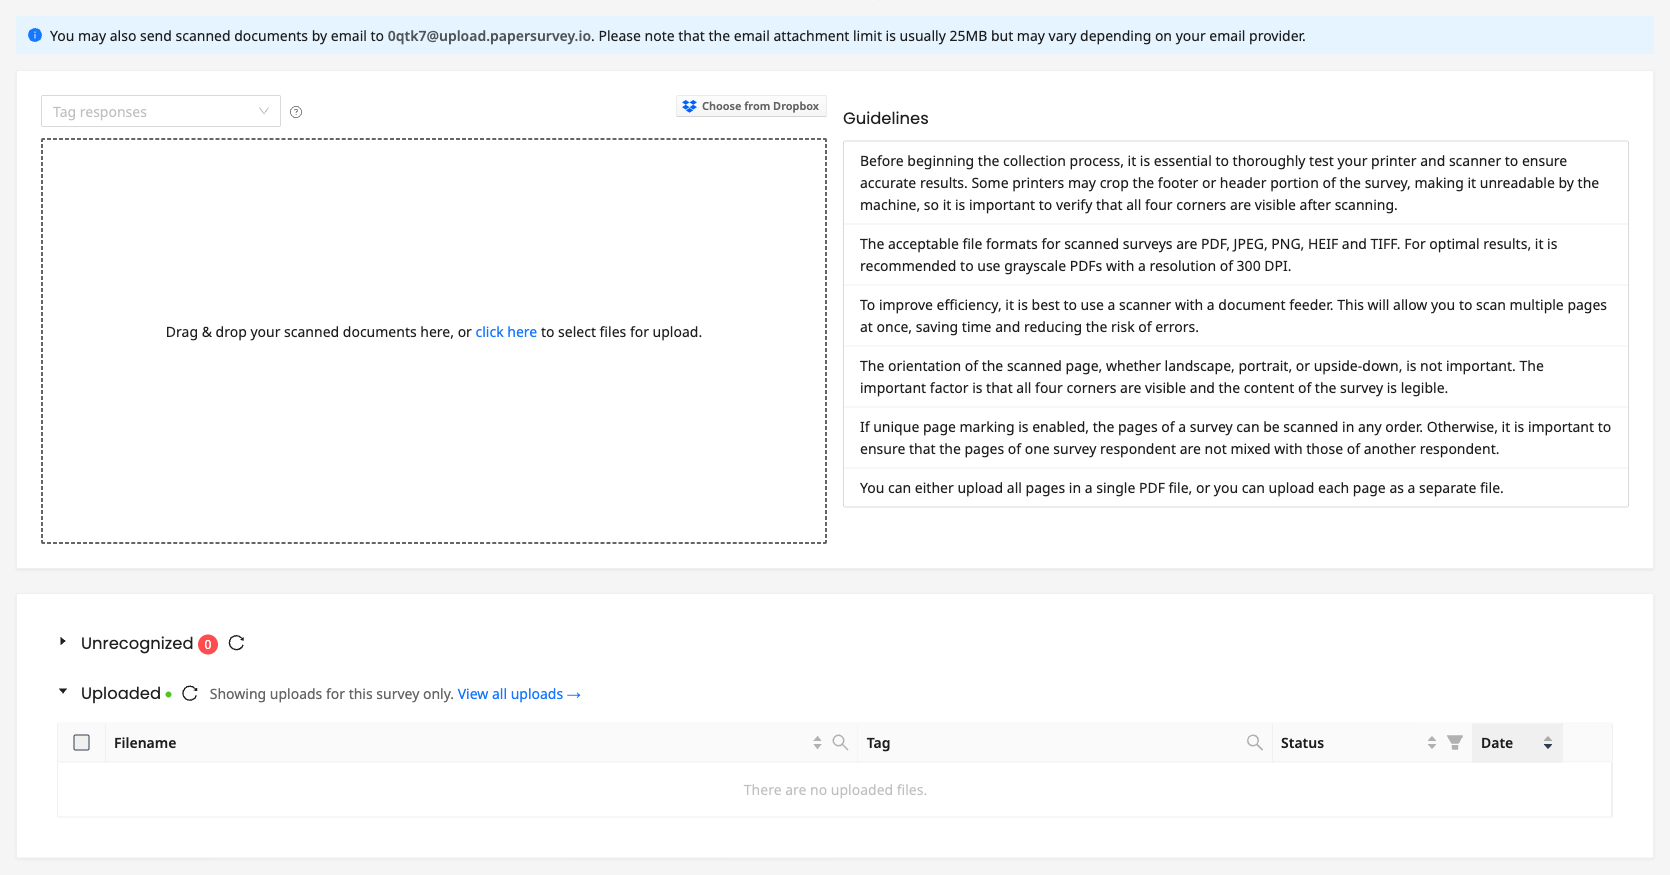
<p>Besides dragging files onto the Uploads page, you can email scanned documents to your team's dedicated upload address shown on the Uploads page. Email providers usually limit attachments to about 25MB, so large batches are better uploaded directly. You can also pick files straight from Dropbox using the Dropbox button on the Uploads page.</p>
<p>By following these format guidelines, you will achieve optimal recognition accuracy while minimizing upload times and storage costs.</p>]]>
            </summary>
                                    <updated>2026-07-18T07:29:35+00:00</updated>
        </entry>
            <entry>
            <title><![CDATA[Text Recognition Modes in PaperSurvey]]></title>
            <link rel="alternate" href="https://www.papersurvey.io/help/form-design/article/text-recognition-modes" />
            <id>https://www.papersurvey.io/8</id>
            <author>
                <name><![CDATA[PaperSurvey.io]]></name>
            </author>
            <summary type="html">
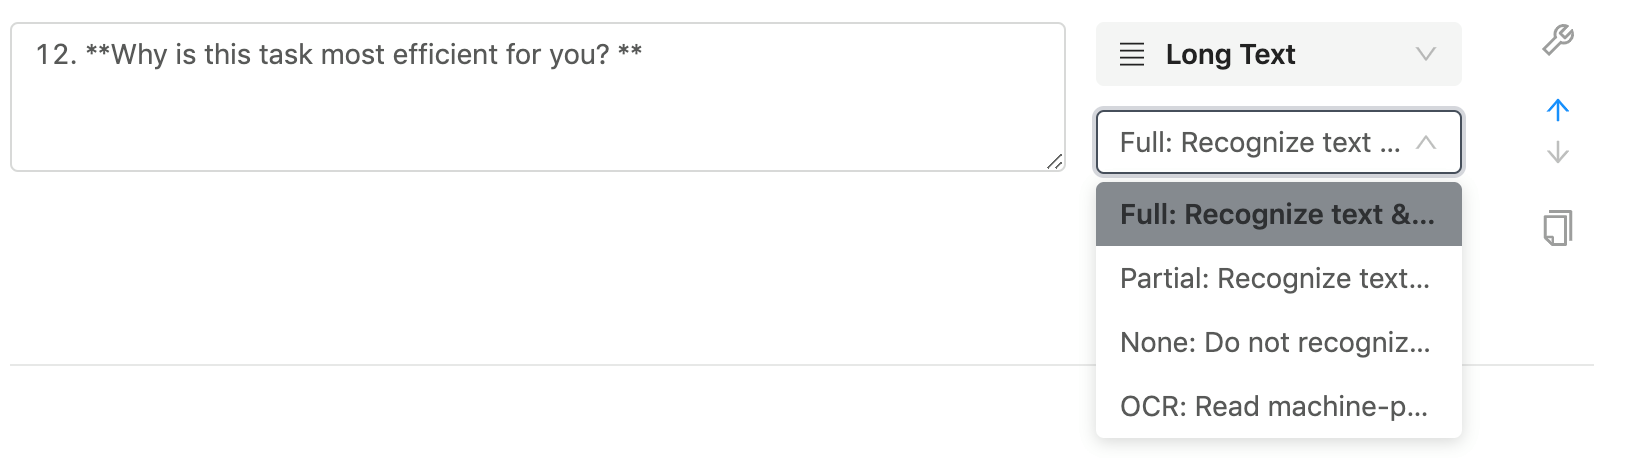
                <![CDATA[<p>Not every text field in a survey needs the same level of processing. Some fields contain critical data that must be verified character by character, while others hold optional comments that only need a quick scan. PaperSurvey offers eight recognition modes so you can balance accuracy, verification effort, and processing limits for each field individually.</p>
<p><img src="/images/blog/text-recognition-modes.png" alt="Text recognition modes" /></p>
<h2>Text recognition modes</h2>
<h3>Good accuracy</h3>
<p>The recommended mode for longer text fields. PaperSurvey recognizes handwritten text and automatically accepts responses where confidence is above 90%. Responses below that threshold are flagged for your review.</p>
<p>This strikes the best balance between automation and accuracy. Confident responses are handled automatically, and you only spend time verifying the uncertain ones.</p>
<p>This is the default mode for Long Text fields.</p>
<p>This mode is not ideal for short, high-value fields like names, email addresses, or ID numbers. A 90% confidence threshold means that roughly 1 in 10 characters could be wrong in auto-accepted responses. For a comment or paragraph of feedback, a minor misread is usually acceptable. For a name or email address, a single wrong character makes the data unusable. Use 100% accuracy for those fields instead.</p>
<p><strong>Best for:</strong> Open-ended feedback, comment fields, and general survey text fields where minor recognition errors are acceptable.</p>
<h3>Verify always</h3>
<p>PaperSurvey recognizes the text but flags every response for manual verification, regardless of confidence level. Unlike Manual mode, text is still recognized automatically, which means the recognized text is pre-filled when you verify, saving you from typing each response from scratch.</p>
<p><strong>Best for:</strong> Fields where every response must be reviewed by a person but you still want recognition to speed up the verification process.</p>
<h3>100% accuracy</h3>
<p>The strictest mode for fields where every character matters. PaperSurvey recognizes handwritten text but only auto-accepts responses where the system is 100% confident. Everything else is flagged for manual verification.</p>
<p>This is the default mode for Short Text and Email fields. Expect more responses to land in your verification queue with this mode. Encourage respondents to WRITE IN CAPITAL LETTERS for better recognition accuracy.</p>
<p><strong>Best for:</strong> Names, email addresses, ID numbers, codes, and any field where a single wrong character would cause problems.</p>
<h3>Custom accuracy</h3>
<p>This mode lets you set your own confidence threshold for auto-acceptance. Responses above your chosen percentage are accepted automatically, while those below are flagged for review.</p>
<p>The threshold defaults to 90% and can be set to 70%, 80%, 90%, 95%, or 97%. Lower thresholds mean fewer items to verify but more potential errors. Higher thresholds mean more manual review but greater accuracy.</p>
<p><strong>Best for:</strong> Situations where the default 90% threshold does not match your accuracy requirements, or when you want fine-grained control over the automation balance.</p>
<h3>Recognize, never flag</h3>
<p>PaperSurvey recognizes the text and accepts all responses automatically, regardless of confidence level. No responses are flagged for verification.</p>
<p>This is the fastest option when you need results quickly and can tolerate some recognition errors.</p>
<p><strong>Best for:</strong> High-volume surveys where speed matters more than catching every error, supplementary comment fields, and preliminary analysis.</p>
<h3>No recognition</h3>
<p>Skips text extraction entirely. Responses are accepted as blank, though the original handwriting remains visible in scanned images.</p>
<p><strong>Best for:</strong> Optional comment fields you do not plan to analyze, surveys where only quantitative data matters, and fields where you want to preserve your recognition quota.</p>
<h3>Manual</h3>
<p>Skips automatic recognition and flags every response for manual entry. You type each response yourself while viewing the scanned image.</p>
<p>This mode does not count against your recognition limits, making it useful when you have exceeded your monthly quota or when handwriting is too complex for automated recognition.</p>
<p><strong>Best for:</strong> Complex handwriting styles, fields requiring human interpretation, and situations where you have reached your recognition limit.</p>
<h3>OCR (machine-printed text)</h3>
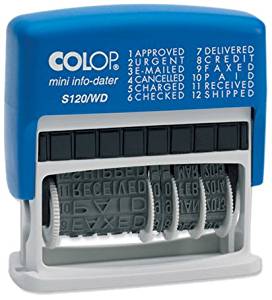
<p>A specialized mode that reads only machine-printed characters. It ignores handwritten content entirely and uses optical character recognition optimized for typed or printed text.</p>
<p><strong>Best for:</strong> Pre-filled form fields, date stamps, info-daters, printed label stickers, and any field containing machine-generated text.</p>
<p><img src="/images/blog/info-dater.jpeg" alt="Info-dater example" /></p>
<h2>Number and date recognition</h2>
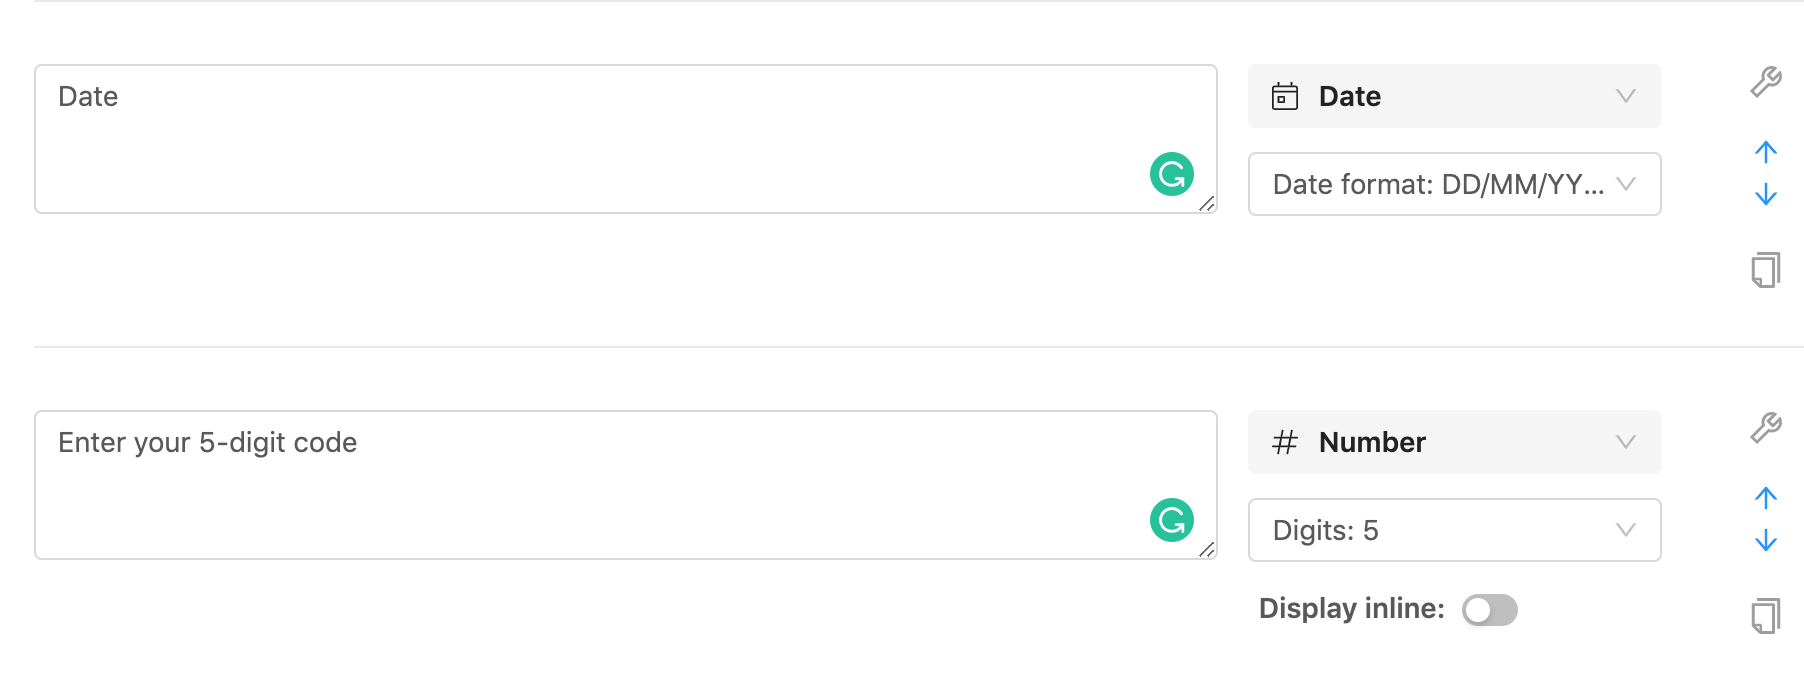
<p>Number and Date question types use specialized digit recognition optimized for handwritten numerals. This technology is separate from general text recognition and delivers significantly higher accuracy. Number fields only read digits. If your identifier contains a mix of numbers and letters, use a Short Text field instead.</p>
<p><img src="/images/blog/date-and-number-question-type.png" alt="Date and number question types" /></p>
<p><strong>Key advantages:</strong></p>
<ul>
<li>Much higher accuracy than general text recognition</li>
<li>Does not count against handwriting recognition limits</li>
<li>Automatic validation for dates</li>
<li>Minimal verification needed</li>
</ul>
<h3>Best practices for number fields</h3>
<p><strong>Recommended: Fixed digit boxes.</strong> Specify the maximum number of digits expected (up to 20). This provides individual boxes for each digit and delivers the highest recognition accuracy. A free-form option without digit boxes is available but is much less accurate, so it is not recommended. Number fields can also add two decimal places with the Decimal setting.</p>
<p><img src="/images/blog/number-fields.png" alt="Number fields with boxes" /></p>
<h2>Changing modes on existing surveys</h2>
<p>When you change the recognition mode for a field that already has processed responses, PaperSurvey re-evaluates all existing responses against the new threshold. Responses that were previously flagged may be automatically accepted, and responses that were previously accepted may be flagged for review.</p>
<p>You will see a preview of how many responses will be affected before confirming the change. You can also choose to save the new mode for future responses only, leaving existing data untouched. Responses you have already verified manually are never changed by a re-evaluation.</p>
<h2>Choosing the right mode</h2>
<p>Long text fields default to <strong>Good accuracy</strong> and email fields default to <strong>100% accuracy</strong>. These defaults handle the majority of cases well. From there, adjust based on your needs:</p>
<ol>
<li><strong>Data criticality.</strong> Switch to 100% accuracy for fields where every character matters.</li>
<li><strong>Volume.</strong> Use Recognize, never flag when processing thousands of responses and speed is the priority.</li>
<li><strong>Recognition limits.</strong> Choose Manual or No recognition to preserve your monthly quota for the fields that matter most.</li>
<li><strong>Response type.</strong> Select OCR for machine-printed text instead of handwriting.</li>
<li><strong>Fine-tuning.</strong> Use Custom accuracy when 90% is not quite the right threshold for your use case.</li>
<li><strong>Mandatory review.</strong> Use Verify always when every response needs human review but you still want recognition to pre-fill answers.</li>
</ol>
<h2>Monthly recognition limits</h2>
<p>Text recognition counts against monthly limits, while number and date recognition is unlimited. Limits reset on your billing cycle, and using Manual or No recognition modes preserves your quota for the fields where automated recognition provides the most value.</p>]]>
            </summary>
                                    <updated>2026-07-18T07:29:35+00:00</updated>
        </entry>
            <entry>
            <title><![CDATA[How to Change Your Email Address]]></title>
            <link rel="alternate" href="https://www.papersurvey.io/help/account-settings/article/how-to-change-email-address" />
            <id>https://www.papersurvey.io/9</id>
            <author>
                <name><![CDATA[PaperSurvey.io]]></name>
            </author>
            <summary type="html">
                <![CDATA[<p>Your email address serves as your primary login credential and the main point of contact for your PaperSurvey account. If you need to update it, our support team will handle the change securely on your behalf.</p>
<p>To get started, send a request to <a href="mailto:support@papersurvey.io">support@papersurvey.io</a>. For security purposes, you must send this request from the email address currently registered on your account.</p>
<h2>What happens next</h2>
<p>Once we receive your request, our support team will:</p>
<ul>
<li><strong>Verify your account ownership</strong></li>
<li><strong>Process the email change</strong></li>
<li><strong>Send confirmation</strong> to both your old and new email addresses</li>
<li><strong>Update your account</strong> within 5 business days</li>
</ul>
<p>If you no longer have access to your registered email address, please include additional details in your support request so we can verify your identity through alternative means.</p>]]>
            </summary>
                                    <updated>2026-03-29T04:30:48+00:00</updated>
        </entry>
            <entry>
            <title><![CDATA[How to Invite Users to Your Account]]></title>
            <link rel="alternate" href="https://www.papersurvey.io/help/account-settings/article/inviting-users-to-your-account" />
            <id>https://www.papersurvey.io/10</id>
            <author>
                <name><![CDATA[PaperSurvey.io]]></name>
            </author>
            <summary type="html">
                <![CDATA[<p>PaperSurvey supports team collaboration, allowing you to invite colleagues to access your surveys and data. This feature is available with Enterprise and Enterprise Plus subscription plans, and it gives you fine-grained control over what each team member can do. The Enterprise plan includes up to 5 user accounts, while each Enterprise Plus unit includes 15 user accounts.</p>
<h2>Adding team members</h2>
<p>To invite users to your account:</p>
<ol>
<li>Navigate to your <a href="/app/settings/team">Team Settings</a></li>
<li>Click <strong>Invite User</strong></li>
<li>Enter their email address</li>
<li>Select an appropriate role</li>
<li>Send the invitation</li>
</ol>
<p>Only the team owner and managers can send invitations. The invited user will receive an email with instructions to join your team. If they don't have a PaperSurvey account, they'll be prompted to create one. Invitations expire after two weeks; you can resend or cancel pending invites from the Team Settings page.</p>
<p><img src="/images/blog/team-settings.png" alt="My team settings" /></p>
<center><i>Team management interface showing current members and roles</i></center>
<h2>Available user roles</h2>
<p>PaperSurvey offers five distinct roles to match your team's needs:</p>
<h3>Owner</h3>
<ul>
<li>Full control over the account</li>
<li>Can do everything including billing management</li>
<li>Only one owner per team</li>
</ul>
<h3>Manager</h3>
<ul>
<li>Similar to owner but without billing access</li>
<li>Can invite and remove team members</li>
<li>Can view activity logs</li>
<li>Can manage all surveys and settings</li>
</ul>
<h3>Standard User</h3>
<ul>
<li>Can create, edit, and delete surveys</li>
<li>Can view and export all response data</li>
<li>Can manage survey settings and templates</li>
<li>No access to billing or team management</li>
</ul>
<h3>Operator</h3>
<ul>
<li>Can generate copies to print</li>
<li>Can upload new documents</li>
<li>Can verify responses</li>
<li>Can view and export data</li>
<li>Cannot create, edit, or delete surveys</li>
<li>Can only delete uploads they created</li>
</ul>
<h3>Limited Access</h3>
<ul>
<li>Read-only access to survey data</li>
<li>Can view responses and analytics</li>
<li>Can export data for analysis</li>
<li>Cannot upload, verify, or modify anything</li>
</ul>
<h2>Alternative: Response verification access</h2>
<p>If you need help verifying survey responses without granting full account access, consider using our dedicated verification feature. This allows external users to review and validate responses without seeing other account data. <a href="/help/scanning/article/how-can-multiple-users-verify-responses">Learn more about verification access</a>.</p>
<h2>Managing your team</h2>
<p>You can manage team members at any time from the Team Settings page. From there you can remove users who no longer need access, change user roles as responsibilities shift, see which members have two-factor authentication enabled, and set up new teams for different projects. Managers and owners can also review the audit log of team activity from Settings.</p>
<p>Need to upgrade your plan to enable team features? Visit your <a href="/app/settings/subscription">subscription settings</a> or contact <a href="mailto:support@papersurvey.io">support@papersurvey.io</a> for assistance.</p>]]>
            </summary>
                                    <updated>2026-07-17T12:49:14+00:00</updated>
        </entry>
            <entry>
            <title><![CDATA[Duplicating Surveys]]></title>
            <link rel="alternate" href="https://www.papersurvey.io/help/form-design/article/survey-duplication" />
            <id>https://www.papersurvey.io/11</id>
            <author>
                <name><![CDATA[PaperSurvey.io]]></name>
            </author>
            <summary type="html">
                <![CDATA[<p>Creating a new survey from scratch when you already have a similar one is unnecessary work. Duplicating a survey creates an exact copy with all questions, settings, and formatting preserved, saving you significant time when building variations or new versions of existing forms.</p>
<h2>How to duplicate a survey</h2>
<ol>
<li>Open the survey you want to copy</li>
<li>Click on <strong>Survey Settings</strong> in the navigation</li>
<li>Scroll to the bottom of the settings page</li>
<li>Click the <strong>"Duplicate survey"</strong> button</li>
<li>In the dialog, adjust the name of the copy (it defaults to the original name with a "(Copy)" suffix) and choose where the copy should go</li>
<li>Click <strong>Duplicate</strong>. Your new copy will appear in your survey list</li>
</ol>
<p>The dialog lets you duplicate to the current folder, to one or more specific folders (a separate copy is created in each selected folder), or, if you manage more than one team, to a different team.</p>
<p>To copy several surveys at once, select them on your dashboard using the checkboxes and choose <strong>Bulk actions</strong>, then <strong>Duplicate</strong>. Each copy is created in the current folder with a "(Copy)" suffix.</p>
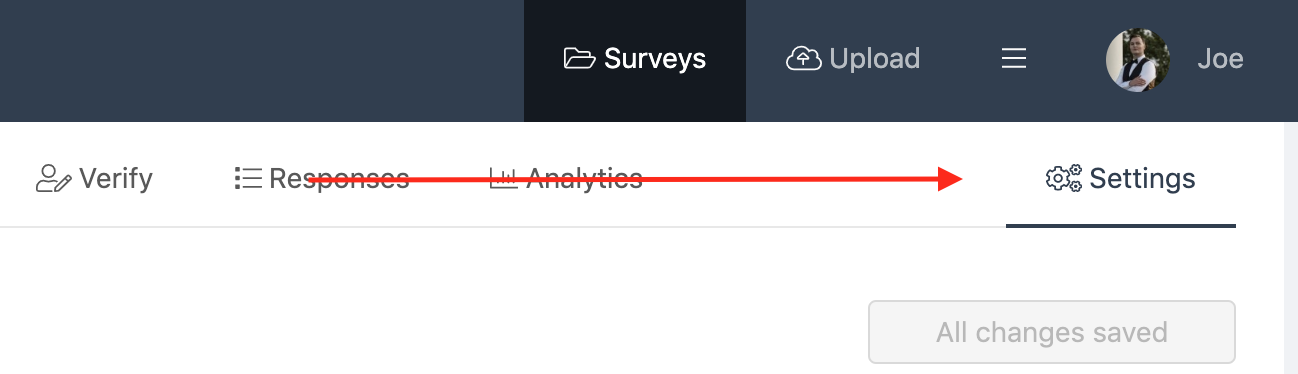
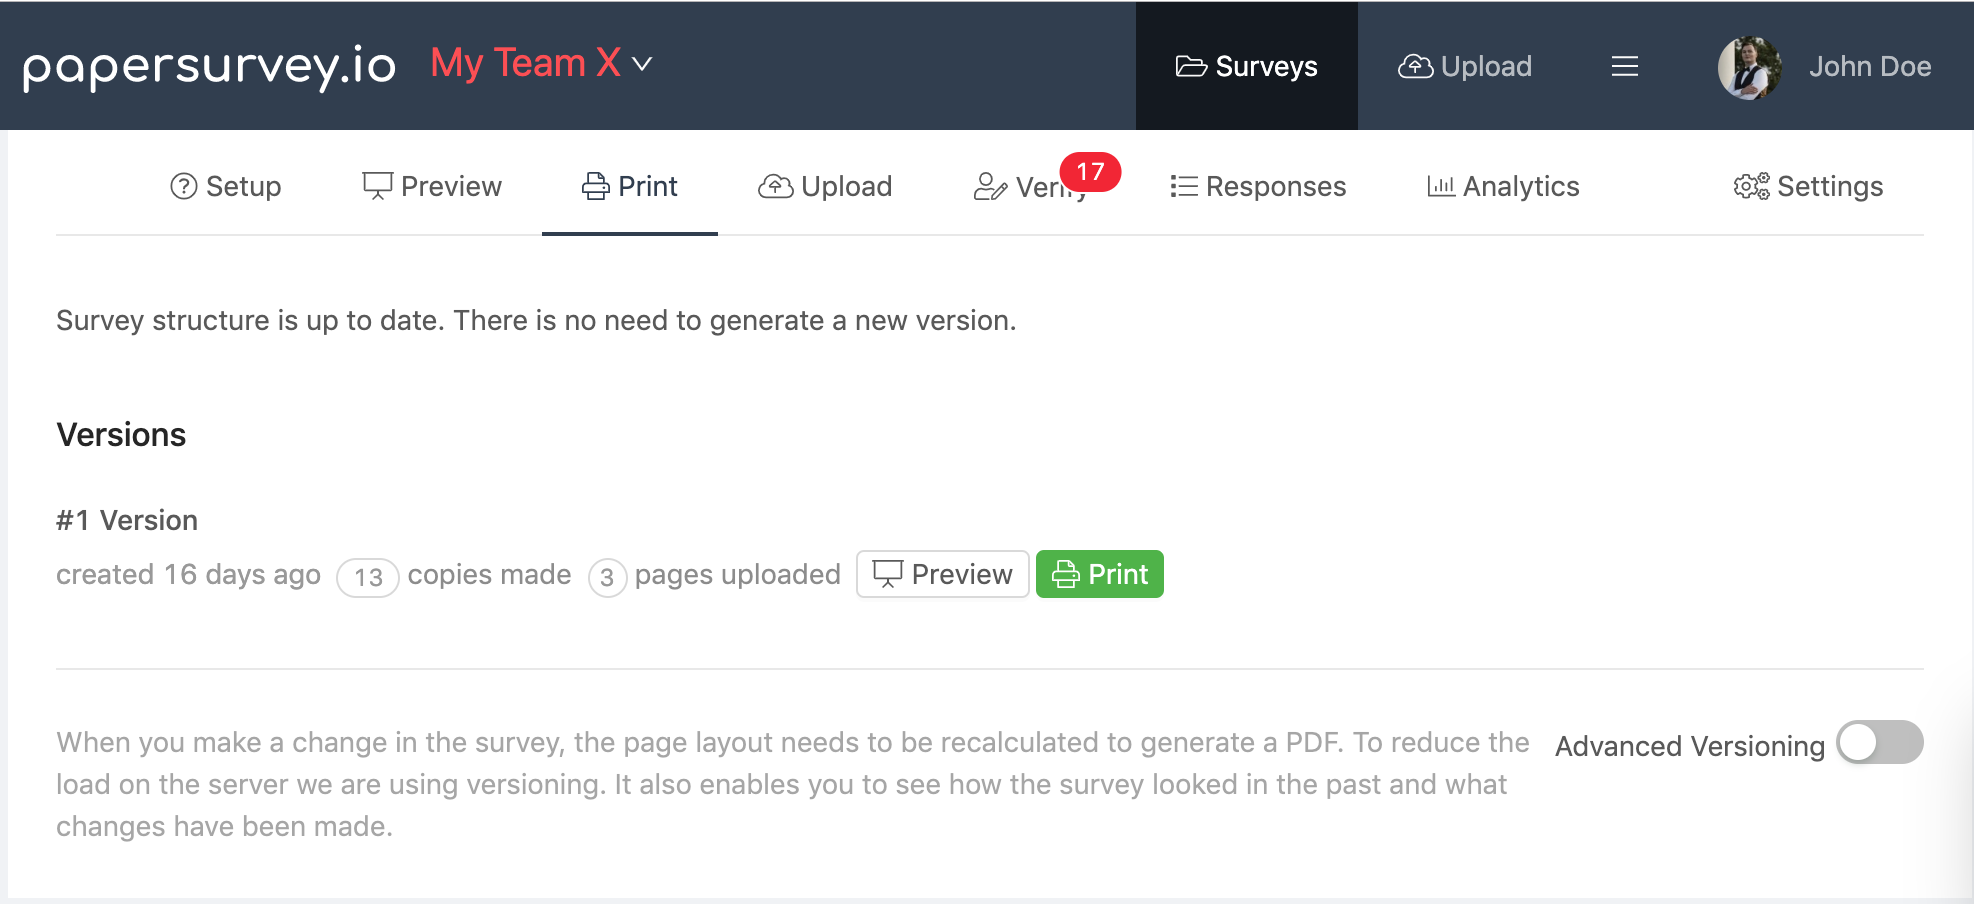
<p><img src="/images/blog/link-to-settings.png" alt="Survey settings location" />
<img src="/images/blog/duplicate-arrow.png" alt="Duplicate survey button" /></p>
<h2>What gets copied</h2>
<p>When you duplicate a survey, the following elements carry over:</p>
<ul>
<li>All questions and their settings</li>
<li>Page layouts and formatting</li>
<li>Custom branding and logos</li>
<li>Footer text and instructions</li>
<li>Language translations (if any)</li>
<li>Form settings and configurations</li>
<li>Webhooks (except Zapier connections)</li>
<li>Accepted Answers auto-verification rules</li>
<li>Analysis views and their widgets</li>
</ul>
<h2>What does not get copied</h2>
<ul>
<li>Collected responses and data</li>
<li>Uploaded scans</li>
<li>The Google Sheets connection (the copy starts disconnected; your column configuration is kept, so reconnecting restores the same columns)</li>
</ul>
<h2>Common use cases</h2>
<p><strong>Version control</strong>
Create survey versions for different time periods, archive old surveys before making changes, or test modifications without affecting the original.</p>
<p><strong>Template creation</strong>
Build a master survey template, then duplicate and customize it for different departments while maintaining consistent formatting across projects.</p>
<p><strong>Similar surveys</strong>
Reuse question sets for related research, create regional variations, or adapt surveys for different audiences.</p>]]>
            </summary>
                                    <updated>2026-07-18T07:29:35+00:00</updated>
        </entry>
            <entry>
            <title><![CDATA[What Is Advanced Versioning?]]></title>
            <link rel="alternate" href="https://www.papersurvey.io/help/printing/article/what-is-advanced-versioning" />
            <id>https://www.papersurvey.io/12</id>
            <author>
                <name><![CDATA[PaperSurvey.io]]></name>
            </author>
            <summary type="html">
                <![CDATA[<p>Advanced versioning allows you to create, manage, and track multiple versions of the same survey. This feature helps you distribute customized surveys to different locations, time periods, or audiences while maintaining all responses in a single dataset for unified analysis.</p>
<p><img src="/images/blog/advanced-versioning.png" alt="Advanced survey versioning interface" /></p>
<h2>Key Capabilities of Advanced Versioning</h2>
<p>With advanced versioning enabled, you can take advantage of several powerful features.</p>
<h3>Label Each Version</h3>
<p>Assign meaningful names to different versions (e.g., "Boston Office", "Chicago Office", "Remote Workers") for easy identification and analysis.</p>
<h3>Print Any Version</h3>
<p>Unlike standard mode where only the latest version prints, advanced versioning lets you print any previous version whenever needed.</p>
<h3>Track Version Usage</h3>
<p>Every response is tagged with its version name, allowing you to filter and analyze data by version.</p>
<h2>When to Use Advanced Versioning</h2>
<p>Advanced versioning solves specific distribution and analysis challenges.</p>
<h3>Location-Based Distribution</h3>
<p>Deploy different versions to various sites while keeping all data together:</p>
<ul>
<li>Retail chains tracking store-specific feedback</li>
<li>Multi-campus educational institutions</li>
<li>Healthcare facilities with multiple locations</li>
<li>Event feedback across different venues</li>
</ul>
<h3>A/B Testing</h3>
<p>Test different question wordings or survey flows:</p>
<ul>
<li>Compare response rates between versions</li>
<li>Evaluate which phrasing gets better data quality</li>
<li>Test short vs. detailed survey formats</li>
</ul>
<h3>Time-Based Studies</h3>
<p>Track how responses change over time:</p>
<ul>
<li>"January 2024 Version", "February 2024 Version"</li>
<li>Seasonal variations in customer feedback</li>
<li>Pre/during/post intervention studies</li>
</ul>
<h3>Customized Content</h3>
<p>Maintain consistent questions with location-specific details:</p>
<ul>
<li>Restaurant names in satisfaction surveys</li>
<li>Department names in employee surveys</li>
<li>Product names in user feedback</li>
</ul>
<h2>How Advanced Versioning Works</h2>
<h3>Setup Process</h3>
<ol>
<li>Create your base survey</li>
<li>Turn on the <strong>Advanced Versioning</strong> switch on the survey's <strong>Print</strong> page</li>
<li>Click <strong>Create new version</strong> and give it an optional label</li>
<li>Make changes and create additional versions</li>
<li>Each version gets its own print option</li>
</ol>
<h3>Version Management</h3>
<ul>
<li><strong>Version list</strong>: See all versions with creation dates</li>
<li><strong>Active editing</strong>: Only modify the latest version</li>
<li><strong>Print history</strong>: See how many copies were made and pages uploaded for each version</li>
<li><strong>Version preview</strong>: Open a preview of any version to see exactly how it looked</li>
</ul>
<h2>Real-World Examples</h2>
<h3>Example 1: Restaurant Chain Feedback</h3>
<p>A restaurant chain needs location-specific surveys:</p>
<ul>
<li><strong>Version 1</strong>: "Downtown Location", includes parking questions</li>
<li><strong>Version 2</strong>: "Mall Location", includes shopping experience questions</li>
<li><strong>Version 3</strong>: "Airport Location", includes travel-related questions</li>
</ul>
<p>All responses feed into one dataset with location tags.</p>
<h3>Example 2: Training Evaluation</h3>
<p>A training company runs different course lengths:</p>
<ul>
<li><strong>Version 1</strong>: "Full Course (5 days)", comprehensive evaluation</li>
<li><strong>Version 2</strong>: "Short Course (2 days)", focused on core modules only</li>
</ul>
<p>Both versions share core questions but have length-appropriate additions.</p>
<h3>Example 3: Product Feedback Evolution</h3>
<p>A software company refines their feedback form:</p>
<ul>
<li><strong>Version 1</strong>: "Beta Launch", detailed technical questions</li>
<li><strong>Version 2</strong>: "Public Launch", simplified for general users</li>
<li><strong>Version 3</strong>: "Post-Update", includes new feature questions</li>
</ul>
<p>Historical data remains accessible across all versions.</p>
<h2>Important Considerations</h2>
<h3>Complexity Management</h3>
<p>Advanced versioning adds interface complexity. Enable it only when you genuinely need version tracking capabilities.</p>
<h3>Data Consistency</h3>
<p>While versions can differ, maintain core questions across versions for meaningful comparisons.</p>
<h3>Version Proliferation</h3>
<p>Too many versions can complicate analysis. Plan your versioning strategy before creating multiple variations.</p>
<h2>Technical Notes</h2>
<ul>
<li>Advanced versioning is <strong>disabled by default</strong> to keep the interface simple</li>
<li>All versions share the same question IDs for unified reporting</li>
<li>Version information exports with your data for external analysis</li>
<li>You cannot edit previous versions, only the current version</li>
</ul>
<h2>Should You Enable Advanced Versioning?</h2>
<p>Ask yourself:</p>
<ul>
<li>Do I need location or time-specific survey variations? Enable it.</li>
<li>Will I analyze results by version? Enable it.</li>
<li>Do I need to reprint older versions? Enable it.</li>
<li>Is my survey consistent across all distributions? Keep it disabled.</li>
</ul>
<p>Most users do not need advanced versioning. Enable it when you have a clear use case that requires tracking multiple survey variations within a single dataset.</p>]]>
            </summary>
                                    <updated>2026-07-18T07:29:35+00:00</updated>
        </entry>
            <entry>
            <title><![CDATA[How to Reset the Survey Page Counter]]></title>
            <link rel="alternate" href="https://www.papersurvey.io/help/recognition/article/how-to-reset-survey-page-counter" />
            <id>https://www.papersurvey.io/13</id>
            <author>
                <name><![CDATA[PaperSurvey.io]]></name>
            </author>
            <summary type="html">
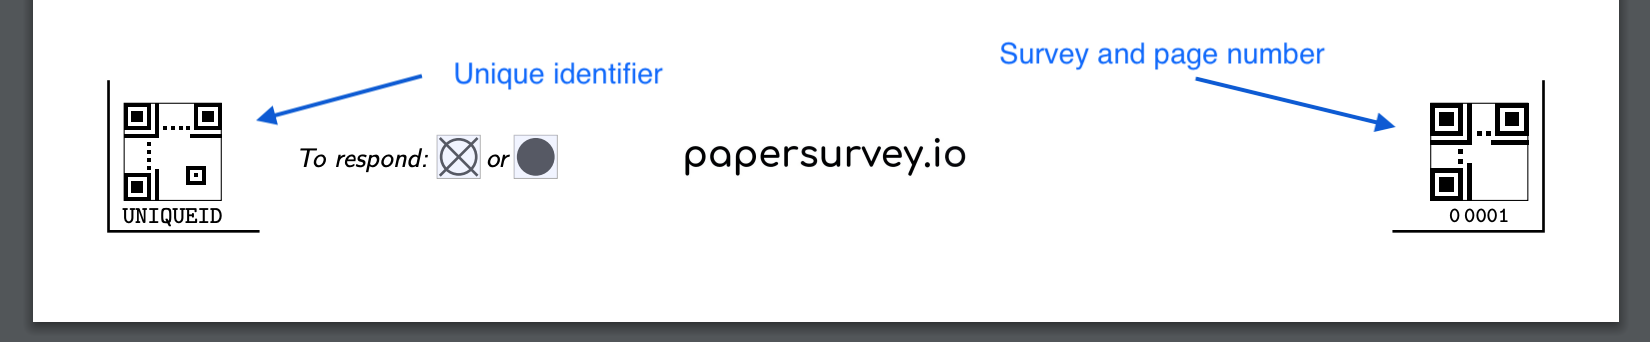
                <![CDATA[<p>PaperSurvey assigns unique page identifiers with a random prefix (like ABC_1, ABC_2) to each printed page. These identifiers do not automatically reset when you delete responses. This safety feature prevents accidental data mixing, but you may need to start fresh after a testing phase.</p>
<p><img src="/images/blog/paper-survey-unique-markings.png" alt="Unique page marks for paper surveys" /></p>
<h2>Understanding page identifiers</h2>
<p>PaperSurvey generates unique identifiers with a short random prefix (e.g., ABC<em>, XY2</em>) followed by sequential numbering starting from 1. A fresh prefix is suggested each time you generate prints, and you can change it in the "Identifier prefix" field. The prefix can contain letters, numbers, underscores, and dashes, up to 15 characters.</p>
<h2>Why identifiers do not auto-reset</h2>
<p>The identifiers remain sequential even after deleting responses. This prevents mixing test and production data, processing the same identifiers twice, and confusion when old printed copies resurface.</p>
<h2>When you need to reset</h2>
<p>Common scenarios that call for a counter reset include finishing a testing phase with sample prints, starting a new data collection round, fixing survey design after initial printing, or moving from a pilot to a full study.</p>
<h2>How to reset the counter</h2>
<h3>Easiest method: Use a new identifier prefix</h3>
<p>Each identifier prefix keeps its own numbering. When generating prints, enter a prefix you have not used before in the "Identifier prefix" field, and numbering for that prefix starts at 1 (e.g., NEW_1, NEW_2). Reusing an existing prefix continues where that prefix left off. On some older surveys numbering continues across prefixes; if that happens, duplicate the survey instead.</p>
<h3>For a completely clean slate: Duplicate the survey</h3>
<p>Duplicating the survey resets everything, including response data:</p>
<ol>
<li>Go to your survey list</li>
<li>Click the duplicate option for your survey</li>
<li>The new copy starts with the counter at 1</li>
<li>Archive or delete the original survey</li>
</ol>
<p>This method gives you a clean separation from test data.</p>
<h3>What gets reset</h3>
<p>When you duplicate a survey:</p>
<ul>
<li><strong>Page counter</strong> starts fresh at 1</li>
<li><strong>Prefix</strong> is suggested as a fresh random code on the next print run</li>
<li><strong>Unique identifiers</strong> begin a new series (e.g., XYZ_1)</li>
<li><strong>Response data</strong> does not carry over</li>
<li><strong>Survey settings</strong> are fully copied</li>
</ul>
<h3>What to do with old prints</h3>
<p>If you have printed copies with higher page numbers, destroy test prints to avoid confusion. Clearly mark any remaining copies as "TEST" and inform your team about the new survey version. You might also consider using a different paper color for new prints to make the distinction obvious.</p>]]>
            </summary>
                                    <updated>2026-07-18T07:29:35+00:00</updated>
        </entry>
            <entry>
            <title><![CDATA[Can I Fold or Staple Paper Surveys?]]></title>
            <link rel="alternate" href="https://www.papersurvey.io/help/recognition/article/can-i-fold-or-staple-paper-surveys" />
            <id>https://www.papersurvey.io/15</id>
            <author>
                <name><![CDATA[PaperSurvey.io]]></name>
            </author>
            <summary type="html">
                <![CDATA[<p>Distributing paper surveys by mail often means folding or stapling pages together. Both practices are perfectly acceptable, but each requires careful handling to ensure your scans process correctly and your scanning equipment stays in good shape.</p>
<h2>Folding paper surveys</h2>
<p>Folding is generally safe, though fold lines can occasionally interfere with recognition accuracy. A few simple precautions will help you avoid problems.</p>
<h3>Best practices for folding</h3>
<ul>
<li><strong>Use minimal folds.</strong> One fold is usually enough for standard envelopes. Multiple folds increase the risk of recognition errors.</li>
<li><strong>Avoid checkbox areas.</strong> Never fold through multiple-choice checkboxes. Fold lines can be misinterpreted as checked responses.</li>
<li><strong>Keep folds away from text areas.</strong> Folds through handwritten text can cause the text to be read as a continuous line.</li>
</ul>
<p><img src="/images/blog/folded-paper.png" alt="staple paper forms" /></p>
<center><i>Example of a folded page - notice the visible fold line</i></center>
<h3>What happens with fold lines</h3>
<p>Most fold lines are automatically ignored during processing. However, if a fold crosses through response areas, you may need to manually verify those responses. This is especially important for:</p>
<ul>
<li>Multiple-choice questions where folds might register as selections</li>
<li>Text fields where folds can flag empty text areas for manual review</li>
</ul>
<p><img src="/images/blog/text-area-folded.png" alt="paperform folding" /></p>
<center><i>Fold through text area - may require manual correction</i></center>
<h2>Stapling paper surveys</h2>
<p><img src="/images/blog/stapling-page.jpg" alt="staple paper forms" /></p>
<p>While stapling keeps pages organized, it requires extra steps before scanning.</p>
<h3>Important stapling guidelines</h3>
<ul>
<li><strong>Always remove staples before scanning.</strong> Staples can damage scanner mechanisms and leave marks that interfere with recognition.</li>
<li><strong>Preserve corner marks.</strong> When removing staples, be careful not to tear the corner marks. At least 3 of 4 corner marks must be intact for recognition.</li>
<li><strong>Consider alternatives.</strong> Paper clips are safer than staples. They are easier to remove and do not leave permanent marks.</li>
</ul>
<h3>Recommended approach</h3>
<ol>
<li>Use paper clips instead of staples when possible</li>
<li>If you must staple, use a proper staple remover (not scissors)</li>
<li>Check that all corner marks remain visible after staple removal</li>
<li>Scan immediately after removing staples to prevent pages from separating</li>
</ol>
<h2>Setting yourself up for success</h2>
<p>Before committing to a large print run, test your folding method with a sample survey first. Train staff on proper staple removal techniques, and consider printing on heavier paper stock to minimize fold damage. Keeping a backup of unfolded surveys is also a good safeguard.</p>
<p>By following these guidelines, you will maintain high recognition accuracy while efficiently managing your paper survey distribution.</p>]]>
            </summary>
                                    <updated>2026-03-29T04:30:48+00:00</updated>
        </entry>
            <entry>
            <title><![CDATA[Getting Started with PaperSurvey]]></title>
            <link rel="alternate" href="https://www.papersurvey.io/help/form-design/article/overview-video-paper-survey-io" />
            <id>https://www.papersurvey.io/16</id>
            <author>
                <name><![CDATA[PaperSurvey.io]]></name>
            </author>
            <summary type="html">
                <![CDATA[<p>The fastest way to understand what PaperSurvey can do is to see it in action. This overview video walks through the entire workflow, from designing your first survey to exporting digital results.</p>
<center><iframe width="560" height="315" src="https://www.youtube.com/embed/0El-1jHOyEU" frameborder="0" allow="accelerometer; autoplay; encrypted-media; gyroscope; picture-in-picture" allowfullscreen></iframe></center>
<h2>What you will learn</h2>
<p>This video demonstrates:</p>
<ul>
<li>Creating and designing paper surveys</li>
<li>Setting up different question types</li>
<li>Printing survey forms</li>
<li>Scanning and uploading completed surveys</li>
<li>Automatic data extraction with OCR</li>
<li>Viewing and exporting results</li>
</ul>
<h2>Video highlights</h2>
<ul>
<li><strong>0:00</strong> Introduction and overview of PaperSurvey capabilities</li>
<li><strong>1:30</strong> Survey Creation, building your first survey</li>
<li><strong>3:45</strong> Question Types, including multiple choice, text, grids, and more</li>
<li><strong>5:20</strong> Printing, generating print-ready PDFs</li>
<li><strong>6:50</strong> Scanning Process, best practices for scanning</li>
<li><strong>8:30</strong> Data Processing, how OCR extracts responses</li>
<li><strong>10:15</strong> Results &amp; Export, accessing your digital data</li>
</ul>]]>
            </summary>
                                    <updated>2026-03-29T04:30:48+00:00</updated>
        </entry>
            <entry>
            <title><![CDATA[Question Types Available in PaperSurvey]]></title>
            <link rel="alternate" href="https://www.papersurvey.io/help/form-design/article/question-types-and-examples" />
            <id>https://www.papersurvey.io/17</id>
            <author>
                <name><![CDATA[PaperSurvey.io]]></name>
            </author>
            <summary type="html">
                <![CDATA[<p>PaperSurvey offers a comprehensive set of question types designed for paper-based data collection. Each type is optimized for accurate OCR recognition and easy respondent completion. Understanding the available options helps you choose the right format for every question in your survey.</p>
<h2>Selection questions</h2>
<h3>Single choice</h3>
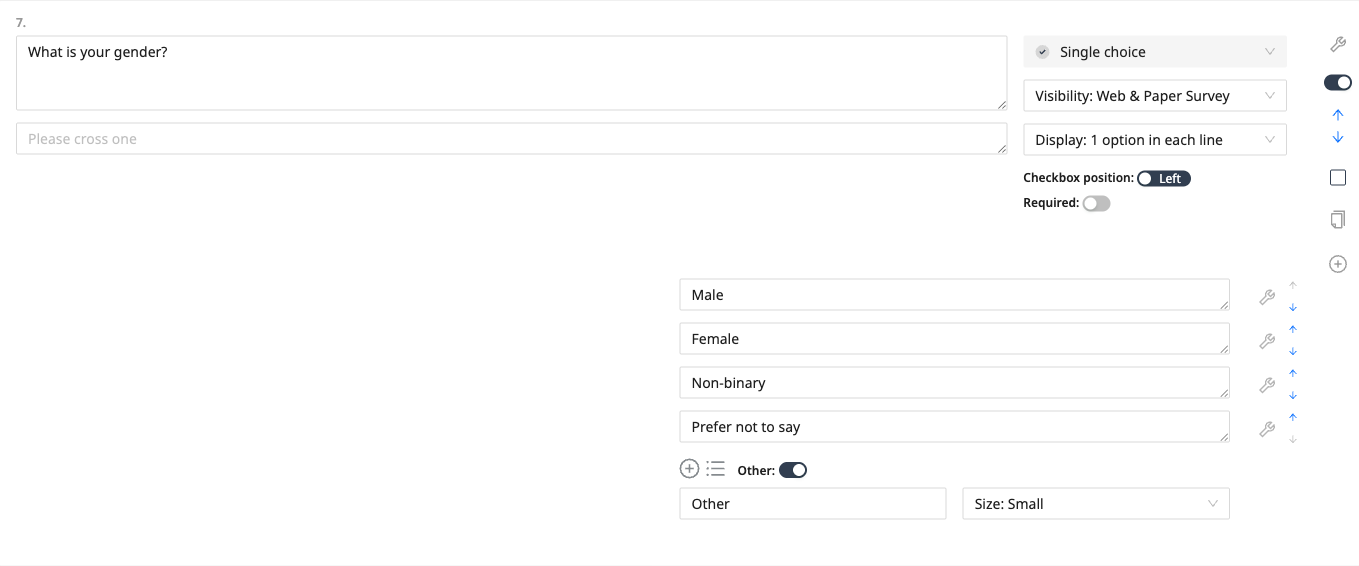
<p>Respondents select one answer from multiple options. The system flags entries with multiple selections for review.</p>
<p><img src="/images/help/question-types/single-choice.png" alt="Single choice question type" /></p>
<p><strong>Best for:</strong> Yes/No questions, gender selection, single preferences</p>
<h3>Multiple choice</h3>
<p>Allows selection of one or more answers. You can set maximum selection limits if needed.</p>
<p><img src="/images/help/question-types/multiple-choice.png" alt="Multiple choice question type" /></p>
<p><strong>Best for:</strong> "Select all that apply" questions, interest areas, service preferences</p>
<h3>Range</h3>
<p>Respondents mark their position on a scale between two endpoints.</p>
<p><img src="/images/help/question-types/range.png" alt="Range question type" /></p>
<p><strong>Best for:</strong> Satisfaction scales, agreement levels, frequency indicators</p>
<h3>NPS (Net Promoter Score)</h3>
<p>A specialized 0-10 scale with automatic NPS calculation built in.</p>
<p><img src="/images/help/question-types/nps.png" alt="NPS question type" /></p>
<p><strong>Best for:</strong> Customer loyalty measurement, recommendation likelihood</p>
<h3>Discrete choice (conjoint)</h3>
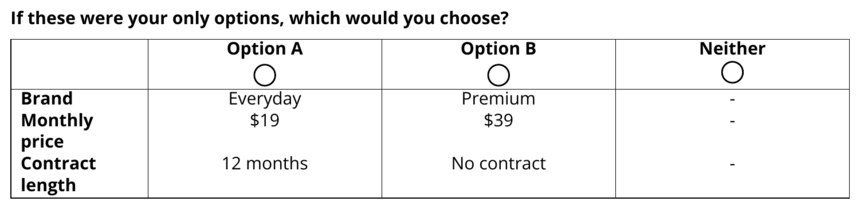
<p>Presents a set of alternatives described by a shared list of attributes and asks respondents to pick the one they prefer. Each alternative is a column, each attribute is a row, and respondents mark a single choice. Set it up by listing the attributes to compare and the alternatives with their values. To present several choice tasks, add a separate discrete choice question for each one.</p>
<p><img src="/images/help/question-types/discrete-choice.png" alt="Discrete choice question type" /></p>
<p><strong>Best for:</strong> Trade-off and preference research, product concept testing, pricing and feature comparisons</p>
<h2>Grid questions</h2>
<h3>Single choice grid</h3>
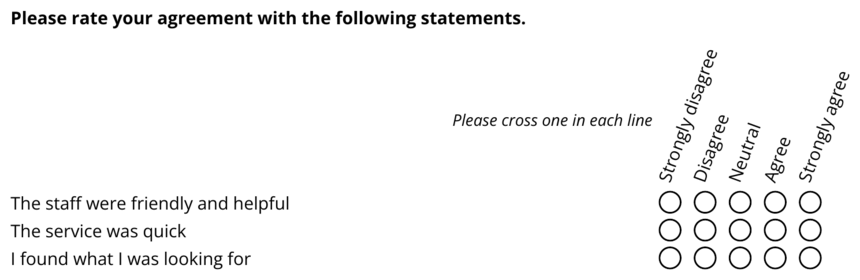
<p>Multiple questions share the same answer options, with one selection allowed per row.</p>
<p><img src="/images/help/question-types/single-choice-grid.png" alt="Single choice grid question type" /></p>
<p><strong>Best for:</strong> Likert scales, feature ratings, comparative evaluations</p>
<h3>Multiple choice grid</h3>
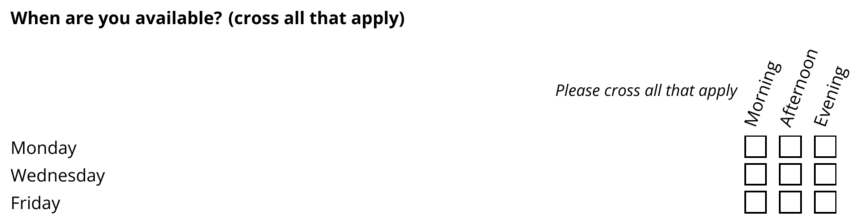
<p>Multiple questions allowing multiple selections per row.</p>
<p><img src="/images/help/question-types/multiple-choice-grid.png" alt="Multiple choice grid question type" /></p>
<p><strong>Best for:</strong> Feature usage matrices, availability schedules, preference grids</p>
<h3>Before/After Table</h3>
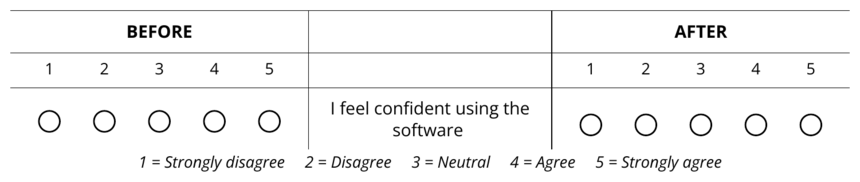
<p>Each row shows a statement in the middle with the same rating scale on both the left and the right, so respondents rate every item under two conditions in one compact grid. Set it up by defining the shared rating scale once, adding each statement as a row, and labeling the two sides.</p>
<p><img src="/images/help/question-types/before-after-table.png" alt="Before and after table question type" /></p>
<p><strong>Best for:</strong> Before and after comparisons, then vs now retrospective ratings, expectation vs experience, importance vs performance</p>
<h3>MaxDiff (best and worst)</h3>
<p>A best/worst scaling table. Each row is an item to evaluate, with a choice column on each side, such as "Most important" on the left and "Least important" on the right. Respondents pick exactly one item per side, and the same item cannot be marked as both. Set it up by listing the items to compare and naming the two side labels. MaxDiff works best with 3 to 6 items per block; for longer lists, add a separate MaxDiff question for each block.</p>
<p><strong>Best for:</strong> Prioritizing features or messages, importance research, forcing trade-offs that rating scales hide</p>
<h3>Ranking</h3>
<p>Respondents rank a list of items by marking one rank per item, using each rank only once. Ranking is a ready-made preset of the single choice grid: rank positions such as 1st, 2nd, and 3rd form the columns, and the items to rank form the rows. The preset also adds a helper line reminding respondents to use each rank only once.</p>
<p><strong>Best for:</strong> Preference ordering, prioritizing options, ranking candidates or ideas</p>
<h2>Text and number input</h2>
<h3>Number</h3>
<p>Numeric input with optional digit limits for structured data collection.</p>
<p><img src="/images/help/question-types/number.png" alt="Number question type" /></p>
<p><strong>Best for:</strong> Ages, quantities, IDs, phone numbers, postal codes</p>
<h3>Date</h3>
<p>Structured date entry with automatic validation.</p>
<p><img src="/images/help/question-types/date.png" alt="Date question type" /></p>
<p><strong>Best for:</strong> Birthdates, event dates, deadlines</p>
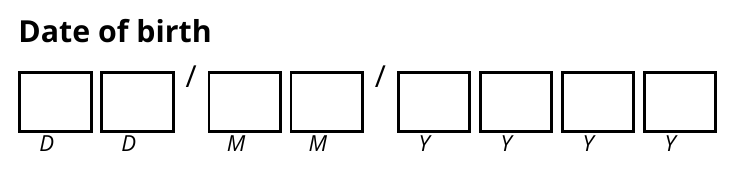
<h3>Date (day/month choice)</h3>
<p>A date entered by crossing day and month boxes rather than writing digits, read automatically via optical mark recognition.</p>
<p><img src="/images/help/question-types/date-choice.png" alt="Date day and month choice question type" /></p>
<p><strong>Best for:</strong> Dates where marking boxes is easier than writing, such as start months or day-of-week selection</p>
<h3>Email</h3>
<p>A text field validated as an email address, flagging entries that do not look like a valid address.</p>
<p><img src="/images/help/question-types/email.png" alt="Email question type" /></p>
<p><strong>Best for:</strong> Contact capture, follow-up permissions, newsletter sign-ups</p>
<h3>Postal code</h3>
<p>A field formatted for postal or ZIP codes, with country-specific formats and fixed digit layouts where applicable.</p>
<p><img src="/images/help/question-types/postal-code.png" alt="Postal code question type" /></p>
<p><strong>Best for:</strong> Addresses, catchment analysis, regional segmentation</p>
<h3>Barcode</h3>
<p>Reads a barcode or QR sticker (QR, Code 39, Code 128) placed within the field boundaries.</p>
<p><img src="/images/help/question-types/barcode.png" alt="Barcode question type" /></p>
<p><strong>Best for:</strong> Linking forms to inventory, assets, samples, or existing records</p>
<h3>Inline text and number inserts</h3>
<p>Advanced fields embedded directly inside a sentence or block of text, so a short text or number answer sits within your own wording rather than as a separate labeled question. These inserts are a paper feature; on the web survey the insert shows as a blank line within the sentence.</p>
<p><strong>Best for:</strong> Fill-in-the-blank phrasing, structured statements, custom inline responses</p>
<h3>Short text</h3>
<p>Single-line text input for brief responses.</p>
<p><img src="/images/help/question-types/short-text.png" alt="Short text question type" /></p>
<p><strong>Best for:</strong> Names, email addresses, brief answers</p>
<h3>Long text</h3>
<p>Multi-line text area for detailed responses.</p>
<p><img src="/images/help/question-types/long-text.png" alt="Long text question type" /></p>
<p><strong>Best for:</strong> Comments, feedback, explanations, suggestions</p>
<h3>Signature</h3>
<p>Captures signatures as images without any additional processing. On the web survey, respondents draw their signature directly on screen.</p>
<p><img src="/images/help/question-types/signature.png" alt="Signature question type" /></p>
<p><strong>Best for:</strong> Consent forms, agreements, authorization</p>
<h2>Layout elements</h2>
<h3>Heading</h3>
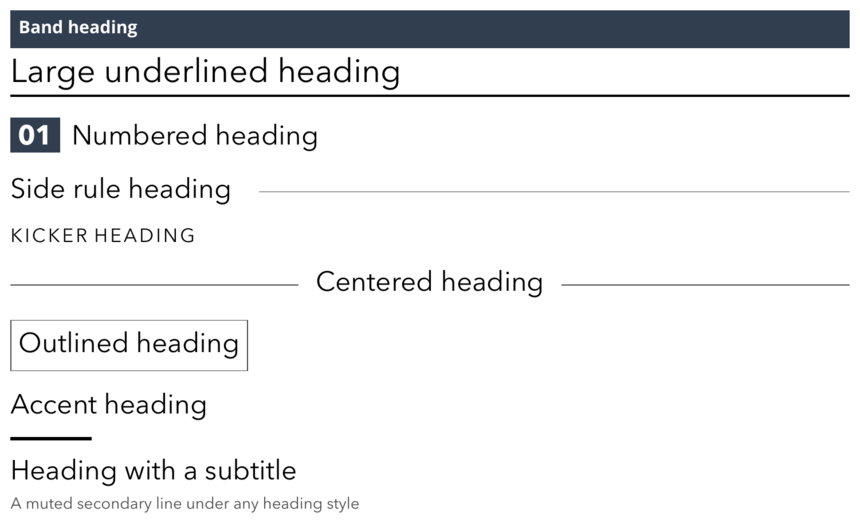
<p>Ten heading styles are available with customizable colors: four classic sizes including the filled band, plus numbered sections, side rules, uppercase kickers, centered titles with flanking rules, outlined frames, and short accent underlines. Any heading can also carry a muted subtitle line, and the boxless styles can draw a filled chip behind the text.</p>
<p><img src="/images/help/question-types/heading-styles.png" alt="Heading styles" /></p>
<p><strong>Best for:</strong> Section titles, instructions, grouping related questions</p>
<h3>Description</h3>
<p>A block of descriptive or instructional text that is not a question and collects no answer.</p>
<p><img src="/images/help/question-types/description.png" alt="Description element" /></p>
<p><strong>Best for:</strong> Instructions, context, consent wording, section introductions</p>
<h3>Box</h3>
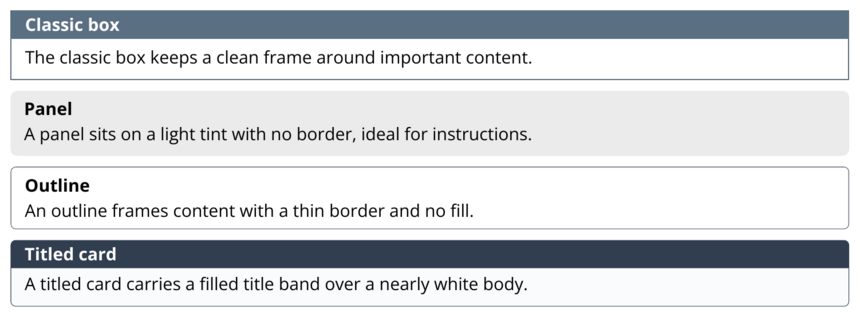
<p>A container that visually groups related content on the page, in four styles: the classic bordered box, a borderless tinted panel, a thin outline, and a titled card with a colored title band.</p>
<p><img src="/images/help/question-types/box-styles.png" alt="Box styles" /></p>
<p><strong>Best for:</strong> Highlighting a section, framing instructions, drawing attention</p>
<h3>Page break</h3>
<p>Forces content to start on a new page.</p>
<p><strong>Best for:</strong> Logical survey sections, keeping related questions together</p>
<h3>Divider</h3>
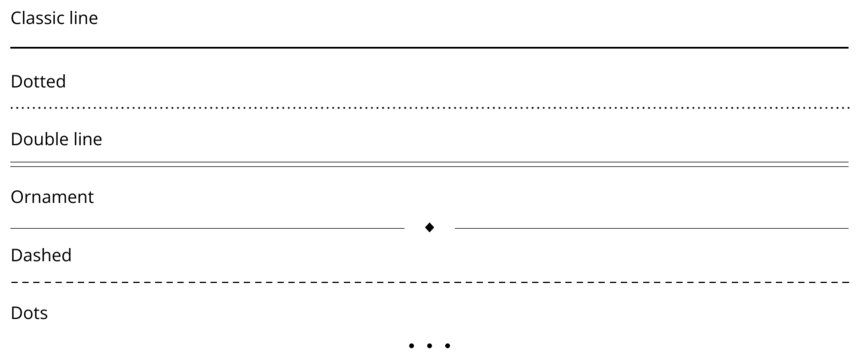
<p>A visual separator between question groups, available as a classic line in several weights, dotted, double line, ornament, dashed, and centered dots. Any line style can also render short and centered.</p>
<p><img src="/images/help/question-types/divider-styles.png" alt="Divider styles" /></p>
<p><strong>Best for:</strong> Visual organization, section separation</p>
<h3>Vertical spacing</h3>
<p>Adds blank space between elements.</p>
<p><strong>Best for:</strong> Improving readability, creating visual breathing room</p>
<h3>Multi-column</h3>
<p>Groups questions in 2, 3, 4, or 5 column layouts.</p>
<p><img src="/images/help/question-types/multi-column.png" alt="Multi column layout" /></p>
<p><strong>Best for:</strong> Short questions, demographic data, space optimization</p>
<h3>Repeater</h3>
<p>Repeats the next set of questions a fixed number of times, saving each repeated block as a separate entry. Use <code>[counter]</code> and <code>[max_counter]</code> in question names for labels such as "Person 1 of 3."</p>
<p><strong>Best for:</strong> Rosters, multiple people or items per form, repeated sections</p>
<h2>Special</h2>
<h3>Prefill data</h3>
<p>An invisible field that associates prefilled data with a response. It is not shown on the form and collects no answer from the respondent. See the Prefill Data section for setup and bulk link generation.</p>
<p><strong>Best for:</strong> Matching responses to known records, tracking codes, mail-merge data</p>
<h2>Need a custom question type?</h2>
<p>If your survey requires a specialized question format not listed here, contact us at <a href="mailto:hello@papersurvey.io">hello@papersurvey.io</a>. We regularly add new question types based on user needs.</p>]]>
            </summary>
                                    <updated>2026-07-18T07:29:35+00:00</updated>
        </entry>
            <entry>
            <title><![CDATA[Prefill Forms: Personalized Surveys from a Spreadsheet]]></title>
            <link rel="alternate" href="https://www.papersurvey.io/help/prefill-data/article/how-to-prefill-survey-data-in-form" />
            <id>https://www.papersurvey.io/18</id>
            <author>
                <name><![CDATA[PaperSurvey.io]]></name>
            </author>
            <summary type="html">
                <![CDATA[<p>Prefill Forms is mail merge for surveys. You upload a spreadsheet, and each row becomes its own personalized survey copy, printed on paper or delivered as a unique web link. When responses come back, every one already carries its row's data, so nothing you knew in advance has to be re-entered or re-matched by hand.</p>
<p>A prefill list can feed a survey in four ways, and you can combine them freely:</p>
<table>
<thead>
<tr>
<th>What you want</th>
<th>How to set it up</th>
</tr>
</thead>
<tbody>
<tr>
<td>Print a value into an answer field</td>
<td>Name a question to match the column</td>
</tr>
<tr>
<td>Show a value inside question text</td>
<td>Write <code>{{Column name}}</code> in the text</td>
</tr>
<tr>
<td>Attach data invisibly to responses</td>
<td>Add a Prefill Data question named after the column</td>
</tr>
<tr>
<td>Send personal web survey links</td>
<td>Generate one pre-filled link per row</td>
</tr>
</tbody>
</table>
<p>This guide covers each step in order: building the list, wiring the survey, printing, scanning back, and the web link option.</p>
<h2>Step 1: Build your prefill list</h2>
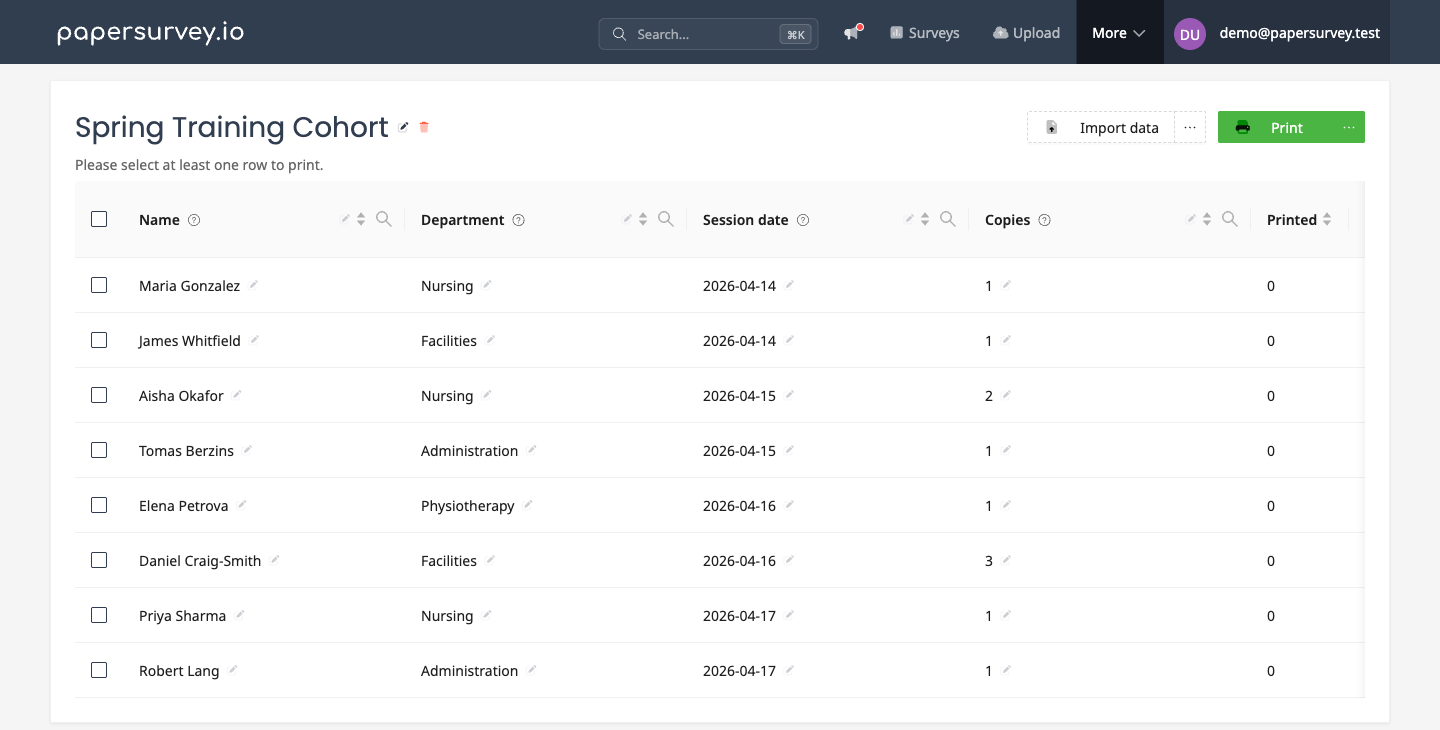
<p>Open <a href="/app/prefill">Prefill Forms</a> and create a new list by uploading a spreadsheet (CSV or Excel). The header row becomes your columns and every following row becomes one survey copy. You can also start from an empty list and add rows in the browser.</p>
<p><img src="/images/blog/prefill-forms-table.png" alt="A prefill list with imported rows" /></p>
<p>The list is fully editable in place:</p>
<ul>
<li><strong>Edit any cell</strong> by clicking it. Type the new value and press Enter.</li>
<li><strong>Add rows</strong> one at a time, or import another spreadsheet into the same list.</li>
<li><strong>Add columns</strong> from the menu next to "Import data". A column added as a "copies" column is automatically wired up as the per-row copy count for printing.</li>
<li><strong>Search and sort</strong> every column, and track which rows have already been printed or scanned in the Printed column.</li>
</ul>
<h2>Step 2: Wire the survey</h2>
<p>The connection between a column and your survey is the name. When you print, each column label is compared against the names of the survey's fillable questions. Matching is forgiving: capitalization, spaces, and punctuation such as underscores, dashes, and question marks are ignored, so a column called <code>session_date</code> matches a question named "Session date". The print dialog always shows how many columns matched before anything prints.</p>
<p>There are three ways a column can reach the survey. Pick per column, and mix them in one survey.</p>
<h3>Fill an answer field</h3>
<p>Name a question to match the column, and each printed copy carries that row's value in the question's answer area. This works for short text questions, dates (the value is parsed and split into the printed date boxes automatically), numbers, and emails. The respondent skips what you already know, and recognition treats the printed value like any other answer when the form is scanned.</p>
<h3>Insert values into the question text</h3>
<p>Write a placeholder in double curly braces anywhere in a question, heading, or description:</p>
<pre><code>Thank you for attending the {{Session date}} training. How useful was it for you?</code></pre>
<p>Each copy replaces the placeholder with that row's value. The placeholder must use the column's name as typed, and spaces just inside the braces are tolerated: <code>{{ Session date }}</code> works too.</p>
<p><img src="/images/blog/dynamic-text.png" alt="Placeholders replaced per copy" /></p>
<p>Replaced text can be longer or shorter than the placeholder, which would shift the layout from copy to copy and hurt recognition. Wrap dynamic text in a height box so every copy occupies the same space:</p>
<pre><code>[height=2cm]Thank you for attending the {{Session date}} training.[/height]</code></pre>
<p>Add <code>[width=10cm]...[/width]</code> as well when the surrounding layout is tight. Sizes accept centimeters (cm) or inches (in).</p>
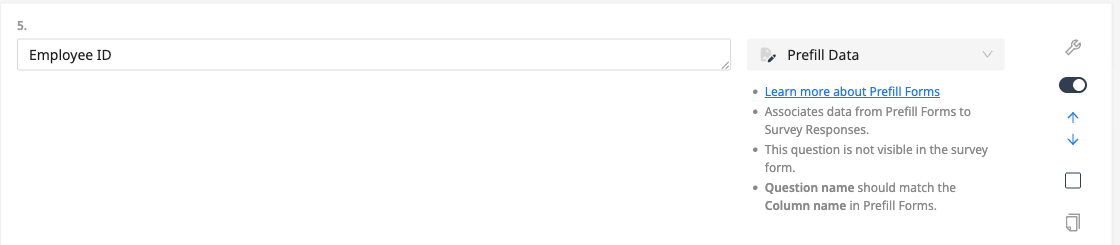
<h3>Attach data invisibly</h3>
<p>Add a <strong>Prefill Data</strong> question named after the column. It never appears on the printed or web form, but its value is attached to every response from that copy and shows up in the Responses table, filters, cross tabs, and every export.</p>
<p><img src="/images/blog/prefill-forms-editor.png" alt="A Prefill Data question in the editor" /></p>
<p>This is the right choice for participant IDs, cohorts, sites, or anything respondents should not see. The survey looks completely generic while every returned sheet stays fully traceable.</p>
<h2>Step 3: Print personalized copies</h2>
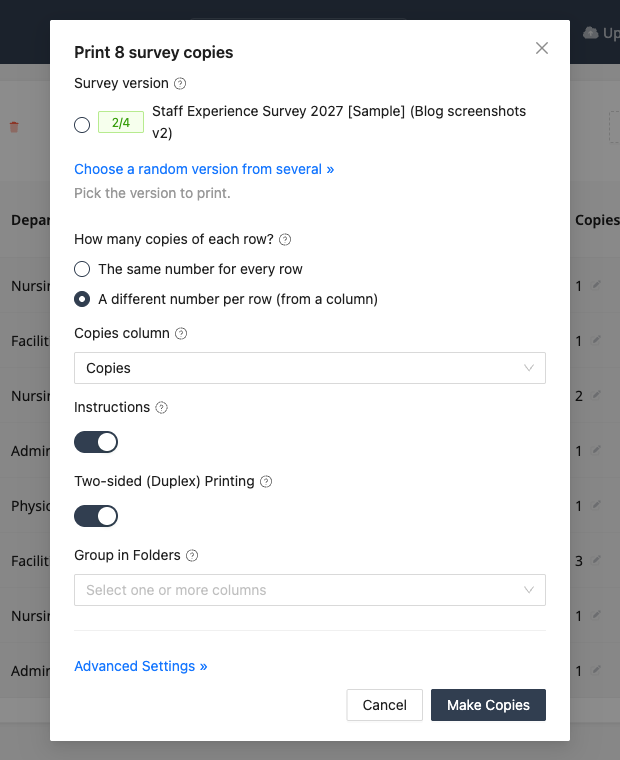
<p>Select the rows to print and press Print. The dialog walks through everything that matters:</p>
<p><img src="/images/blog/prefill-forms-print-modal.png" alt="The print dialog" /></p>
<ul>
<li><strong>Survey version.</strong> Pick which version to print. Next to each version you can see how many of your columns matched its fields, so a naming mistake is visible before printing.</li>
<li><strong>Copies per row.</strong> Print the same number for every row, or take a per-row number from a column, one form per attendee for most sessions, three for the big one.</li>
<li><strong>Instructions and duplex.</strong> Optionally add an instructions page and enable two-sided printing.</li>
<li><strong>Group in folders.</strong> Split the generated PDFs into folders by any column, for example one folder per location.</li>
</ul>
<p>Under <strong>Advanced Settings</strong> you can also pick an identifier column (see below), set how many copies go into each PDF file, and adjust the identifier prefix.</p>
<p>Two requirements to know about:</p>
<ul>
<li><strong>Unique Page Marking must be enabled</strong>, because each copy is identified by the QR codes printed on the page. Multi-page surveys have this automatically; for single-page surveys enable "Uniquely mark single-page surveys" in survey settings. See <a href="/help/printing/article/unique-paper-survey-identifiers">unique survey identifiers</a>.</li>
<li><strong>Create a new version after editing.</strong> If you change the survey after generating copies, create a new version in the Print tab before printing again.</li>
</ul>
<h3>Identifiers</h3>
<p>Every copy receives an identifier that ties the physical sheet back to its spreadsheet row. Leave the setting alone and identifiers are generated automatically. If your rows already have stable unique IDs, choose that column as the identifier in Advanced Settings; every value must be unique. When printing more than one copy per row, identifiers are always auto-generated so each sheet stays distinct.</p>
<h2>Step 4: Scan the returned forms</h2>
<p>Nothing special. Upload the scanned stack as usual: the QR code on each page identifies the copy, recognition reads the handwritten answers, and the prefilled values are attached to the response automatically. In the Responses table, prefilled fields are marked so you can tell them apart from respondent answers, and every prefill column is available for filtering and in exports.</p>
<p>Back in the prefill list, the Printed column counts how many forms from each row have been scanned. The selection menu includes "Select not uploaded rows", so following up with non-responders is one click, not a spreadsheet reconciliation.</p>
<h2>Web survey links</h2>
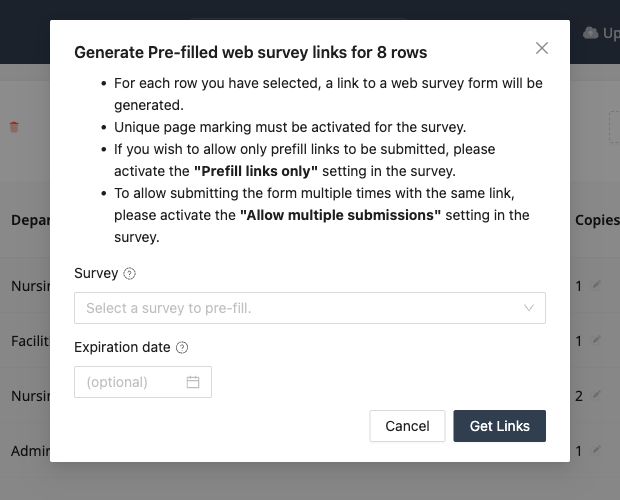
<p>The same list generates personal web survey links, one per row, with all the same wiring: matched fields are pre-filled, placeholders are replaced, and Prefill Data values ride along invisibly. Select rows, choose "Generate links to web survey", and download the spreadsheet of links for your mail merge.</p>
<p><img src="/images/blog/prefill-forms-web-links.png" alt="Generating web survey links" /></p>
<p>If your survey text contains the survey's plain web address, it is replaced with each row's personal link automatically. Expiration dates and submission rules are covered in <a href="/help/prefill-data/article/generating-prefill-links-in-bulk">Generating Prefill Links in Bulk</a>.</p>
<h2>Advanced: several rows on one printed form</h2>
<p>If your survey contains a Repeater block, one printed form can carry several consecutive rows, for example one class list per sheet. Inside the repeated block, add a number to the placeholder to address each row: <code>{{Name1}}</code> is the first row on the sheet, <code>{{Name2}}</code> the second, and so on.</p>
<h2>Data retention</h2>
<p>"Clear data" in survey settings deletes responses but keeps your prefill list untouched. You can re-upload previously printed pages or start a fresh collection cycle without rebuilding anything.</p>]]>
            </summary>
                                    <updated>2026-07-17T12:49:14+00:00</updated>
        </entry>
            <entry>
            <title><![CDATA[PaperSurvey + Dropbox Integration]]></title>
            <link rel="alternate" href="https://www.papersurvey.io/help/integrations/article/papersurvey-dropbox-integration" />
            <id>https://www.papersurvey.io/19</id>
            <author>
                <name><![CDATA[PaperSurvey.io]]></name>
            </author>
            <summary type="html">
                <![CDATA[<p>PaperSurvey seamlessly integrates with Dropbox to automatically process documents from your cloud storage. Instead of manually uploading each scan, simply save your scanned surveys to a designated Dropbox folder and PaperSurvey will handle the rest.</p>
<h2>How the integration works</h2>
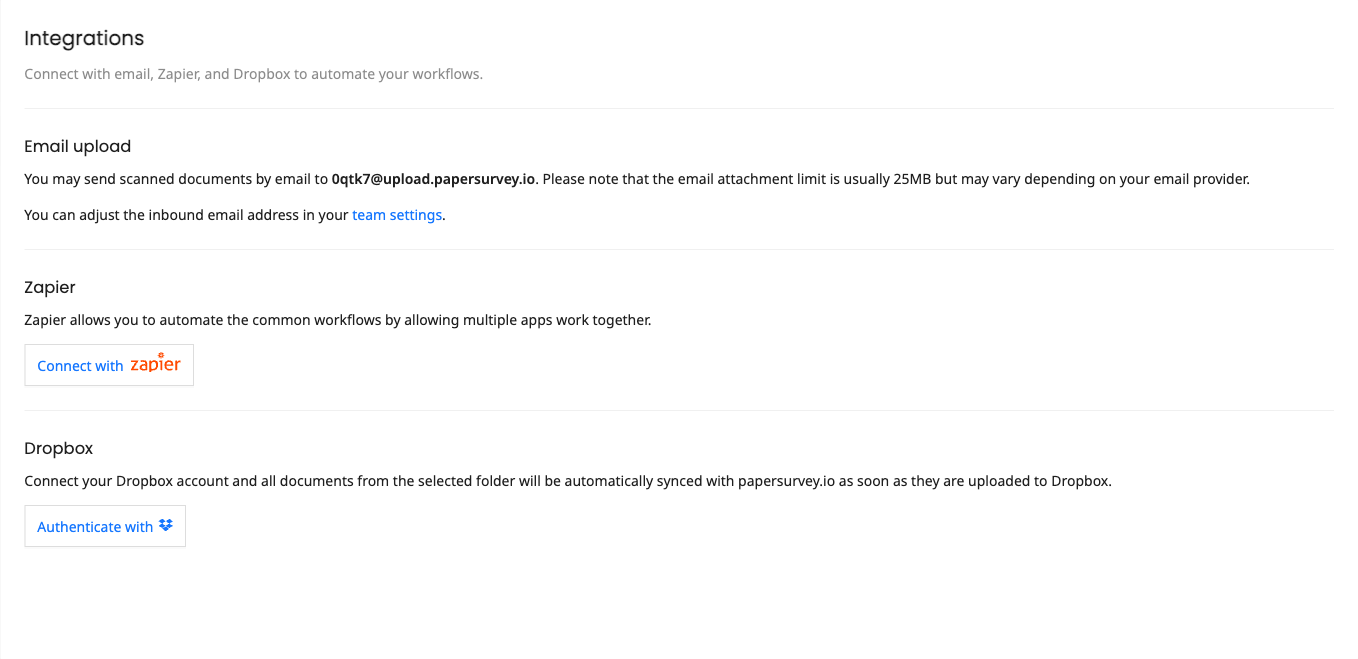
<p><img src="/images/blog/integrations-page.png" alt="Integrations page with Dropbox connection" /></p>
<p>Once connected, PaperSurvey monitors your selected Dropbox folder for new files. When you add scanned surveys to this folder, they are automatically:</p>
<ul>
<li>Detected within minutes</li>
<li>Uploaded to your PaperSurvey account</li>
<li>Processed using our OCR technology</li>
<li>Made available in your survey results</li>
</ul>
<h2>Perfect for these scenarios</h2>
<h3>Office scanner integration</h3>
<p>Many office scanners and multifunction printers can save directly to Dropbox. With this integration, your team can scan completed surveys at any networked scanner, and the results automatically appear in PaperSurvey.</p>
<h3>Mobile scanning workflow</h3>
<p>Use the Dropbox mobile app to <a href="/help/scanning/article/can-papersurvey-read-photos-taken-by-cell-phone">photograph surveys in the field</a>. The images sync to your Dropbox folder and automatically process in PaperSurvey, making it perfect for remote data collection.</p>
<h3>Team collaboration</h3>
<p>Multiple team members can contribute scanned surveys to a shared Dropbox folder, centralizing your data collection without manual uploads.</p>
<h2>Setting up Dropbox integration</h2>
<ol>
<li>Navigate to your <a href="https://www.papersurvey.io/app/settings/integrations">Integration Settings</a></li>
<li>Click "Authenticate with Dropbox" and authorize PaperSurvey to access your account</li>
<li>Select the folder to auto-sync (we recommend creating a dedicated "PaperSurvey Uploads" folder). Keep selecting to navigate into nested folders.</li>
</ol>
<p>Your folder choice is saved immediately, and the first sync starts as soon as the next file is added to the folder. From then on, any files added to your chosen folder (including its subfolders) will be automatically picked up and processed.</p>
<p>PaperSurvey picks up PDF, JPG, PNG, and TIFF files. Very small files (under about 10 KB) and files that were already uploaded before are skipped automatically, so a synced folder never creates duplicate uploads.</p>
<p>You can disconnect the integration at any time with the "Revoke access" button on the same page.</p>]]>
            </summary>
                                    <updated>2026-07-18T07:29:35+00:00</updated>
        </entry>
            <entry>
            <title><![CDATA[PaperSurvey + Email Upload]]></title>
            <link rel="alternate" href="https://www.papersurvey.io/help/integrations/article/papersurvey-email-integration" />
            <id>https://www.papersurvey.io/20</id>
            <author>
                <name><![CDATA[PaperSurvey.io]]></name>
            </author>
            <summary type="html">
                <![CDATA[<p>Email upload gives you a fast, familiar way to submit scanned surveys for automatic processing. Instead of logging into PaperSurvey to upload files manually, you simply attach your scans to an email and send them to your unique upload address. This is especially useful for field teams and remote scanning workflows.</p>
<h2>How email upload works</h2>
<p>Every PaperSurvey account includes a unique upload email address. When you send scanned surveys to this address:</p>
<ul>
<li>Attachments are automatically extracted and processed</li>
<li>Uploaded documents are automatically recognized into survey responses</li>
<li>Results appear in your account within minutes</li>
</ul>
<h2>Your unique upload address</h2>
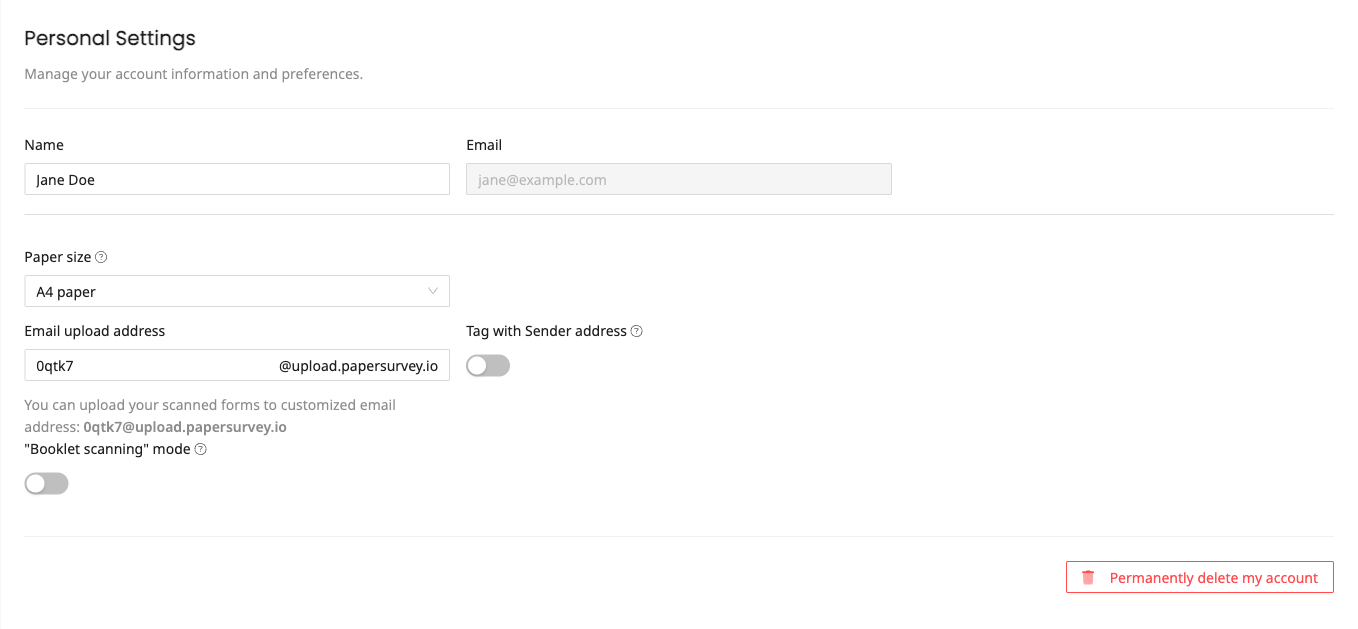
<p><img src="/images/blog/account-personal-settings.png" alt="Personal settings with email upload address" /></p>
<p>Find your personalized upload email in your <a href="https://www.papersurvey.io/app/settings">General Settings</a>. You can customize this address to make it memorable, for example:</p>
<ul>
<li><code>surveys@upload.papersurvey.io</code></li>
<li><code>fieldwork@upload.papersurvey.io</code></li>
<li><code>research2024@upload.papersurvey.io</code></li>
</ul>
<h2>Perfect for these workflows</h2>
<h3>Mobile scanning on the go</h3>
<p>Scan surveys with your <a href="/help/scanning/article/can-papersurvey-read-photos-taken-by-cell-phone">phone's scanning app</a>, then email them immediately. No need to wait until you're back at the office.</p>
<h3>Scanner email integration</h3>
<p>Many modern scanners can email scanned documents directly. Configure your scanner to send to your PaperSurvey upload address for one-touch processing.</p>
<h3>Team data collection</h3>
<p>Share your upload email with field teams. They can submit scanned surveys from anywhere without needing account access.</p>
<h2>Email setup guidelines</h2>
<h3>File attachments</h3>
<ul>
<li><strong>Formats</strong>: Attach PDF, JPG, PNG, TIFF, or HEIC files</li>
<li><strong>Size limit</strong>: Keep individual attachments under 25MB (some email providers limit to 20MB)</li>
<li><strong>Multiple files</strong>: Send multiple attachments in one email, and they'll all process together</li>
<li><strong>File names</strong>: Use clear names to identify surveys later</li>
</ul>
<p>Very small attachments (under about 10 KB) and small inline images such as email signature logos are ignored automatically. If an attachment is in an unsupported format, you will receive a reply listing the skipped files, and if you forget to attach any files you will get a reply asking for them.</p>
<h3>Email body and subject</h3>
<p>The email body text is optional and won't affect processing. Use it for notes to yourself or your team.</p>
<h3>Tagging emailed uploads</h3>
<p>Documents uploaded by email are given the <a href="/help/responses/article/tag-survey-responses">tag</a> <code>email</code> by default. To assign your own tag, use plus addressing: sending to <code>youraddress+clinic1@upload.papersurvey.io</code> tags the documents as <code>clinic1</code>. Alternatively, enable "Tag with Sender address" in your General Settings to tag each document with the sender's email address instead.</p>
<h2>Security considerations</h2>
<p>Your upload email address is unique and private. All uploads are encrypted during transmission and storage.</p>
<p>Need to change your upload address or adjust tagging options? Visit your <a href="https://www.papersurvey.io/app/settings">General Settings</a> to manage email integration options.</p>]]>
            </summary>
                                    <updated>2026-07-18T07:29:35+00:00</updated>
        </entry>
            <entry>
            <title><![CDATA[What Are Unique Survey Identifiers?]]></title>
            <link rel="alternate" href="https://www.papersurvey.io/help/printing/article/unique-paper-survey-identifiers" />
            <id>https://www.papersurvey.io/21</id>
            <author>
                <name><![CDATA[PaperSurvey.io]]></name>
            </author>
            <summary type="html">
                <![CDATA[<p>Unique survey identifiers are QR codes that PaperSurvey adds to each printed survey page. These identifiers automate page matching, prevent duplicates, and enable advanced features like dynamic forms and database linking. Understanding when to use them will help you choose the right setup for your project.</p>
<h2>How Unique Identifiers Work</h2>
<p>When enabled, PaperSurvey adds QR codes to your survey pages:</p>
<ul>
<li><strong>Multi-page surveys</strong>: QR codes on each page identify both the survey and the specific response</li>
<li><strong>Single-page surveys</strong>: One QR code identifies the survey, with an optional second code to identify the respondent</li>
</ul>
<p>These codes work invisibly during scanning. You simply upload files and PaperSurvey handles the rest.</p>
<p><img src="/images/blog/paper-survey-unique-markings.png" alt="Survey footer with QR codes" /></p>
<h2>Benefits of Using Unique Identifiers</h2>
<h3>1. Automatic Page Matching</h3>
<p>Upload hundreds of pages in any order, and PaperSurvey automatically groups them by respondent. No more manual sorting or worrying about page sequence.</p>
<h3>2. Duplicate Prevention</h3>
<p>If someone accidentally scans the same page twice, PaperSurvey recognizes the duplicate, processes the page only once, and flags the repeated scan for your review, maintaining data integrity.</p>
<h3>3. Database Integration</h3>
<p>Match survey responses to your internal records by linking identifier codes to participant IDs, employee numbers, or other systems.</p>
<h3>4. Dynamic Forms</h3>
<p>Create personalized surveys with pre-filled information unique to each respondent, such as names, ID numbers, or custom fields.</p>
<h2>When to Enable Unique Identifiers</h2>
<h3>Enable for These Scenarios</h3>
<ul>
<li><strong>Multi-page surveys</strong>: Automatic page grouping saves hours of manual work</li>
<li><strong>Large-scale distributions</strong>: Easier tracking and quality control</li>
<li><strong>Linked data needs</strong>: Connecting responses to existing databases</li>
<li><strong>Pre/post studies</strong>: Automatic matching of before/after responses</li>
<li><strong>Personalized surveys</strong>: When using dynamic form features</li>
</ul>
<h3>Consider Disabling When</h3>
<ul>
<li><strong>On-demand printing needed</strong>: People need flexibility to print additional copies locally</li>
<li><strong>Cost is critical</strong>: Some print shops charge more for unique pages</li>
<li><strong>Newspaper inserts</strong>: Mass distribution where tracking is not needed</li>
</ul>
<p>If you need both unique identifiers and the ability to print more copies, you can create a shareable link that allows anyone with the link to generate and print additional uniquely marked surveys, without logging in.</p>
<h2>Understanding the Default Settings</h2>
<p><img src="/images/blog/footer.png" alt="Multi-page survey footer" /></p>
<p><strong>Multi-page surveys</strong>: Unique identifiers are ON by default. This prevents common issues like mixed responses or missing pages. Most users benefit from automatic page handling.</p>
<p><img src="/images/blog/footer-2.png" alt="Single-page survey footer" /></p>
<p><strong>Single-page surveys</strong>: Unique identifiers are OFF by default. Single pages do not need automatic grouping, making this simpler for basic survey needs.</p>
<h2>How to Manage Unique Identifiers</h2>
<ol>
<li>Go to your survey's settings and open the <strong>Printing &amp; Scanning</strong> section</li>
<li>Enable or disable the <strong>Unique page marking</strong> switch</li>
<li>Save your settings</li>
</ol>
<h3>Using Shareable Print Links</h3>
<p>For surveys with unique identifiers that need distributed printing:</p>
<ol>
<li>Open the Share Print Page by either:<ul>
<li>Going directly to <a href="https://www.papersurvey.io/app/prints/share">Share Print Page</a></li>
<li>Or clicking <strong>More</strong> -&gt; <strong>Prints</strong> -&gt; <strong>Share print page</strong></li>
</ul>
</li>
<li>Click <strong>Share</strong>, select your survey, and create the link. The survey must already have a printable version created on its Print page. You can then copy the link and send it to whoever needs to print.</li>
<li>On the shared page, users can:<ul>
<li>Enter the number of copies needed</li>
<li>Optionally set an identifier prefix (helps track different print runs)</li>
<li>Click <strong>Make Copies</strong> to create uniquely marked PDFs</li>
<li>Print the generated surveys</li>
</ul>
</li>
<li>No PaperSurvey login required for printing</li>
</ol>
<p>Each request can generate up to 1,000 copies (up to 50 while the account is on trial), and an email address is required when requesting more than 300 copies so the requester receives a download link when the file is ready. You can also let the same page accept scanned responses by enabling <strong>Uploads</strong> for the link.</p>
<h2>Important Considerations</h2>
<h3>Printing Requirements</h3>
<ul>
<li><strong>With identifiers</strong>: Generate through PaperSurvey or use shareable print links</li>
<li><strong>Without identifiers</strong>: Can print on demand from any PDF</li>
</ul>
<h3>Scanning Requirements</h3>
<ul>
<li><strong>With identifiers</strong>: Upload all pages together. Order does not matter.</li>
<li><strong>Without identifiers</strong>: Keep responses separated or in correct page order</li>
</ul>
<h2>Practical Examples</h2>
<h3>Example 1: Conference Feedback (1000 attendees, 3-page survey)</h3>
<p><strong>With identifiers</strong>: Print 1000 unique copies, scan all 3000 pages in any order.
<strong>Without identifiers</strong>: Scan each 3-page response separately (1000 separate files).</p>
<h3>Example 2: Restaurant Comment Cards (single page)</h3>
<p><strong>With identifiers</strong>: Each card tracked individually, prevents duplicate entries.
<strong>Without identifiers</strong>: Simple scanning, can make more copies from the same PDF as needed.</p>
<h2>Making the Right Choice</h2>
<p>Ask yourself:</p>
<ol>
<li>Do I need to track individual responses? Enable identifiers.</li>
<li>Will pages get mixed during scanning? Enable identifiers.</li>
<li>Do I need printing flexibility? Disable identifiers.</li>
<li>Is this a simple, single-page survey? Disable identifiers.</li>
</ol>
<p>Most users find the benefits of unique identifiers outweigh the printing constraints, especially for multi-page surveys or studies requiring response tracking.</p>]]>
            </summary>
                                    <updated>2026-07-18T07:29:35+00:00</updated>
        </entry>
            <entry>
            <title><![CDATA[How Do I Delete Survey Responses?]]></title>
            <link rel="alternate" href="https://www.papersurvey.io/help/responses/article/how-to-remove-survey-responses" />
            <id>https://www.papersurvey.io/22</id>
            <author>
                <name><![CDATA[PaperSurvey.io]]></name>
            </author>
            <summary type="html">
                <![CDATA[<p>There are several ways to remove survey data in PaperSurvey, depending on whether you want to delete individual responses, entire documents, all collected data, or a complete survey. Each method serves different needs, so choosing the right approach helps you maintain control over your data.</p>
<p>Understanding the differences between these options will help you avoid removing more than intended while still keeping your workspace clean.</p>
<h2>Deletion Options Overview</h2>
<p>PaperSurvey offers four main approaches:</p>
<ul>
<li><strong>Delete all survey data</strong>: Removes all responses but keeps the survey structure</li>
<li><strong>Delete uploaded documents</strong>: Removes scanned files and all associated responses</li>
<li><strong>Delete individual responses</strong>: Removes specific entries while preserving others</li>
<li><strong>Delete entire survey</strong>: Removes the survey structure and all responses</li>
</ul>
<h2>Method 1: Delete All Survey Data (Keep Survey Structure)</h2>
<p>This method removes all responses while preserving your survey design. It also resets the page counter.</p>
<h3>Steps</h3>
<ol>
<li>Go to your survey's <strong>Settings</strong> page</li>
<li>Scroll down to the "Danger Zone" section</li>
<li>Click <strong>"Clear data"</strong></li>
<li>Confirm the deletion when prompted</li>
</ol>
<h3>When to use</h3>
<p>This is ideal for moving from a test to production phase, starting a new data collection cycle, or clearing all data while keeping survey settings. All responses are deleted, but your survey structure, settings, and sharing links remain intact. Prefilled forms data is retained, allowing you to re-upload pages.</p>
<h2>Method 2: Delete Uploaded Documents</h2>
<p>This method removes the source document and all responses extracted from it.</p>
<p><img src="/images/blog/delete-document.png" alt="Delete Document" /></p>
<h3>Steps</h3>
<ol>
<li>Navigate to the <a href="/app/uploads">Uploaded Documents</a> page</li>
<li>Find the document you want to remove</li>
<li>Click the delete button next to the document</li>
<li>Confirm the deletion when prompted</li>
</ol>
<h3>When to use</h3>
<p>Choose this when you uploaded the wrong document, an entire batch of responses is invalid, or you need to re-process the same documents.</p>
<h2>Method 3: Delete Individual Responses</h2>
<p>Remove specific responses while keeping others intact.</p>
<p><img src="/images/blog/delete-entry.png" alt="Delete Entry" /></p>
<h3>Steps</h3>
<ol>
<li>Go to your survey's "Responses" page</li>
<li>Click the "Edit" toggle to enable editing mode</li>
<li>Find the response you want to delete</li>
<li>Click the "Delete" button next to that response</li>
<li>Confirm the deletion</li>
</ol>
<h3>When to use</h3>
<p>This is best for removing test submissions, deleting duplicate entries, or cleaning individual invalid responses.</p>
<h2>Method 4: Delete Entire Survey</h2>
<p>Remove the complete survey including all responses and structure. Deleted surveys are moved to the trash bin where they can be restored within 90 days.</p>
<p><img src="/images/blog/delete-survey.png" alt="Delete Survey" /></p>
<h3>Steps</h3>
<ol>
<li>Open your survey's "Settings" page</li>
<li>Scroll to the danger zone section</li>
<li>Click <strong>"Remove Survey"</strong> to delete everything</li>
<li>Confirm your choice</li>
<li>The survey moves to the trash bin (restorable for 90 days)</li>
</ol>
<h3>When to use</h3>
<p>Choose this for removing completed or outdated projects, cleaning up test surveys, or starting completely fresh with a new design.</p>
<h3>Permanent deletion</h3>
<p>Access your trash bin to view deleted surveys. From there you can select surveys to permanently delete. Permanent deletion cannot be undone.</p>
<h2>What Happens After Deletion</h2>
<h3>Immediate effects</h3>
<p>Deleted surveys move to the trash bin (except for permanent deletion). Data disappears from your dashboard instantly, reports and exports no longer include deleted data, and team members lose access to deleted content.</p>
<h3>Behind the scenes</h3>
<p>Database records are marked for deletion, and files are queued for removal (this process takes 1 to 24 hours). Backup retention keeps data for up to 3 months. Permanent deletion occurs after the backup period expires and the oldest backups are removed.</p>
<h2>Important Warnings</h2>
<p>Deletions cannot be reversed through the interface. Always export your data before bulk deletions, and consider using tags or filters instead of deletion when possible.</p>
<p>Deleted data remains in backups for 3 months, so emergency recovery may be possible during that window (fees apply). After 3 months, recovery becomes impossible.</p>
<h2>Recovery Options</h2>
<h3>Deleted surveys (trash bin)</h3>
<p>If you accidentally deleted a survey, you can restore it from the trash bin:</p>
<ol>
<li>Access your trash bin from the dashboard</li>
<li>Find the deleted survey (available for 90 days)</li>
<li>Click restore to bring it back</li>
<li>All data and settings are restored instantly</li>
</ol>
<h3>Permanently deleted data</h3>
<p>If you permanently deleted data or it has been over 90 days:</p>
<p><strong>Within 3 months of permanent deletion</strong>, contact support with the survey ID and deletion timestamp. Restoration fees apply, and the process takes 2 to 14 business days.</p>
<p><strong>After 3 months</strong>, no recovery is possible. You would need to re-upload original documents if available or recreate the survey structure manually.</p>]]>
            </summary>
                                    <updated>2026-03-29T04:30:48+00:00</updated>
        </entry>
            <entry>
            <title><![CDATA[Can Paper Surveys Be Photocopied?]]></title>
            <link rel="alternate" href="https://www.papersurvey.io/help/printing/article/can-paper-surveys-be-photocopied" />
            <id>https://www.papersurvey.io/23</id>
            <author>
                <name><![CDATA[PaperSurvey.io]]></name>
            </author>
            <summary type="html">
                <![CDATA[<p>Paper surveys can be photocopied, but it is not recommended. While many PaperSurvey users have successfully processed photocopied surveys, the quality degradation often leads to recognition issues that require manual intervention. Understanding the tradeoffs will help you decide whether photocopying is appropriate for your situation.</p>
<h2>Why Photocopying Causes Problems</h2>
<p>Each time you photocopy a document, the print quality degrades slightly. This degradation compounds with each generation of copies, leading to:</p>
<ul>
<li><strong>Blurred text and checkboxes</strong> that are harder to read</li>
<li><strong>Loss of fine detail</strong> in QR codes</li>
<li><strong>Uneven contrast</strong> across the page</li>
<li><strong>Distorted grid lines</strong> and form elements</li>
</ul>
<p>These issues directly impact PaperSurvey's ability to accurately recognize and process responses.</p>
<h2>If You Must Use Photocopies</h2>
<p>Sometimes photocopying is unavoidable due to budget constraints or last-minute needs. Here is how to minimize problems.</p>
<h3>Best Practices for Photocopying</h3>
<ol>
<li><strong>Always copy from originals</strong>: Never make copies of copies</li>
<li><strong>Use high-quality settings</strong>: Select the highest quality option on your copier</li>
<li><strong>Check the first copy</strong>: Verify all elements (corner marks, QR codes, checkboxes) are clearly visible before making multiple copies</li>
<li><strong>Clean the copier glass</strong>: Dust and smudges create artifacts that interfere with recognition</li>
</ol>
<h3>What to Expect</h3>
<ul>
<li><strong>Increased manual verification</strong>: Plan extra time to review and correct recognition errors</li>
<li><strong>Corner mark issues</strong>: Corner marks may not be detected</li>
<li><strong>QR code failures</strong>: Unique page identifiers might become unreadable</li>
</ul>
<h2>Photocopying and Unique Page Marking</h2>
<p>If your survey uses unique page marking, every photocopy carries the same identifier code as the original page. When you scan several photocopies of the same original, only the first one is processed. The rest are flagged as duplicates and set aside for your review.</p>
<p>If you know photocopying will happen, either turn off unique page marking in the survey settings before printing, or enable the <strong>Allow duplicates</strong> option in the survey's Printing &amp; Scanning settings so photocopied pages are not flagged.</p>
<h2>Better Alternatives to Photocopying</h2>
<p>Consider these options before resorting to photocopies:</p>
<ol>
<li><strong>Print additional copies directly</strong>: Generate fresh PDFs from PaperSurvey and print what you need</li>
<li><strong>Digital distribution</strong>: Email PDFs to locations for local printing</li>
<li><strong>Professional printing services</strong>: Often more cost-effective than photocopying for larger quantities</li>
</ol>
<h2>Planning Ahead</h2>
<p>To avoid photocopying issues entirely, estimate your needs generously when ordering initial prints, keep a master copy specifically for making additional copies if needed, and consider enabling unique page marking only for controlled distributions.</p>]]>
            </summary>
                                    <updated>2026-07-18T07:29:35+00:00</updated>
        </entry>
            <entry>
            <title><![CDATA[What Is Intelligent Word Recognition (IWR)?]]></title>
            <link rel="alternate" href="https://www.papersurvey.io/help/recognition/article/intelligent-word-recognition-iwr" />
            <id>https://www.papersurvey.io/24</id>
            <author>
                <name><![CDATA[PaperSurvey.io]]></name>
            </author>
            <summary type="html">
                <![CDATA[<p>Handwriting recognition works well for most responses, but certain questions have a limited set of expected answers, such as city names, course titles, or product names. Intelligent Word Recognition (IWR) takes advantage of this by matching written responses against your predefined dictionary, dramatically improving accuracy for those predictable fields.</p>
<h2>How IWR improves accuracy</h2>
<p>Unlike standard character-by-character recognition, IWR matches entire words against your dictionary. For example, standard recognition might read "New Yrok" due to a character-level error, but IWR matches it to "New York" from your dictionary and automatically verifies the correct answer.</p>
<h2>When to use IWR</h2>
<p>IWR works best for questions with:</p>
<ul>
<li><strong>Limited possible answers</strong> such as countries, states, or cities</li>
<li><strong>Repeated responses</strong> like course names or department names</li>
<li><strong>Common misspellings</strong> of technical terms or brand names</li>
<li><strong>Standardized formats</strong> including ID numbers and codes</li>
</ul>
<h2>Setting up IWR</h2>
<h3>Step 1: Open the Accepted Answers tab</h3>
<ol>
<li>Go to <strong>Surveys</strong> in your dashboard</li>
<li>Select your survey</li>
<li>Click <strong>Verify</strong> in the survey menu</li>
<li>Open the <strong>Accepted Answers</strong> tab</li>
</ol>
<p><img src="/images/blog/iwr-survey-software.png" alt="IWR" /></p>
<h3>Step 2: Add verification rules</h3>
<ol>
<li>Click <strong>Add Custom Rule</strong></li>
<li>Select the question (works with Short Text, Number, and Date questions)</li>
<li>Choose your matching method:<ul>
<li><strong>Fuzzy match (similar spelling)</strong> for handwritten text (recommended)</li>
<li><strong>Exact match</strong> for codes and IDs that must match exactly</li>
<li>Number questions automatically use exact number matching</li>
</ul>
</li>
</ol>
<p><img src="/images/blog/iwr-modal.png" alt="IWR" /></p>
<h3>Step 3: Enter expected values</h3>
<p>Add your dictionary entries, one per line:</p>
<p><img src="/images/blog/iwr-modal-text.png" alt="IWR" /></p>
<p>Example entries:</p>
<pre><code>New York
Los Angeles
Chicago
Houston
Phoenix</code></pre>
<p>As you type, a live preview shows how many existing unverified responses the rule will match. Click <strong>Add</strong> to save your rule; matching responses are verified immediately, and new responses are verified automatically as they come in. Responses accepted by a fuzzy rule are stored with the exact spelling and capitalization of your accepted answer.</p>
<h2>Best practices</h2>
<h3>For text responses</h3>
<ul>
<li>Use "Fuzzy match" for flexibility</li>
<li>Include common variations (NY, New York, NYC)</li>
<li>Add common misspellings you have observed</li>
<li>Keep lists manageable (under 100 entries)</li>
</ul>
<h3>For numeric responses</h3>
<ul>
<li>Use "Exact match" for exact matching</li>
<li>Include formats with and without separators</li>
<li>Add leading zeros if applicable</li>
<li>Consider ranges for validation</li>
</ul>
<h3>Dictionary management</h3>
<ul>
<li>Start with a small dictionary and expand based on actual responses</li>
<li>Review unmatched responses regularly</li>
<li>Export verified responses to identify new dictionary entries</li>
<li>Group similar rules by question type</li>
</ul>
<h2>How IWR works with handwriting recognition</h2>
<p>PaperSurvey uses AI-powered handwriting recognition. IWR enhances this pipeline by:</p>
<ol>
<li>Processing the handwritten text through HTR first</li>
<li>Comparing results against your dictionary</li>
<li>Auto-correcting close matches</li>
<li>Flagging uncertain matches for review</li>
</ol>
<h2>Common use cases</h2>
<h3>Location questions</h3>
<pre><code>United States
United Kingdom
Canada
Australia
Germany</code></pre>
<h3>Course evaluations</h3>
<pre><code>Introduction to Psychology
Calculus I
Organic Chemistry
World History
English Literature</code></pre>
<h3>Product feedback</h3>
<pre><code>Model A-100
Model A-200
Model B-100
Premium Version
Standard Version</code></pre>
<h2>Monitoring and improvement</h2>
<h3>Review verification results</h3>
<ul>
<li>Check the Verify tab regularly</li>
<li>Look for patterns in unmatched responses; the Accepted Answers tab lists answers that do not match any rule and suggests similar answers that appear repeatedly, which you can accept with one click</li>
<li>Add frequently occurring responses to your dictionary</li>
<li>Enable <strong>Strict</strong> mode on a question to always flag answers that are not in your accepted list for manual review</li>
</ul>
<h3>Optimize your rules</h3>
<ul>
<li>Remove rarely used entries</li>
<li>Combine similar variations</li>
<li>Adjust matching methods based on accuracy</li>
</ul>
<p>IWR significantly reduces manual verification time while maintaining data accuracy. Start with your most common responses and refine the dictionary as you collect more data.</p>]]>
            </summary>
                                    <updated>2026-07-18T07:29:35+00:00</updated>
        </entry>
            <entry>
            <title><![CDATA[How Do I Add a Survey to My Phone's Home Screen?]]></title>
            <link rel="alternate" href="https://www.papersurvey.io/help/web-surveys/article/add-to-home" />
            <id>https://www.papersurvey.io/25</id>
            <author>
                <name><![CDATA[PaperSurvey.io]]></name>
            </author>
            <summary type="html">
                <![CDATA[<p>You can add your survey to your device's home screen for quick access. This creates a shortcut that opens your survey with a single tap, making it perfect for collecting multiple responses throughout the day without fumbling with a browser.</p>
<h2>Key Benefits</h2>
<p>When you add a survey to your home screen:</p>
<ul>
<li><strong>Instant access</strong> to your survey without opening a browser</li>
<li><strong>Faster response collection</strong> with one-tap access</li>
<li><strong>Seamless transitions</strong> using the "Next Participant" button to quickly start new responses</li>
<li><strong>Full-screen view</strong> that opens the survey on its own, without browser tabs or address bar</li>
</ul>
<h2>Adding to Android Devices</h2>
<p><img src="/images/blog/homescreen-android.jpg" alt="Android Add Survey To Home Screen" /></p>
<ol>
<li>Open your survey link in Chrome</li>
<li>Tap the menu button (three dots) in the top right corner</li>
<li>Select "Add to Home Screen"</li>
<li>Enter a name for your survey shortcut</li>
<li>Tap "Add"</li>
</ol>
<p>Your survey icon will appear on your home screen alongside your other apps.</p>
<h2>Adding to iOS Devices (iPhone/iPad)</h2>
<img src="/images/blog/add-to-home-ios.png" alt="iOS Add Survey To Home Screen" style="width:30%"/>
<ol>
<li>Open your survey link in Safari</li>
<li>Tap the Share button (square with arrow pointing up)</li>
<li>Scroll down and tap "Add to Home Screen"</li>
<li>Enter a name for your survey</li>
<li>Tap "Add" in the top right corner</li>
</ol>
<p>The survey will appear as an app icon on your home screen.</p>
<h2>Field Data Collection</h2>
<p>Before heading into the field, test the shortcut to make sure it works correctly. After each submission, the "Next Participant" button appears automatically, eliminating the need to refresh. If you have a team collecting data, consider adding shortcuts to multiple devices so everyone can work simultaneously.</p>]]>
            </summary>
                                    <updated>2026-07-18T08:45:27+00:00</updated>
        </entry>
            <entry>
            <title><![CDATA[How to Add Images to Survey Forms]]></title>
            <link rel="alternate" href="https://www.papersurvey.io/help/form-design/article/how-to-add-images-in-survey-forms" />
            <id>https://www.papersurvey.io/26</id>
            <author>
                <name><![CDATA[PaperSurvey.io]]></name>
            </author>
            <summary type="html">
                <![CDATA[<p>Images make surveys more engaging and help respondents understand questions at a glance. Whether you need to add a company logo, product photos, diagrams, or visual instructions, PaperSurvey's Image Manager and shortcode system make it straightforward.</p>
<p><img src="/images/blog/image-manager.png" alt="Image manager for surveys" /></p>
<p><em>Note: Image functionality requires an Enterprise plan or higher.</em></p>
<h2>Step-by-step guide</h2>
<h3>1. Access the Image Manager</h3>
<p>Navigate to the <a href="https://www.papersurvey.io/app/images">Image Manager</a> from your dashboard, or click <strong>More</strong> then <strong>Image Manager</strong> in the top menu.</p>
<h3>2. Upload your images</h3>
<ul>
<li>Drag images into the upload area, or click it to select files</li>
<li>Supported formats: JPG, PNG</li>
<li>Maximum file size: 10MB per image</li>
<li>Multiple images can be uploaded at once</li>
</ul>
<h3>3. Get the image shortcode</h3>
<p>After uploading, each image card shows a ready-made shortcode such as <code>[img width=5 center]my-image[/img]</code>. Use the copy icon on the card to copy it to your clipboard.</p>
<h3>4. Add images to your survey</h3>
<ol>
<li>Open your survey in the form builder</li>
<li>Place your cursor where you want the image</li>
<li>Paste the shortcode</li>
<li>The image appears when you preview or print</li>
</ol>
<h2>Image sizing options</h2>
<h3>Quick presets</h3>
<ul>
<li><code>[img]my-image[/img]</code> for full page width</li>
<li><code>[img width=half]my-image[/img]</code> for 50% of page width</li>
<li><code>[img width=third]my-image[/img]</code> for a third (30%) of page width</li>
</ul>
<h3>Custom sizes</h3>
<p>Specify exact dimensions in centimeters:</p>
<ul>
<li><code>[img width=5 height=3]my-image[/img]</code> for 5cm wide by 3cm tall</li>
<li><code>[img width=10]my-image[/img]</code> for 10cm wide (height auto-scales)</li>
</ul>
<h3>Positioning</h3>
<p>Add <code>center</code> to center any image:</p>
<ul>
<li><code>[img width=5 height=3 center]my-image[/img]</code></li>
</ul>
<p>You can also place an image at an exact position on the page by adding <code>x</code> and <code>y</code> coordinates in centimeters, measured from the top left corner of the page:</p>
<ul>
<li><code>[img width=5 x=2 y=3]my-image[/img]</code></li>
</ul>
<h2>Where to place images</h2>
<p>Images can be added in multiple locations throughout your survey:</p>
<ul>
<li><strong>Survey header</strong> for your logo or branding</li>
<li><strong>Question text</strong> to show examples or visual aids</li>
<li><strong>Instructions section</strong> to provide visual guidance</li>
<li><strong>Between questions</strong> to break up long surveys</li>
</ul>
<h2>Common uses</h2>
<ul>
<li><strong>Branding:</strong> Company logos in headers</li>
<li><strong>Product feedback:</strong> Show items being evaluated</li>
<li><strong>Visual scales:</strong> Display rating examples (smiley faces, stars)</li>
<li><strong>Instructions:</strong> Include annotated screenshots</li>
<li><strong>Location surveys:</strong> Add maps or floor plans</li>
<li><strong>Medical forms:</strong> Show body diagrams for pain assessment</li>
</ul>]]>
            </summary>
                                    <updated>2026-07-17T12:49:14+00:00</updated>
        </entry>
            <entry>
            <title><![CDATA[Creating Multi-Language Paper Surveys]]></title>
            <link rel="alternate" href="https://www.papersurvey.io/help/form-design/article/multi-language-paper-surveys" />
            <id>https://www.papersurvey.io/27</id>
            <author>
                <name><![CDATA[PaperSurvey.io]]></name>
            </author>
            <summary type="html">
                <![CDATA[<p>Collecting survey data across different language groups usually means juggling separate forms and merging datasets manually. PaperSurvey simplifies this by letting you create one survey with multiple translations, where all responses flow into a single database for seamless analysis regardless of language.</p>
<p><img src="/images/blog/Multilingual-Paper-Survey.gif" alt="Multilingual Paper Surveys" /></p>
<p><em>Note: Multi-language functionality requires an Enterprise plan or higher. Academic plans for universities also include it.</em></p>
<h2>How multi-language surveys work</h2>
<p>With multi-language surveys, you can:</p>
<ul>
<li>Create one survey with multiple translations</li>
<li>Collect responses from different language versions</li>
<li>Analyze all data together without manual merging</li>
<li>Maintain consistent question structure across languages</li>
</ul>
<h2>Setting up additional languages</h2>
<ol>
<li>Create your survey in the primary language first</li>
<li>Navigate to <strong>Survey Settings</strong></li>
<li>Find the <strong>Additional languages</strong> field in the General section</li>
<li>Select the languages you want to add</li>
<li>Save your settings</li>
</ol>
<p>PaperSurvey supports 40 languages, including right-to-left scripts such as Arabic and Farsi.</p>
<h2>Translation options</h2>
<h3>Automatic translation</h3>
<p>Click <strong>Auto-translate</strong> next to the Additional languages field in Survey Settings to generate any missing translations using Google Translate. This is useful for creating initial drafts, but you should review and refine automated translations before distributing your survey. Automatic translation is available for most major languages.</p>
<h3>Manual translation</h3>
<ol>
<li>Use the language switcher at the top-right of the survey menu</li>
<li>Select your target language</li>
<li>Edit each question's translation directly</li>
<li>Preview to ensure proper formatting</li>
</ol>
<p><img src="/images/blog/additional-languages.png" alt="Language switcher" /></p>
<h2>Printing language versions</h2>
<p>To print a specific language version:</p>
<ol>
<li>Select the desired language from the switcher</li>
<li>Open the <strong>Preview</strong> or <strong>Print</strong> tab</li>
<li>The PDF will generate in the selected language</li>
<li>Print or save as needed</li>
</ol>
<h2>Data collection benefits</h2>
<p>All language versions share a unified response database, combined analytics and exports, and consistent validation rules. This eliminates the need to merge separate datasets and ensures comprehensive analysis across all respondent groups.</p>]]>
            </summary>
                                    <updated>2026-07-17T12:49:14+00:00</updated>
        </entry>
            <entry>
            <title><![CDATA[PaperSurvey + Google Sheets Integration]]></title>
            <link rel="alternate" href="https://www.papersurvey.io/help/integrations/article/papersurvey-google-sheets-integration" />
            <id>https://www.papersurvey.io/28</id>
            <author>
                <name><![CDATA[PaperSurvey.io]]></name>
            </author>
            <summary type="html">
                <![CDATA[<p><img src="/images/blog/sheets.jpg" alt="PaperSurvey + Google Sheets" /></p>
<p>Connecting PaperSurvey to Google Sheets gives you real-time access to your survey data in a format your entire team already knows how to use. Every new response automatically syncs to your spreadsheet, creating a live data feed you can analyze, share, and build upon without ever needing to run a manual export.</p>
<h2>How the integration works</h2>
<p>Once connected, PaperSurvey creates and maintains a Google Sheet with your survey data:</p>
<ul>
<li>New and updated responses are written to the spreadsheet automatically shortly after processing</li>
<li>Data updates automatically as surveys are completed</li>
<li>All question responses are organized in columns</li>
<li>Metadata like submission time and respondent ID are included</li>
</ul>
<p>The spreadsheet remains synchronized with your PaperSurvey account, providing always-current data without manual exports.</p>
<h2>Setting up Google Sheets sync</h2>
<ol>
<li>Navigate to your Survey Settings page for the survey you want to sync</li>
<li>Look for the Google Sheets integration section</li>
<li>Click "Connect" with Google Sheets and connect a Google account (you can connect more than one account and choose between them)</li>
<li>Name the spreadsheet and click "Create spreadsheet". It is created in that account's Google Drive.</li>
</ol>
<p>PaperSurvey can only access the spreadsheets it creates for you. Everything else in your Google Drive stays private and is never read.</p>
<p>Your data will begin populating immediately, with new responses added as they are processed.</p>
<h2>Powerful use cases</h2>
<h3>Real-time dashboards</h3>
<p>Connect your synced sheet to Google Data Studio or other visualization tools. Build interactive dashboards that update automatically as new surveys come in, perfect for monitoring ongoing research or feedback campaigns.</p>
<h3>Advanced calculations</h3>
<p>Create additional sheets in the same workbook to:</p>
<ul>
<li>Calculate running averages and trends</li>
<li>Build pivot tables for cross-tabulation</li>
<li>Apply custom formulas for scoring or analysis</li>
<li>Generate summary statistics by date, location, or respondent group</li>
</ul>
<h3>Team collaboration</h3>
<p>Share the Google Sheet with stakeholders who need data access without PaperSurvey accounts. Set view-only permissions to ensure data integrity while keeping everyone informed.</p>
<h3>Business intelligence integration</h3>
<p>Use the sheet as a data source for:</p>
<ul>
<li>Tableau, Power BI, or other BI platforms</li>
<li>Automated reporting workflows</li>
<li>Integration with CRM or analytics systems</li>
<li>Custom applications via Google Sheets API</li>
</ul>
<h2>Understanding sync behavior</h2>
<h3>Update frequency</h3>
<ul>
<li>New data typically appears within 2-5 minutes</li>
<li>The "Last updated" timestamp in the Google Sheets settings shows when data was last synchronized, and a "Sync now" button lets you trigger a full refresh at any time</li>
</ul>
<h3>Data structure</h3>
<p>Your synced sheet includes:</p>
<ul>
<li>One row per survey response on the Data tab</li>
<li>Columns for each survey question</li>
<li>System fields such as the response number, page count, upload time, filenames, and tags</li>
<li>A link back to each response in PaperSurvey</li>
</ul>
<p>Alongside the Data tab, the spreadsheet includes an Information tab with ready-to-copy formula examples, a Summary tab with automatically updating counts and percentages for each question, and a Charts tab with a ready-made chart per question. When coded column formats are used, a Codes tab lists what each code means. These tabs are maintained by PaperSurvey, so keep your own analysis on separate tabs.</p>
<h3>Customizing columns</h3>
<p>Click "Customize columns" in the Google Sheets settings to rename, reorder, or hide columns, and to choose how each closed question is written: as the actual answer text, recoded numeric values, or text coded values. You can also save your configuration as the default for future surveys on your team.</p>
<h3>Handling changes</h3>
<p>If you modify your survey structure, open the Google Sheets settings and click "Sync now". The spreadsheet is rewritten to match your current survey design, with new questions appearing as new columns.</p>
<h2>Availability and limits</h2>
<p>This integration is available to all PaperSurvey users at no additional cost. While there are no usage fees, be aware of these technical limits:</p>
<ul>
<li>Google Sheets maximum: 10 million cells per spreadsheet</li>
<li>During high-volume periods, syncing may be delayed</li>
</ul>
<p>Need help setting up advanced workflows? Our support team can provide guidance on optimizing your Google Sheets integration for your specific use case.</p>]]>
            </summary>
                                    <updated>2026-07-18T07:29:35+00:00</updated>
        </entry>
            <entry>
            <title><![CDATA[Can I Collect Both Paper and Web Responses for the Same Survey?]]></title>
            <link rel="alternate" href="https://www.papersurvey.io/help/web-surveys/article/collecting-responses-in-paper-and-web-surveys" />
            <id>https://www.papersurvey.io/29</id>
            <author>
                <name><![CDATA[PaperSurvey.io]]></name>
            </author>
            <summary type="html">
                <![CDATA[<p>PaperSurvey allows you to collect responses through both paper forms and web surveys simultaneously. All responses are stored in a unified database, making it easy to analyze your complete dataset regardless of how it was collected. This hybrid approach ensures you can reach every participant, whether they prefer paper or digital formats.</p>
<h2>Benefits of Hybrid Data Collection</h2>
<p>Combining paper and web collection methods offers significant advantages:</p>
<ul>
<li><strong>Reach everyone</strong>: Include participants without internet access or those who prefer paper forms</li>
<li><strong>Unified data</strong>: All responses stored in one place for seamless analysis</li>
<li><strong>Flexible deployment</strong>: Switch between methods based on your situation</li>
<li><strong>Consistent formatting</strong>: Web forms match your paper survey design exactly</li>
</ul>
<h2>How It Works</h2>
<ol>
<li><strong>Create your survey</strong>: Design your survey once in PaperSurvey</li>
<li><strong>Enable both channels</strong>: Print PDFs for paper distribution and activate web surveys</li>
<li><strong>Collect responses</strong>: Participants can complete either version</li>
<li><strong>Analyze together</strong>: Export all data in a single file for analysis</li>
</ol>
<h2>Multilingual Data Collection</h2>
<p>PaperSurvey's multilingual support makes it ideal for international research:</p>
<ul>
<li>Create surveys in any language</li>
<li>Distribute different language versions as needed</li>
<li>Export all responses to a single spreadsheet</li>
<li>Compare responses across language groups easily</li>
</ul>
<p>This eliminates the complexity of managing separate datasets for each language.</p>
<h2>Real-World Use Cases</h2>
<p><strong>Field research</strong>: Collect paper surveys in remote areas, web surveys in urban centers.</p>
<p><strong>Healthcare studies</strong>: Paper forms in clinics, web forms for follow-ups at home.</p>
<p><strong>Educational assessments</strong>: Paper tests in classrooms, online make-up exams.</p>
<p><strong>Market research</strong>: Mall intercepts with tablets, email invitations with web links.</p>
<h2>Important Considerations</h2>
<p>PaperSurvey focuses on maintaining consistency between paper and web formats. Skip Logic works on both web and paper, so questions can show, hide, or end the survey based on earlier answers, but there are a few limits:</p>
<ul>
<li>Conditions can only reference an earlier single-choice or multiple-choice question</li>
<li>Up to five conditions per question, combined with AND or OR rules</li>
<li>No arbitrary jump routing from one question straight to another later question</li>
</ul>
<p>On paper, Skip Logic is printed as instructions such as "If you answered YES to Question 5, skip to Section B," while on the web form matching questions are shown or hidden automatically.</p>]]>
            </summary>
                                    <updated>2026-07-18T08:45:27+00:00</updated>
        </entry>
            <entry>
            <title><![CDATA[How Are Duplicate Uploads Detected?]]></title>
            <link rel="alternate" href="https://www.papersurvey.io/help/recognition/article/how-duplicate-uploads-detected" />
            <id>https://www.papersurvey.io/30</id>
            <author>
                <name><![CDATA[PaperSurvey.io]]></name>
            </author>
            <summary type="html">
                <![CDATA[<p>Uploading the same scanned survey twice would double-count responses and skew your results. PaperSurvey detects duplicates automatically using two methods that work independently.</p>
<p><img src="/images/blog/duplicate.jpeg" alt="duplicate surveys" /></p>
<h2>Unique page identifiers</h2>
<p>When <a href="/help/printing/article/unique-paper-survey-identifiers">unique identifiers</a> are enabled, each printed page carries a unique page ID, a page number, and a survey ID encoded in its QR codes. On upload, the system checks whether a page with those exact identifiers has already been processed. If it has, the page is flagged as a duplicate.</p>
<p>This catches both re-uploads of the same file and re-scans of the same physical page. If your survey also collects responses through the web form, a paper upload whose response was already submitted online is flagged the same way to avoid double counting.</p>
<h3>False positives</h3>
<p>Legitimate pages can be flagged when multiple copies are printed from the same PDF, because they share the same identifiers. When this happens you can retry processing to treat the flagged pages as new responses, or enable "Allow duplicates" in survey settings to skip identifier checking entirely.</p>
<h2>File hash comparison</h2>
<p>Before processing any document, the system calculates a SHA-1 hash of each page and compares it against all previously uploaded pages. If an exact match is found, the page is blocked. The uploaded file as a whole is also checked, so re-uploading a previously processed document is caught before any page is scanned. This works for all surveys with no configuration needed.</p>
<p>Because the hash is based on the exact file data, re-scanning the same page produces a different hash. This method only catches identical digital copies, such as uploading the same PDF twice.</p>
<h2>Reviewing flagged duplicates</h2>
<p>Pages flagged by unique identifier checking appear in the Duplicates section of your survey's Uploads page. You can review each one, then either press "Process duplicates" to accept the selected pages as new responses or press "Mark Resolved" to note that you have reviewed them. File hash duplicates are blocked automatically and cannot be retried, since the pages are identical.</p>]]>
            </summary>
                                    <updated>2026-07-18T07:29:35+00:00</updated>
        </entry>
            <entry>
            <title><![CDATA[Can I Use My Own Domain for Web Surveys?]]></title>
            <link rel="alternate" href="https://www.papersurvey.io/help/web-surveys/article/custom-survey-domain-or-subdomain" />
            <id>https://www.papersurvey.io/31</id>
            <author>
                <name><![CDATA[PaperSurvey.io]]></name>
            </author>
            <summary type="html">
                <![CDATA[<p>Enterprise Plus subscribers can use custom domains for their web surveys, allowing you to maintain consistent branding throughout the survey experience. Instead of the default PaperSurvey URL, respondents will see your organization's own domain, which builds trust and reinforces your brand identity.</p>
<h2>Understanding Your Options</h2>
<p><strong>Default URL</strong>: <code>papersurvey.io/s/30pk2m</code></p>
<ul>
<li>You can customize the ending (e.g., "30pk2m") if available</li>
<li>Works immediately without configuration</li>
<li>Suitable for most survey needs</li>
</ul>
<p><strong>Custom domain</strong>: <code>survey.yourcompany.com</code></p>
<ul>
<li>Requires Enterprise Plus subscription</li>
<li>Maintains your brand identity</li>
<li>Requires DNS configuration</li>
</ul>
<p>Both URLs remain active after setup, giving you flexibility in how you share your survey.</p>
<h2>Setting Up Your Custom Domain</h2>
<h3>Step 1: Choose Your Domain Structure</h3>
<p>You have three options for how your survey URL will appear:</p>
<ol>
<li>
<p><strong>Subdomain</strong> (recommended): <code>survey.yourcompany.com</code></p>
<ul>
<li>Easiest to set up</li>
<li>Does not affect your main website</li>
<li>Requires one DNS record</li>
</ul>
</li>
<li>
<p><strong>Top-level domain</strong>: <code>yourcompany.com</code> or <code>www.yourcompany.com</code></p>
<ul>
<li>Uses your main domain</li>
<li>Requires two DNS records</li>
<li>May conflict with existing website</li>
</ul>
</li>
<li>
<p><strong>Full domain parking</strong>: All subdomains point to PaperSurvey</p>
<ul>
<li>Best for dedicated survey domains</li>
<li>Allows multiple surveys without DNS changes</li>
<li>Requires wildcard DNS record</li>
</ul>
</li>
</ol>
<h3>Step 2: Configure DNS Records</h3>
<p>Share these instructions with your IT team to update your DNS settings:</p>
<table>
<thead>
<tr>
<th>Setup Type</th>
<th>Host/Name</th>
<th>Record Type</th>
<th>Value</th>
<th>TTL</th>
</tr>
</thead>
<tbody>
<tr>
<td><strong>Subdomain</strong></td>
<td>survey</td>
<td>CNAME</td>
<td>domain.papersurvey.io</td>
<td>3600</td>
</tr>
<tr>
<td><strong>Top-level</strong></td>
<td>www or @</td>
<td>CNAME or A</td>
<td>domain.papersurvey.io or 188.166.134.131</td>
<td>3600</td>
</tr>
<tr>
<td><strong>Full parking</strong></td>
<td>* or @</td>
<td>CNAME or A</td>
<td>domain.papersurvey.io or 188.166.134.131</td>
<td>3600</td>
</tr>
</tbody>
</table>
<h3>Step 3: Add Domain in PaperSurvey</h3>
<ol>
<li>Navigate to your <a href="/app/settings/domains">custom domains settings</a></li>
<li>Click "Add New Domain"</li>
<li>Enter your domain exactly as it will appear</li>
<li>Save your settings</li>
</ol>
<p>DNS changes typically take 15-60 minutes to propagate worldwide.</p>
<h2>Customizing Your Survey Appearance</h2>
<p>Once your domain is active, you can further customize the survey:</p>
<p><strong>Custom CSS</strong>: Add your own styles to match your brand. You can change colors, fonts, and spacing, override default styles, and maintain consistency with your website.</p>
<p><strong>Logo and branding</strong>: Include your organization's visual identity by adding your logo to the survey header, customizing colors to match brand guidelines, and creating a seamless brand experience.</p>
<h2>Security Features Included</h2>
<p>Every custom domain automatically includes:</p>
<ul>
<li><strong>SSL/TLS encryption</strong>: Secure data transmission</li>
<li><strong>Let's Encrypt certificate</strong>: Free, auto-renewing security</li>
<li><strong>HTTPS enforcement</strong>: All traffic encrypted</li>
<li><strong>No additional costs</strong>: Security included with Enterprise Plus</li>
</ul>
<p><img src="/images/blog/domain-list.png" alt="Domain List" /></p>
<p>View a working example: <a href="https://survey.lite.lt">survey.lite.lt</a> (custom domain) vs <a href="https://www.papersurvey.io/s/30pk2m">papersurvey.io/s/30pk2m</a> (default URL)</p>]]>
            </summary>
                                    <updated>2026-03-29T04:30:48+00:00</updated>
        </entry>
            <entry>
            <title><![CDATA[How to Create Booklet Surveys]]></title>
            <link rel="alternate" href="https://www.papersurvey.io/help/printing/article/booklet-surveys" />
            <id>https://www.papersurvey.io/32</id>
            <author>
                <name><![CDATA[PaperSurvey.io]]></name>
            </author>
            <summary type="html">
                <![CDATA[<p>PaperSurvey supports booklet-style surveys that allow you to create compact, professional questionnaires by folding pages in half. Booklets are easier for respondents to handle and make efficient use of paper, giving your surveys a polished, professional look.</p>
<h2>What Are Booklet Surveys?</h2>
<p>Booklet surveys transform standard pages into folded questionnaires. When folded, each page creates two surfaces for questions, making efficient use of paper while providing a more professional appearance.</p>
<h2>Printing Options and Requirements</h2>
<p>You have two paper size options for booklet surveys.</p>
<h3>A4 Paper (Most Common)</h3>
<ul>
<li>Survey is automatically scaled down to A5 format when printed</li>
<li>Recognition software automatically upscales during processing</li>
<li>Works with any standard A4 scanner</li>
</ul>
<h3>A3 Paper</h3>
<ul>
<li>Creates full-size A4 pages when folded</li>
<li><strong>Important</strong>: Requires access to an A3 scanner, or you will need to cut pages in half before scanning</li>
</ul>
<h2>Creating Your Booklet Survey</h2>
<p>Creating a booklet survey is straightforward:</p>
<ol>
<li>Design your survey normally in PaperSurvey</li>
<li>Use page breaks to separate content for each booklet page</li>
<li>Download the PDF file</li>
<li>In your printer settings, set <strong>"Pages per sheet"</strong> to 2</li>
<li>Print and fold each page in half</li>
</ol>
<p>For multi-page booklets, staple pages together for distribution but remember to remove staples before scanning.</p>
<p><br /></p>
<img src="/images/blog/booklet-print.png" alt="Booklet printing settings example" >
<h2>Scanning and Uploading Booklet Surveys</h2>
<p>Since PaperSurvey processes one page at a time, booklet pages need to be split before recognition. You have several options.</p>
<h3>Automatic Splitting (Recommended)</h3>
<ol>
<li><strong>Enable "Booklet scanning"</strong> in general settings to automatically split all uploads for all surveys</li>
<li><strong>Add [a5] to filename</strong> to only split specific files (example: survey<em>responses</em>[a5].pdf)</li>
</ol>
<h3>Manual Splitting</h3>
<ul>
<li>Cut pages physically with scissors before scanning</li>
<li>Split pages digitally using PDF editing software</li>
</ul>
<p>Automatic splitting only works with PDF files. Image files (JPG, PNG) must be split manually.</p>
<p><br /></p>
<img src="/images/blog/booklet-scanning.png" alt="Booklet scanning settings" >]]>
            </summary>
                                    <updated>2026-03-29T04:30:48+00:00</updated>
        </entry>
            <entry>
            <title><![CDATA[Can I Create a Survey Smaller Than Full Paper?]]></title>
            <link rel="alternate" href="https://www.papersurvey.io/help/form-design/article/can-i-create-survey-smaller-than-full-paper" />
            <id>https://www.papersurvey.io/37</id>
            <author>
                <name><![CDATA[PaperSurvey.io]]></name>
            </author>
            <summary type="html">
                <![CDATA[<p>Not every survey needs a full-size sheet of paper. Short questionnaires, feedback forms, and quick polls often work better on smaller formats. PaperSurvey supports multiple paper sizes so you can match the format to the complexity of your survey.</p>
<p><strong>Important:</strong> Your account can only use one paper size setting at a time. All surveys in your account will use the same paper format. To change the paper size, update your account settings, and the change will apply to all surveys.</p>
<h2>Available paper formats</h2>
<p>PaperSurvey offers the following paper size options:</p>
<ul>
<li><strong>A4</strong> (210 x 297 mm) for the standard international size</li>
<li><strong>A5</strong> (148 x 210 mm), which is half of A4 and ideal for brief surveys</li>
<li><strong>A3</strong> (297 x 420 mm), double A4 size, suited for complex surveys</li>
<li><strong>Letter</strong> (8.5 x 11 inches) for the standard US size</li>
<li><strong>Legal</strong> (8.5 x 14 inches), the extended US format for longer forms</li>
</ul>
<p><img src="/images/blog/available-paper-formats.png" alt="Available paper formats" /></p>
<h2>Setting up a different paper size</h2>
<ol>
<li>Go to <strong>Settings</strong> and open the <strong>Personal</strong> tab</li>
<li>Select your desired paper format from the <strong>Paper size</strong> dropdown</li>
<li>Save your settings (this applies to all surveys)</li>
<li>The form builder will automatically adjust layouts for all surveys</li>
<li>Preview your designs to ensure all questions fit properly</li>
</ol>
<p>On multi-user teams, the paper size option appears on your team settings page (the tab named after your team) instead of the Personal tab, and only team owners and managers can change it.</p>
<p>Choose a paper size that gives respondents enough room to answer comfortably while keeping your survey concise and easy to handle.</p>]]>
            </summary>
                                    <updated>2026-07-17T12:49:14+00:00</updated>
        </entry>
            <entry>
            <title><![CDATA[Can I Disable Help Text on Survey Questions?]]></title>
            <link rel="alternate" href="https://www.papersurvey.io/help/form-design/article/can-i-disable-help-text" />
            <id>https://www.papersurvey.io/38</id>
            <author>
                <name><![CDATA[PaperSurvey.io]]></name>
            </author>
            <summary type="html">
                <![CDATA[<p>Every survey question in PaperSurvey includes default help text that guides respondents on how to mark their answers. You can disable this default text or replace it with custom instructions. However, removing instructions can significantly impact response accuracy, so it is worth understanding the trade-offs before making changes.</p>
<h2>Why help text matters for accurate responses</h2>
<p>Without clear instructions, respondents face several problems:</p>
<ol>
<li><strong>Uncertainty about how to respond.</strong> They will not know whether to select one or multiple options.</li>
<li><strong>Confusion about marking method.</strong> Should they check, cross, or fill the bubble?</li>
<li><strong>Risk of missed responses.</strong> Checkmarks can sometimes be written outside the answer box when people respond quickly, leading to unrecorded answers.</li>
</ol>
<h3>Recommended marking methods</h3>
<ul>
<li><strong>Cross (X)</strong> is the most reliable, as it is harder to miss the box</li>
<li><strong>Fill in bubble</strong> is clear and consistent</li>
<li><strong>Avoid checkmarks</strong> as they can easily extend outside the box</li>
</ul>
<h2>Removing default help text</h2>
<p>If you still want to remove the default instructions:</p>
<ol>
<li>Open your survey in the form builder</li>
<li>Navigate to <strong>Survey Settings</strong></li>
<li>In the <strong>Help Text</strong> section, toggle <strong>"Default help text"</strong> to OFF</li>
<li>Save your changes</li>
</ol>
<p><img src="/images/blog/disable-help-text.png" alt="Disable help text" /></p>
<p>Only remove help text if you are certain respondents understand how to complete your survey.</p>
<h2>Adding custom help text</h2>
<p>Each question can have its own custom instructions:</p>
<ol>
<li>Select any question in your survey</li>
<li>Find the <strong>"Extra help text"</strong> field</li>
<li>Enter your custom instructions</li>
<li>The text will appear below the question</li>
</ol>
<p><img src="/images/blog/update-help-text.png" alt="Update help text" /></p>
<h2>Other help text display options</h2>
<p>The <strong>Help Text</strong> section in Survey Settings also lets you adjust how help text looks:</p>
<ul>
<li><strong>Help text alignment</strong> places the help text on the left or right side of the page</li>
<li><strong>Italic help text</strong> displays all help text in an italic style</li>
<li><strong>Show in Web Surveys</strong> also displays help text in the web version of your survey (available when web surveys are enabled)</li>
</ul>
<h2>Best practices for help text</h2>
<h3>Always include instructions when:</h3>
<ul>
<li>The question is multiple choice (respondents need to know they can select several)</li>
<li>You are using rating scales or grids</li>
<li>The question format might be ambiguous</li>
<li>You are working with general public audiences</li>
</ul>
<h3>Consider custom help text for:</h3>
<ul>
<li>Specifying an exact number of selections (e.g., "Select your top 3 choices")</li>
<li>Clarifying marking preferences (e.g., "Mark with X")</li>
<li>Adding examples or context</li>
<li>Providing special instructions for complex questions</li>
</ul>
<h3>Only remove help text when:</h3>
<ul>
<li>Running internal surveys with trained staff</li>
<li>Questions are extremely simple (yes/no with an obvious single selection)</li>
<li>You have tested thoroughly and confirmed there is no confusion</li>
</ul>
<h2>Examples of effective help text</h2>
<p>Instead of removing help text entirely, consider replacing it with concise, clear instructions:</p>
<ul>
<li>"Mark one box with X"</li>
<li>"Mark all that apply with X"</li>
<li>"Fill in the bubble completely"</li>
<li>"Select only your top choice"</li>
</ul>
<p>A few words of instruction can prevent hundreds of unusable responses.</p>]]>
            </summary>
                                    <updated>2026-07-17T12:49:14+00:00</updated>
        </entry>
            <entry>
            <title><![CDATA[Can PaperSurvey Create a Survey for Me?]]></title>
            <link rel="alternate" href="https://www.papersurvey.io/help/form-design/article/can-papersurvey-create-survey-for-me" />
            <id>https://www.papersurvey.io/39</id>
            <author>
                <name><![CDATA[PaperSurvey.io]]></name>
            </author>
            <summary type="html">
                <![CDATA[<p>Designing an effective paper survey requires careful thought about question structure, layout optimization, and OCR compatibility. If you need expert assistance, our team offers professional survey design services for organizations of all sizes.</p>
<h2>Build a survey automatically from your document</h2>
<p>If you already have a questionnaire written up, PaperSurvey can convert it into a survey for you. Create a new survey and, on the empty question list, choose <strong>Setup from Text, Word or PDF</strong>. Upload a TXT, DOCX, or PDF file (up to 10MB), or paste your questions as text, select the language, and click <strong>Import</strong>. Questions, answer options, and basic settings are extracted automatically.</p>
<p>Review the imported survey afterwards, as typically some manual adjustments are needed. Imports are limited to 15 per day (3 per day during the trial).</p>
<h2>What we offer</h2>
<p>Our survey design service includes:</p>
<ul>
<li>Professional questionnaire development</li>
<li>Optimal layout for paper scanning</li>
<li>Question type selection and formatting</li>
<li>Multi-language survey setup</li>
<li>Custom branding integration</li>
<li>Testing and validation</li>
</ul>
<h2>Who benefits from this service</h2>
<p>Custom design services work well for organizations without survey design experience, high-stakes research projects, large-scale data collection initiatives, time-sensitive deployments, and complex multi-page surveys.</p>]]>
            </summary>
                                    <updated>2026-07-17T12:49:14+00:00</updated>
        </entry>
            <entry>
            <title><![CDATA[How to Control Text Alignment for Grid Questions]]></title>
            <link rel="alternate" href="https://www.papersurvey.io/help/form-design/article/how-do-you-left-align" />
            <id>https://www.papersurvey.io/40</id>
            <author>
                <name><![CDATA[PaperSurvey.io]]></name>
            </author>
            <summary type="html">
                <![CDATA[<p>Text alignment controls where question text appears on the page relative to the answer checkboxes. Adjusting alignment can improve readability and visual flow, especially for grid-style questions. PaperSurvey lets you set a default alignment for all grid questions and customize individual grid questions as needed.</p>
<h2>Setting default text alignment</h2>
<ol>
<li>Open your survey in the form builder</li>
<li>Navigate to <strong>Survey Settings</strong> from the menu</li>
<li>Find the <strong>"Text alignment"</strong> setting</li>
<li>Choose between:<ul>
<li><strong>Left</strong> to align all question text to the left</li>
<li><strong>Right</strong> to align all question text to the right</li>
</ul>
</li>
</ol>
<p><img src="/images/blog/grid-settings.png" alt="Survey Settings Page" /></p>
<h2>Customizing grid questions individually</h2>
<p>Single-choice and multiple-choice grid questions can be aligned individually, regardless of your default setting:</p>
<ol>
<li>Click on any single-choice or multiple-choice grid question</li>
<li>In the question properties panel, find the <strong>Align</strong> switch</li>
<li>Choose your preferred alignment for that specific question</li>
</ol>
<p>This flexibility allows you to optimize readability for different question types within the same survey.</p>
<h2>Understanding alignment options</h2>
<p>The alignment setting controls where question text appears on the page:</p>
<ul>
<li><strong>Left alignment</strong> places questions on the left side of the page, with answer checkboxes to the right</li>
<li><strong>Right alignment</strong> places questions on the right side, positioned next to the answer checkboxes</li>
</ul>
<p>Choose an alignment based on your design preferences and the visual flow you want respondents to follow through each question.</p>]]>
            </summary>
                                    <updated>2026-07-17T12:49:14+00:00</updated>
        </entry>
            <entry>
            <title><![CDATA[How to Add Instructions to Your Survey]]></title>
            <link rel="alternate" href="https://www.papersurvey.io/help/form-design/article/how-to-add-instructions-to-survey" />
            <id>https://www.papersurvey.io/41</id>
            <author>
                <name><![CDATA[PaperSurvey.io]]></name>
            </author>
            <summary type="html">
                <![CDATA[<p>Clear instructions help respondents complete your survey correctly on the first attempt. PaperSurvey allows you to add custom instructions in multiple locations, from page footers to individual questions, ensuring participants understand how to answer each question type.</p>
<h2>Adding footer instructions</h2>
<p><img src="/images/blog/settings-paper-survey.png" alt="Paper Survey settings with footer fields" /></p>
<p>The footer area provides space for general survey instructions that appear on every page:</p>
<ol>
<li>Navigate to <strong>Survey Settings</strong> and find the <strong>Footer</strong> fields in the Paper Survey section</li>
<li>Enter text in any of the three fields:<ul>
<li><strong>Left</strong> for instructions on the left side. Text here replaces the default "To respond" marking instructions.</li>
<li><strong>Center</strong> for central instructions. Text here appears in place of the footer logo and is available on plans that include branding customization.</li>
<li><strong>Right</strong> for right-side instructions, placed between the logo and the page QR code.</li>
</ul>
</li>
<li>Save your changes</li>
</ol>
<h2>Using instruction shortcodes</h2>
<p>PaperSurvey provides visual shortcodes to demonstrate how respondents should mark their responses:</p>
<ul>
<li><code>[check]</code> shows a checked box</li>
<li><code>[filled]</code> shows a completely filled-in box (used to cancel a mark in the fill-to-unmark recognition mode)</li>
<li><code>[correct]</code> shows a corrected box</li>
<li><code>[multicheck]</code> and <code>[singlecheck]</code> show checked multiple-choice and single-choice boxes</li>
</ul>
<p>These shortcodes render as visual examples in the printed survey, making it immediately clear how to respond.</p>
<h2>Where to add instructions</h2>
<p>Beyond footers, consider adding instructions in these locations:</p>
<ul>
<li><strong>Survey introduction</strong> for an overview and general guidelines</li>
<li><strong>Section headers</strong> for instructions specific to a question group</li>
<li><strong>Description blocks</strong> for standalone guidance text anywhere in the form</li>
<li><strong>Individual questions</strong> using the "Extra help text" field</li>
<li><strong>Thank you message</strong> for next steps or submission guidance</li>
</ul>
<p>For longer introductions, Survey Settings also offers a <strong>Cover Page</strong> section. You can upload a cover image or switch on <strong>Use text instead</strong> to write a text-only first page, which is printed without corner marks or footers since it does not need to be scanned.</p>]]>
            </summary>
                                    <updated>2026-07-17T12:49:14+00:00</updated>
        </entry>
            <entry>
            <title><![CDATA[How to Remove the PaperSurvey Logo]]></title>
            <link rel="alternate" href="https://www.papersurvey.io/help/form-design/article/how-to-delete-papersurvey-logo" />
            <id>https://www.papersurvey.io/42</id>
            <author>
                <name><![CDATA[PaperSurvey.io]]></name>
            </author>
            <summary type="html">
                <![CDATA[<p>Organizations often need surveys that carry only their own branding. The ability to remove the PaperSurvey logo depends on your subscription plan, allowing Enterprise customers to create fully white-labeled surveys.</p>
<h2>Logo removal by plan</h2>
<p><strong>Enterprise and Enterprise Plus</strong></p>
<ul>
<li>Logo is automatically removed</li>
<li>Full white-label capabilities</li>
<li>Add your own branding without restrictions</li>
</ul>
<p>Academic plans for universities also include these white-label capabilities.</p>
<p><strong>Standard Plan and Free Trial</strong></p>
<ul>
<li>Logo removal is not available</li>
<li>The PaperSurvey logo appears at the center of the footer on every printed page</li>
</ul>
<h2>Upgrading for logo removal</h2>
<p>To remove the PaperSurvey logo:</p>
<ol>
<li>Upgrade to Enterprise or Enterprise Plus</li>
<li>The logo automatically disappears from all surveys</li>
<li>No additional settings changes are required</li>
</ol>
<p>Once upgraded, you can leave the footer empty, <a href="/help/form-design/article/how-to-upload-logo">upload your own logo</a>, or add custom text in the Center footer field in its place.</p>
<p>Enterprise plans include additional benefits beyond logo removal, such as advanced features, priority support, and higher processing limits. Visit your account settings to explore upgrade options.</p>]]>
            </summary>
                                    <updated>2026-07-17T12:49:14+00:00</updated>
        </entry>
            <entry>
            <title><![CDATA[Does PaperSurvey Offer an API?]]></title>
            <link rel="alternate" href="https://www.papersurvey.io/help/integrations/article/does-papersurvey-offer-api" />
            <id>https://www.papersurvey.io/44</id>
            <author>
                <name><![CDATA[PaperSurvey.io]]></name>
            </author>
            <summary type="html">
                <![CDATA[<p>Yes, PaperSurvey provides a comprehensive REST API for developers who need programmatic access to their survey data and automation capabilities. If you want to integrate PaperSurvey into your existing systems or build custom workflows around survey data, the API makes that possible.</p>
<p>API functionality requires an Enterprise Plus plan.</p>
<h2>Getting started with the API</h2>
<p><img src="/images/blog/settings-developer-api.png" alt="Developer settings page" /></p>
<p>You can access your API credentials and documentation in your <a href="/app/settings/developer">Developer Settings</a>. This page provides:</p>
<ul>
<li>Your unique <strong>API key</strong> for authentication</li>
<li><strong>Interactive API documentation</strong> with all available endpoints</li>
</ul>
<p>Revealing your API key requires confirming your password, and you can generate a new key (roll it) at any time from the same page. The full interactive reference is also available as a separate page at <a href="https://papersurvey.io/developers">papersurvey.io/developers</a> after signing in.</p>
<h2>Common API use cases</h2>
<p>The PaperSurvey API enables you to:</p>
<ul>
<li><strong>Automate survey creation</strong>: Create and configure surveys programmatically</li>
<li><strong>Generate copies</strong>: Create PDFs for printing with unique page marking</li>
<li><strong>Export data in real-time</strong>: Retrieve survey responses as they're processed</li>
<li><strong>Manage uploads</strong>: Upload scanned documents directly via API</li>
<li><strong>Monitor processing status</strong>: Track page processing and get notifications</li>
<li><strong>Integrate with your systems</strong>: Build custom workflows with your existing tools</li>
</ul>
<h2>Authentication and security</h2>
<p>All API requests require authentication using your API key. Append it to the request as the <strong>api_token</strong> query parameter:</p>
<pre><code>https://api.papersurvey.io/surveys?api_token=YOUR_API_KEY</code></pre>
<p>Keep your API key secure and never expose it in client-side code or public repositories. If your account belongs to multiple teams, the API key acts on your currently selected team.</p>
<h2>Next steps</h2>
<p>Ready to integrate PaperSurvey into your workflow? Visit your <a href="/app/settings/developer">Developer Settings</a> to get started. For help with advanced integrations or higher rate limits, <a href="mailto:support@papersurvey.io">contact our support team</a>.</p>]]>
            </summary>
                                    <updated>2026-07-18T07:29:35+00:00</updated>
        </entry>
            <entry>
            <title><![CDATA[Can People Print Surveys on Different Printers?]]></title>
            <link rel="alternate" href="https://www.papersurvey.io/help/printing/article/can-people-print-surveys-on-different-filters" />
            <id>https://www.papersurvey.io/45</id>
            <author>
                <name><![CDATA[PaperSurvey.io]]></name>
            </author>
            <summary type="html">
                <![CDATA[<p>Respondents can print surveys on different printers. PaperSurvey is designed to handle variations in print quality and formatting, so surveys printed across a range of devices will generally work well. However, some printers may cause issues that affect recognition accuracy, so it helps to be aware of the common pitfalls.</p>
<h2>Common Printer-Related Issues</h2>
<p>While most modern printers work well with PaperSurvey, you should be aware of these potential problems.</p>
<h3>Content Cutoff</h3>
<p>Economy or older printers sometimes crop the bottom portion of pages, especially when:</p>
<ul>
<li>Default margins are set too large</li>
<li>Paper size detection is incorrect</li>
<li>Print scaling is set to "Fit to page" instead of "Actual size"</li>
</ul>
<h3>Print Quality Variations</h3>
<p>Different printers produce varying results in:</p>
<ul>
<li><strong>Line thickness and clarity</strong></li>
<li><strong>Contrast</strong> between text and background</li>
<li><strong>QR code sharpness</strong></li>
<li><strong>Overall page alignment</strong></li>
</ul>
<h2>Ensuring Consistent Results Across Printers</h2>
<p>To maximize compatibility when respondents use various printers, follow these guidelines.</p>
<h3>Design Considerations</h3>
<ol>
<li><strong>Add safety margins</strong>: By default, corner marks are located about 1cm from the side edges and 1.2cm from the top and bottom edges. You may change margins in survey settings.</li>
<li><strong>Use standard fonts</strong>: Stick to common fonts that render consistently.</li>
</ol>
<h3>Recommended Print Settings</h3>
<p>Include these instructions with your survey distribution.</p>
<p><strong>For respondents:</strong></p>
<ul>
<li>Select "Actual size" or "100%" scaling (not "Fit to page")</li>
<li>Use standard A4 paper settings</li>
<li>Choose "Normal" or "High" quality (not "Draft")</li>
<li>Disable any "Toner saver" or "Eco mode" options</li>
</ul>
<h2>Preventing Cutoff Issues</h2>
<h3>Adjust Margins in Survey Settings</h3>
<p>The most effective way to prevent content cutoff is to adjust margins directly in PaperSurvey:</p>
<ol>
<li>Open your survey in the form builder</li>
<li>Navigate to <strong>Survey Settings</strong></li>
<li>Open the <strong>Layout</strong> section and find <strong>Margins &amp; Spacing</strong></li>
<li>Adjust the following as needed:<ul>
<li><strong>Top margin</strong>: Increase if headers, footers, or corner marks are cut off</li>
<li><strong>Side margins</strong>: Adjust for hole punching or binding (applies to both left and right)</li>
</ul>
</li>
<li>Preview your changes before finalizing</li>
</ol>
<p>These margin adjustments ensure your content stays within the printable area regardless of printer variations. Properly configured margins will always resolve cutoff issues.</p>]]>
            </summary>
                                    <updated>2026-07-18T07:29:35+00:00</updated>
        </entry>
            <entry>
            <title><![CDATA[Do I Need to Print Surveys in Color?]]></title>
            <link rel="alternate" href="https://www.papersurvey.io/help/printing/article/do-i-need-to-print-surveys-in-color" />
            <id>https://www.papersurvey.io/46</id>
            <author>
                <name><![CDATA[PaperSurvey.io]]></name>
            </author>
            <summary type="html">
                <![CDATA[<p>You do not need to print surveys in color. Black and white printing works perfectly with PaperSurvey's recognition system and is the recommended approach for most users. Choosing the right print settings can save you significant costs while maintaining excellent recognition accuracy.</p>
<h2>Why Black and White Printing Is Preferred</h2>
<p>Black and white printing offers several advantages:</p>
<ul>
<li><strong>Cost-effective</strong>: Significantly cheaper for large-scale surveys</li>
<li><strong>Faster printing</strong>: Most printers produce black and white pages more quickly</li>
<li><strong>Better contrast</strong>: Sharp black text on white paper provides optimal recognition</li>
<li><strong>Universal compatibility</strong>: Works reliably across all printer types</li>
</ul>
<h2>When Color Might Be Useful</h2>
<p>While not required, color can enhance surveys in specific situations.</p>
<h3>Branding and Engagement</h3>
<ul>
<li>Company logos or headers for professional appearance</li>
<li>Color-coded sections for long surveys</li>
<li>Visual elements that improve respondent experience</li>
</ul>
<h3>Special Use Cases</h3>
<ul>
<li>Surveys with color-dependent questions (e.g., "Rate the blue logo")</li>
<li>Multi-version surveys using color coding</li>
<li>Educational contexts where color aids comprehension</li>
</ul>
<h2>Recognition Accuracy Considerations</h2>
<p>PaperSurvey's recognition technology is optimized for contrast, not color:</p>
<ul>
<li><strong>Black text on white</strong>: Highest recognition accuracy</li>
<li><strong>Dark colors on light</strong>: Generally works well</li>
<li><strong>Light colors</strong>: May cause recognition issues, especially yellow or light gray</li>
<li><strong>Colored backgrounds</strong>: Can interfere with checkbox and text detection</li>
</ul>
<h2>Common Questions</h2>
<p><strong>Will color logos affect recognition?</strong>
No, logos in headers or margins will not impact recognition of response areas.</p>
<p><strong>Can I use colored paper?</strong>
Light colored paper (cream, light gray) usually works, but white paper ensures the best results.</p>
<p><strong>What about highlighting important questions?</strong>
Use bold text, boxes, or larger fonts instead of color highlighting.</p>
<h2>Making the Decision</h2>
<p>Choose black and white printing unless you have a specific need for color. Your respondents will focus on content, not colors, and you will save significantly on printing costs while maintaining excellent recognition accuracy.</p>]]>
            </summary>
                                    <updated>2026-03-29T04:30:48+00:00</updated>
        </entry>
            <entry>
            <title><![CDATA[Can I Upload Surveys Created on Another Platform?]]></title>
            <link rel="alternate" href="https://www.papersurvey.io/help/recognition/article/can-i-upload-surveys-created-on-another-platform" />
            <id>https://www.papersurvey.io/47</id>
            <author>
                <name><![CDATA[PaperSurvey.io]]></name>
            </author>
            <summary type="html">
                <![CDATA[<p>PaperSurvey can only process surveys created within our platform. This requirement exists because our recognition system relies on specialized formatting and unique identifiers that are automatically embedded into every survey during the design process.</p>
<h2>Why surveys must be created in PaperSurvey</h2>
<p>Our recognition system depends on specific elements that are added to every survey automatically:</p>
<ul>
<li><strong>Corner marks</strong> for page alignment</li>
<li><strong>Unique QR codes</strong> for survey identification</li>
<li><strong>Precise checkbox positioning</strong> for accurate detection</li>
<li><strong>Optimized spacing</strong> for handwriting recognition</li>
</ul>
<p>These elements cannot be retroactively added to existing survey designs from other platforms.</p>
<h2>What you can do instead</h2>
<h3>Starting fresh</h3>
<p>If you have not collected any responses yet, you can recreate your survey in PaperSurvey:</p>
<ol>
<li>Use our form builder to match your original design</li>
<li>Import questions from your existing survey file (TXT, Word, or PDF, up to 10MB) instead of retyping them</li>
<li>Customize the layout to match your needs</li>
<li>Generate new printable PDFs with proper formatting</li>
</ol>
<h3>Already collected responses?</h3>
<p>If you have already collected paper responses using another platform's survey, manual data entry may be your only option. Consider using PaperSurvey for future survey rounds to benefit from automated processing.</p>
<h2>Benefits of using PaperSurvey from the start</h2>
<ul>
<li><strong>Automatic processing</strong> saves hours of manual entry</li>
<li><strong>Built-in duplicate detection</strong> prevents data errors</li>
<li><strong>Real-time verification</strong> catches issues early</li>
<li><strong>Multiple export formats</strong> including CSV, Excel, and SPSS</li>
</ul>]]>
            </summary>
                                    <updated>2026-07-18T07:29:35+00:00</updated>
        </entry>
            <entry>
            <title><![CDATA[Does the Software Ignore Marks Outside of Boxes?]]></title>
            <link rel="alternate" href="https://www.papersurvey.io/help/recognition/article/does-software-know-to-ignore-marks-outside-boxes" />
            <id>https://www.papersurvey.io/48</id>
            <author>
                <name><![CDATA[PaperSurvey.io]]></name>
            </author>
            <summary type="html">
                <![CDATA[<p>When respondents fill out paper surveys, stray marks and accidental pen strokes outside the designated answer areas are common. PaperSurvey's recognition engine is designed to handle this gracefully.</p>
<p>Any marks that fall outside the answer boxes are automatically ignored during processing. The system focuses exclusively on the content within each designated response area, so stray lines, notes in the margin, or accidental marks will not affect your results.</p>
<p>The one exception is the page markings themselves. The four corner marks and the QR codes must remain clean and readable, because writing over them can prevent the page from being recognized at all. Ask respondents to avoid marking those areas.</p>
<p>If you want to learn more about how PaperSurvey processes survey responses, visit our article on <a href="/help/form-design/article/text-recognition-modes">text recognition modes</a>.</p>]]>
            </summary>
                                    <updated>2026-07-18T07:29:35+00:00</updated>
        </entry>
            <entry>
            <title><![CDATA[What Pen Should I Use to Complete a Survey?]]></title>
            <link rel="alternate" href="https://www.papersurvey.io/help/recognition/article/should-i-complete-survey-in-pen-or-pencil" />
            <id>https://www.papersurvey.io/49</id>
            <author>
                <name><![CDATA[PaperSurvey.io]]></name>
            </author>
            <summary type="html">
                <![CDATA[<p>The pen your respondents use has a direct impact on scanning quality and recognition accuracy. We recommend using a black or blue ballpoint pen for the best results.</p>
<h2>Why pen works well</h2>
<p>Pen creates dark, consistent marks that scanners can easily detect:</p>
<ul>
<li><strong>High contrast.</strong> Black or blue ink stands out clearly against white paper.</li>
<li><strong>Consistent darkness.</strong> No variation from pressure differences.</li>
<li><strong>No smudging.</strong> Ink does not smear during handling.</li>
<li><strong>Good longevity.</strong> Marks remain clear over time and through storage.</li>
</ul>
<h2>Recommended pen types</h2>
<ul>
<li><strong>Ballpoint pens</strong> produce the most consistent marks</li>
<li><strong>Gel pens</strong> work well but may smear if not given time to dry</li>
<li><strong>Felt-tip pens</strong> are acceptable but avoid thick markers that may bleed through paper</li>
</ul>
<h2>Colors to use</h2>
<p><strong>Black</strong> and <strong>blue</strong> ink produce the best results. Avoid light colors such as yellow or light green, as they may not be detected reliably at lower scan resolutions.</p>
<h2>Marking guidelines</h2>
<ul>
<li><strong>Cross checkboxes with a clear X</strong> or fill them in completely</li>
<li>Avoid light checkmarks, as a checkmark can easily drift across multiple answers or land outside the box</li>
<li>Apply firm, consistent pressure</li>
<li>Make marks dark and solid</li>
</ul>
<h2>Correcting answers</h2>
<p>By default, any mark in a checkbox (a check, a cross, or a completely filled box) counts as a response. If your respondents may need to correct mistakes, switch the Recognition mode to "Check, Cross to respond, fill-in to unmark" in your survey's settings. With that mode enabled, respondents cancel a mark by completely filling in the box, and the printed footer instructions on the survey update to explain this.</p>
<h2>Avoiding faint marks</h2>
<p>Always provide or recommend pens to your respondents. Thin lines, light checkmarks, or partial marks may not be visible to the scanner and can lead to missed responses.</p>]]>
            </summary>
                                    <updated>2026-07-18T07:29:35+00:00</updated>
        </entry>
            <entry>
            <title><![CDATA[Why Are My Surveys Not Being Recognized?]]></title>
            <link rel="alternate" href="https://www.papersurvey.io/help/recognition/article/why-my-surveys-are-not-recognized" />
            <id>https://www.papersurvey.io/51</id>
            <author>
                <name><![CDATA[PaperSurvey.io]]></name>
            </author>
            <summary type="html">
                <![CDATA[<p>When a survey fails to process, the cause is almost always missing corner marks or a mismatch between your print settings and your survey configuration. Understanding these common issues will help you diagnose and resolve problems quickly so you can get back to collecting data.</p>
<h2>Most common cause: Missing corner marks</h2>
<p>PaperSurvey needs at least three of the four corner marks to be visible for reliable recognition. These marks help the system detect page orientation, locate question areas precisely, correct for scanning skew, and identify the survey template.</p>
<h3>Check your scans</h3>
<p>Look at your uploaded files and confirm that all four corner marks are clearly visible:</p>
<ul>
<li><strong>Top-left</strong> and <strong>top-right</strong> corners</li>
<li><strong>Bottom-left</strong> and <strong>bottom-right</strong> corners</li>
</ul>
<p>If only two adjacent corner marks are visible and the page is not skewed, you can still try selecting the failed page and pressing "Re-attempt recognition" on the Uploads page. Pages with fewer corner marks, or skewed pages, require manual data entry.</p>
<h2>Common reasons for missing corners</h2>
<h3>Printer cutting off margins</h3>
<p>Some printers, especially budget models, crop page edges. Test print a single page first, check that all four corners printed completely, adjust printer margins if needed, and try a different printer if margins cannot be fixed.</p>
<h3>Scanner cropping</h3>
<p>Document feeders sometimes crop edges. Place pages carefully in the feeder, use flatbed scanning for problem pages, check scanner margin settings, and clean the scanner glass and rollers.</p>
<h3>Photocopying issues</h3>
<p>Copies often lose edge content. Always scan original prints rather than photocopies. If copying is necessary, verify that all corners are intact on the copy.</p>
<h2>Second common cause: Mismatched settings</h2>
<h3>Unique page marking mismatch</h3>
<p>This happens when you print surveys without unique identifiers, then enable unique page marking afterward. The system expects QR codes that are not present on the printed pages.</p>
<p><strong>Solution:</strong></p>
<ol>
<li>Go to Survey Settings</li>
<li>Disable "Unique page marking"</li>
<li>Retry processing your uploads</li>
</ol>
<p>If stamped and unstamped printouts are both in circulation, you can instead keep unique page marking on and enable "Accept pages without unique marker" in Survey Settings. Pages with a missing or unreadable bottom-left QR code are then accepted and grouped like an unstamped upload.</p>
<h2>Troubleshooting steps</h2>
<h3>1. Examine a failed page</h3>
<ul>
<li>Download the problematic scan</li>
<li>Check that all four corners are visible</li>
<li>Look for QR codes if unique marking is enabled</li>
<li>Verify that the scan matches the survey design</li>
</ul>
<h3>2. Test with a single page</h3>
<ul>
<li>Scan one page carefully</li>
<li>Ensure all corners are visible</li>
<li>Upload and check if it processes</li>
<li>If successful, review your batch scanning process</li>
</ul>
<h3>3. Check your settings</h3>
<p>In Survey Settings, verify that the unique page marking setting matches your prints, the correct paper size (A4 or Letter) is selected, and language settings are appropriate.</p>
<h3>4. Review printer settings</h3>
<ul>
<li>Set margins to "None" or "Minimal"</li>
<li>Use "Actual Size" not "Fit to Page"</li>
<li>Disable any auto-cropping features</li>
<li>Print in high quality mode</li>
</ul>
<h2>Prevention</h2>
<h3>Before printing</h3>
<ul>
<li>Always test print one page first</li>
<li>Verify all elements are visible</li>
<li>Check printer compatibility</li>
<li>Save your print settings for consistency</li>
</ul>
<h3>During scanning</h3>
<ul>
<li>Align pages carefully</li>
<li>Use consistent scanner settings</li>
<li>Batch similar documents together</li>
<li>Clean the scanner regularly</li>
</ul>
<h3>After uploading</h3>
<ul>
<li>Check the first few processed pages</li>
<li>Monitor error rates</li>
<li>Address issues immediately</li>
<li>Do not delete originals until results are verified</li>
</ul>
<h2>Still having issues?</h2>
<p>If surveys still are not recognized, contact our support team with a sample problem scan, your Survey ID, any error messages, and the steps you have already tried. We can help with custom margin adjustments, alternative processing options, and bulk reprocessing.</p>
<p>Most recognition issues are easily fixed once the root cause is identified. Following these guidelines ensures smooth processing for all your surveys.</p>]]>
            </summary>
                                    <updated>2026-07-18T07:29:35+00:00</updated>
        </entry>
            <entry>
            <title><![CDATA[Can PaperSurvey Read Surveys Sent by Fax?]]></title>
            <link rel="alternate" href="https://www.papersurvey.io/help/recognition/article/will-papersurvey-be-able-to-read-response-of-survey-sent-by-fax" />
            <id>https://www.papersurvey.io/52</id>
            <author>
                <name><![CDATA[PaperSurvey.io]]></name>
            </author>
            <summary type="html">
                <![CDATA[<p>Yes, PaperSurvey can process faxed surveys. However, fax transmission inherently degrades image quality, so success depends on the quality of the fax and proper setup on both ends. With the right preparation, most faxed surveys process without problems.</p>
<h2>How faxing affects survey quality</h2>
<p>Faxing introduces several challenges that can impact recognition:</p>
<ul>
<li><strong>Resolution loss.</strong> Faxes typically transmit at 200 DPI or less.</li>
<li><strong>Image compression.</strong> Fine details may be lost or blurred.</li>
<li><strong>Contrast issues.</strong> Gray tones are forced to pure black or white.</li>
<li><strong>Noise and artifacts.</strong> Phone line quality affects overall clarity.</li>
</ul>
<p>Despite these challenges, most faxed surveys process successfully with proper preparation.</p>
<h2>Optimizing surveys for fax transmission</h2>
<h3>Before sending</h3>
<ul>
<li><strong>Use black pen only.</strong> Colored inks fax poorly.</li>
<li><strong>Write clearly.</strong> Extra-neat handwriting compensates for quality loss.</li>
<li><strong>Cross boxes firmly with a clear X.</strong> Faint or partial marks may disappear during transmission.</li>
<li><strong>Avoid corrections.</strong> Cross-outs can become illegible blotches.</li>
</ul>
<h3>Fax machine settings</h3>
<ul>
<li><strong>Use "Fine" or "Super Fine" mode</strong> for higher quality transmission</li>
<li><strong>Select "Text" not "Photo" mode</strong> for better contrast on surveys</li>
<li><strong>Ensure clean scanner glass.</strong> Spots on the glass become black marks.</li>
<li><strong>Check contrast settings.</strong> Too dark can obscure text.</li>
</ul>
<h3>Receiving faxed surveys</h3>
<ul>
<li><strong>Save as PDF if possible.</strong> This is better than printing and rescanning.</li>
<li><strong>Use fax-to-email services.</strong> Digital files maintain quality.</li>
<li><strong>Avoid re-faxing.</strong> Each transmission degrades quality further.</li>
<li><strong>Print at high quality</strong> if physical copies are needed.</li>
</ul>
<h2>Common fax-related issues</h2>
<h3>Missing corner marks</h3>
<p>Fax margins often crop edges.
<strong>Solution:</strong> Add extra margin when printing the original, or use a slightly smaller survey layout. If a page arrives with only two of the four corner marks visible, you can still recover it: on the Uploads page, select the page under Unrecognized Pages, click <strong>Re-attempt recognition</strong>, and choose <strong>Missing corner marks</strong>. This method detects the page from just two corners, although skewed pages may reduce accuracy.</p>
<h3>Illegible handwriting</h3>
<p>Fax compression reduces text clarity.
<strong>Solution:</strong> Instruct respondents to print clearly, and use larger text fields in your survey design.</p>
<h3>Black spots or lines</h3>
<p>Phone line noise creates visual artifacts.
<strong>Solution:</strong> Clean up images before uploading, or request email submission as an alternative.</p>
<h2>Best practices for fax workflows</h2>
<h3>Survey design</h3>
<ol>
<li><strong>Increase checkbox size.</strong> Larger targets survive compression better.</li>
<li><strong>Use simple fonts.</strong> Avoid decorative text that may not transmit well.</li>
<li><strong>Add white space.</strong> Extra spacing prevents bleeding between sections.</li>
<li><strong>Bold important elements</strong> such as corner marks and instructions.</li>
</ol>
<h3>Instructions for respondents</h3>
<p>Include clear guidance on the survey itself:</p>
<blockquote>
<p>"If returning by fax:</p>
<ul>
<li>Use black pen only</li>
<li>Write clearly in PRINT letters</li>
<li>Cross checkboxes with a firm, clear X</li>
<li>Set fax to 'Fine' quality mode"</li>
</ul>
</blockquote>
<h3>Processing faxed surveys</h3>
<ol>
<li>Review fax quality immediately upon receipt</li>
<li>Process a test page first</li>
<li>Adjust verification settings if needed</li>
<li>Be prepared for higher error rates compared to scanned originals</li>
</ol>
<h2>Alternative solutions</h2>
<h3>Digital options</h3>
<p>Consider these alternatives to faxing:</p>
<ul>
<li><strong>Email scanning.</strong> Respondents scan and email their completed forms.</li>
<li><strong>Mobile apps.</strong> Document scanning apps produce higher quality images.</li>
<li><strong>Web surveys.</strong> An online version can serve as a backup.</li>
<li><strong>Postal mail.</strong> Original quality is fully preserved.</li>
</ul>
<h3>Hybrid approach</h3>
<p>Offering multiple return methods lets you track which method each respondent uses and compare quality across methods, then optimize based on the results.</p>]]>
            </summary>
                                    <updated>2026-07-18T07:29:35+00:00</updated>
        </entry>
            <entry>
            <title><![CDATA[Can PaperSurvey Read Photos Taken by Mobile Phone?]]></title>
            <link rel="alternate" href="https://www.papersurvey.io/help/scanning/article/can-papersurvey-read-photos-taken-by-cell-phone" />
            <id>https://www.papersurvey.io/53</id>
            <author>
                <name><![CDATA[PaperSurvey.io]]></name>
            </author>
            <summary type="html">
                <![CDATA[<p>PaperSurvey can process photos taken with mobile phones, making it possible to digitize surveys from virtually anywhere. However, photos taken with standard camera apps often produce recognition errors due to poor image quality, so choosing the right capture method matters.</p>
<h2>Common Issues with Camera Photos</h2>
<p>Regular camera apps are not optimized for document capture, which leads to:</p>
<ul>
<li><strong>Skewed or distorted images</strong> from angled shots</li>
<li><strong>Motion blur</strong> from unstable hands</li>
<li><strong>Uneven lighting and shadows</strong> across the page</li>
<li><strong>Poor text contrast</strong> that reduces readability</li>
</ul>
<p>These issues significantly reduce recognition accuracy and may cause processing failures.</p>
<h2>Quick Capture Guide for Mobile Devices</h2>
<p>Here is a simple guide you can share with colleagues on how to capture high-quality survey photos.</p>
<h3>iOS (Built-in Document Scanner)</h3>
<p>No additional apps needed:</p>
<ol>
<li>Swipe down on the home screen</li>
<li>In the search bar, type "Scan Document"</li>
<li>Position your document and capture</li>
<li>Save the document and share it to @upload.papersurvey.io</li>
</ol>
<h3>Android (Google Drive)</h3>
<p>Most devices have Google Drive pre-installed:</p>
<ol>
<li>Open the Google Drive app</li>
<li>Tap the "+" button in the bottom right</li>
<li>Select "Scan" from the menu</li>
<li>Position your document and tap the capture button</li>
<li>Save the document and share it to @upload.papersurvey.io</li>
</ol>
<p>If the above options are not available on your phone, download <strong>CamScanner</strong>, <strong>Adobe Scan</strong>, or <strong>Microsoft Lens</strong> for reliable document scanning.</p>
<h2>Recommended Document Scanning Apps</h2>
<p>For best results, use dedicated document scanning applications:</p>
<ul>
<li><strong>CamScanner</strong></li>
<li><strong>Adobe Scan</strong></li>
<li><strong>Microsoft Lens</strong></li>
<li><strong>iOS Notes</strong> (built-in), a simple document scanner for iOS users</li>
<li><strong>Google Drive</strong> (built-in), a simple document scanner for Android users</li>
</ul>]]>
            </summary>
                                    <updated>2026-03-29T04:30:48+00:00</updated>
        </entry>
            <entry>
            <title><![CDATA[Four Corner Marks for Survey Recognition]]></title>
            <link rel="alternate" href="https://www.papersurvey.io/help/scanning/article/do-all-corners-need-to-be-visible" />
            <id>https://www.papersurvey.io/54</id>
            <author>
                <name><![CDATA[PaperSurvey.io]]></name>
            </author>
            <summary type="html">
                <![CDATA[<p>Accurate survey recognition depends on the corner marks printed on each page. These small markers help PaperSurvey align and interpret scanned content, so keeping them visible during printing and scanning is essential for reliable results.</p>
<div style="display: flex;justify-content: center;"><img src="https://www.papersurvey.io/templates/156/post-event-survey-questions.png" style="width: 40%" /></div>
<p>For best results, all four corner marks should be visible on every scanned page. When full visibility is not possible, here are the key considerations:</p>
<ol>
<li>
<p><strong>Three Corner Marks</strong>: At a minimum, three corner marks should be visible. This can still produce accurate recognition.</p>
</li>
<li>
<p><strong>Two Corner Marks</strong>: Pages can still be recognized if only two corner marks are visible and the page is not skewed. However, recognition accuracy may be slightly lower. By default, pages with just two corner marks will not be read and will be marked as not recognized.</p>
</li>
<li>
<p><strong>QR Codes Are Damaged or Not Showing Up</strong>: There may be one or two QR codes at the bottom of each page, depending on your survey configuration. These codes must be readable because they are used to automatically identify and process pages.</p>
</li>
</ol>
<h3>Reattempting Recognition</h3>
<p>You can reattempt recognition when only two corners are visible by performing a manual action. Please note that skewed pages may lead to recognition errors and reduced accuracy. Avoid using this option on pages that are improperly aligned.</p>
<p>To reattempt recognition, <strong>+ expand</strong> the document in the <a href="/app/uploads">uploads page</a>, select the relevant pages you wish to retry, and press <strong>Re-attempt recognition -&gt; Missing corner marks</strong>.</p>
<img src="/images/blog/reattempt.png" alt="Reattempt recognition" style="width:50%"/>
<h3>Issues with Printing Surveys</h3>
<p>Some printers may omit the bottom part of the page, resulting in missing corner marks. To address this, you have a few options:</p>
<ul>
<li>Use a different printer that can properly print all four corner marks.</li>
<li><em>For testing only</em>: Scale down the PDF before printing to ensure that all corner marks are visible and recognized accurately. This can cause problems with recognition in certain cases, so it is only suitable for test scenarios.</li>
</ul>
<p>If you encounter challenges with corner mark visibility, reach out to our support team for guidance and assistance.</p>]]>
            </summary>
                                    <updated>2026-03-29T04:30:48+00:00</updated>
        </entry>
            <entry>
            <title><![CDATA[Can Survey Respondents Be Identified?]]></title>
            <link rel="alternate" href="https://www.papersurvey.io/help/security/article/can-survey-respondents-be-identified" />
            <id>https://www.papersurvey.io/55</id>
            <author>
                <name><![CDATA[PaperSurvey.io]]></name>
            </author>
            <summary type="html">
                <![CDATA[<p>Protecting respondent privacy is fundamental to collecting honest, unbiased survey data. PaperSurvey is designed to keep responses anonymous by default, so neither the survey creator nor anyone else can trace an answer back to a specific person. However, certain survey link configurations can reduce this anonymity, and it is important to understand how they work.</p>
<h2>How PaperSurvey protects anonymity</h2>
<p>We protect respondent identities through several key measures:</p>
<ul>
<li><strong>No metadata collection</strong>: We don't collect IP addresses, browser fingerprints, or device information</li>
<li><strong>Anonymous by design</strong>: Responses are stored without any connection to individual identities</li>
<li><strong>No tracking cookies</strong>: We don't use tracking technologies that could identify participants</li>
</ul>
<p>This means that even survey creators cannot see who submitted which response in an anonymous survey.</p>
<h2>Important exception: Tagged links</h2>
<p>While standard survey links maintain complete anonymity, tagged links work differently:</p>
<ul>
<li><strong>Tagged links</strong> allow survey creators to categorize responses by groups (e.g., location, department, event)</li>
<li>If each respondent receives a unique tagged link, their responses could potentially be identified</li>
<li>Tagged links are useful for legitimate research purposes but reduce anonymity</li>
</ul>
<h3>How to identify tagged links</h3>
<p>Look for additional text after the survey URL:</p>
<p><strong>Tagged links (may reduce anonymity):</strong></p>
<ul>
<li><code>papersurvey.io/s/survey/marketing-dept</code></li>
<li><code>papersurvey.io/s/survey/event-2024</code></li>
<li><code>papersurvey.io/s/testsurvey?tag=1234</code></li>
<li><code>papersurvey.io/s/testsurvey?tag=event-2025</code></li>
<li><code>papersurvey.io/l/3f2a9c1e</code> (a named link that carries a preset tag)</li>
</ul>
<p><strong>Standard links (fully anonymous):</strong></p>
<ul>
<li><code>papersurvey.io/s/survey</code></li>
<li><code>papersurvey.io/s/testsurvey</code></li>
</ul>
<h2>Maintaining your anonymity</h2>
<p>To ensure your responses remain anonymous:</p>
<ol>
<li>Check if the survey link contains tags or identifiers</li>
<li>Avoid providing identifying information in open-text responses</li>
<li>Don't include your name, email, or other personal details unless specifically required</li>
</ol>
<h2>Need to verify a survey's anonymity?</h2>
<p>If you are concerned about the anonymity level of a specific survey, contact us through live chat with the survey link. We'll help you determine whether the survey maintains full anonymity or uses features that could identify respondents.</p>
<p>A truly anonymous survey means that no one, including the survey creator, can connect your responses back to you.</p>]]>
            </summary>
                                    <updated>2026-07-19T11:33:34+00:00</updated>
        </entry>
            <entry>
            <title><![CDATA[How Participant Identities Are Protected]]></title>
            <link rel="alternate" href="https://www.papersurvey.io/help/security/article/how-participant-identities-are-protected" />
            <id>https://www.papersurvey.io/56</id>
            <author>
                <name><![CDATA[PaperSurvey.io]]></name>
            </author>
            <summary type="html">
                <![CDATA[<p>When participants share their opinions through a survey, they trust that their information will be handled responsibly. PaperSurvey takes that trust seriously by applying multiple layers of security to protect participant identities and personal information throughout the entire data lifecycle.</p>
<h2>Security measures in place</h2>
<p>We protect participant data through three key security layers:</p>
<h3>1. Encryption during transmission</h3>
<p>All data transfers use end-to-end encryption:</p>
<ul>
<li>Survey responses are encrypted before leaving the respondent's device</li>
<li>Files and uploads are protected during transmission</li>
<li>Even if intercepted, encrypted data remains unreadable</li>
</ul>
<h3>2. Secure data storage</h3>
<p>Your survey data is protected at rest:</p>
<ul>
<li>Enterprise-grade server security</li>
<li>Regular security audits and updates</li>
<li>Access controls limiting who can view data</li>
<li>Automated backups with encryption</li>
</ul>
<h3>3. GDPR compliance</h3>
<p>We follow European data protection standards:</p>
<ul>
<li><strong>Data minimization</strong>: We only collect what's necessary</li>
<li><strong>Purpose limitation</strong>: Data is used only for stated purposes</li>
<li><strong>Storage limitation</strong>: Data retention policies are enforced</li>
<li><strong>Rights to access, correction, and deletion</strong></li>
</ul>
<h2>Additional protections available</h2>
<p>For surveys requiring extra security:</p>
<ul>
<li>Password-protected surveys</li>
<li>Time-limited access windows</li>
<li>IP restriction options for corporate environments</li>
<li>Custom data retention periods</li>
</ul>]]>
            </summary>
                                    <updated>2026-03-29T04:30:48+00:00</updated>
        </entry>
            <entry>
            <title><![CDATA[Is PaperSurvey GDPR Compliant?]]></title>
            <link rel="alternate" href="https://www.papersurvey.io/help/security/article/is-paper-survey-GDPR-compliant" />
            <id>https://www.papersurvey.io/57</id>
            <author>
                <name><![CDATA[PaperSurvey.io]]></name>
            </author>
            <summary type="html">
                <![CDATA[<p>Yes, PaperSurvey is fully GDPR compliant. We built our platform from the ground up with data protection in mind, ensuring that both survey creators and respondents can trust us with their data. Whether you are collecting feedback from customers across Europe or running internal assessments, our compliance means your data is handled according to the strictest privacy regulations.</p>
<h2>What GDPR compliance means for you</h2>
<p>The General Data Protection Regulation (GDPR) sets the gold standard for data protection worldwide. Our compliance means:</p>
<ul>
<li><strong>Your data is protected</strong> by the strictest privacy regulations</li>
<li><strong>You have control</strong> over your personal information</li>
<li><strong>Transparency</strong> in how we handle and process data</li>
<li><strong>Accountability</strong> for data protection at every level</li>
</ul>
<h2>Key GDPR features in PaperSurvey</h2>
<h3>Data subject rights</h3>
<p>We support all GDPR-mandated rights:</p>
<ul>
<li>Right to access your data</li>
<li>Right to rectification (corrections)</li>
<li>Right to erasure ("right to be forgotten")</li>
<li>Right to data portability</li>
<li>Right to restrict processing</li>
<li>Right to object to processing</li>
</ul>
<h3>Privacy by design</h3>
<p>Our platform incorporates privacy from the start:</p>
<ul>
<li>Data minimization built into survey creation</li>
<li>Default settings favor privacy protection</li>
<li>Clear consent mechanisms for data collection</li>
</ul>
<h3>Transparent data processing</h3>
<p>You always know what is happening with your data:</p>
<ul>
<li>Clear privacy notices on all surveys</li>
<li>Detailed processing records</li>
<li>Data Processing Agreements (DPAs) available</li>
<li>Regular privacy impact assessments</li>
</ul>
<h2>For survey creators</h2>
<p>GDPR compliance helps you meet your own obligations:</p>
<h3>Tools we provide</h3>
<ul>
<li>Consent collection features</li>
<li>Data export capabilities for subject requests</li>
<li>Automated deletion options</li>
<li>Processing activity documentation</li>
</ul>
<h3>Your responsibilities</h3>
<ul>
<li>Obtain proper consent when required</li>
<li>Use appropriate legal basis for processing</li>
<li>Respect respondent rights</li>
<li>Maintain your own compliance documentation</li>
</ul>
<h2>For survey respondents</h2>
<p>Your privacy is protected when taking PaperSurvey surveys:</p>
<ul>
<li>Clear information about data usage before you start</li>
<li>Option to withdraw consent</li>
<li>Anonymous response options</li>
<li>No hidden data collection</li>
</ul>
<h2>Documentation and support</h2>
<p>Need more details about our GDPR compliance?</p>
<ul>
<li><strong>Privacy Policy</strong>: Full details at <a href="/privacy-policy">/privacy-policy</a></li>
<li><strong>Data Processing Agreement</strong>: Available upon request</li>
<li><strong>Compliance certificates</strong>: Contact support for documentation</li>
<li><strong>GDPR guidance</strong>: Our team can help with compliance questions</li>
</ul>
<h2>International data transfers</h2>
<p>We ensure safe data transfers:</p>
<ul>
<li>EU data stays in EU-approved locations</li>
<li>Standard Contractual Clauses in place</li>
<li>Adequate security for all transfers</li>
<li>Transparent data location policies</li>
</ul>]]>
            </summary>
                                    <updated>2026-03-29T04:30:48+00:00</updated>
        </entry>
            <entry>
            <title><![CDATA[Where to Find PaperSurvey's Privacy Policy]]></title>
            <link rel="alternate" href="https://www.papersurvey.io/help/security/article/privacy-policy" />
            <id>https://www.papersurvey.io/58</id>
            <author>
                <name><![CDATA[PaperSurvey.io]]></name>
            </author>
            <summary type="html">
                <![CDATA[<p>Understanding how your data is handled is an important part of choosing any software platform. Our complete privacy policy is available at <a href="/privacy-policy">papersurvey.io/privacy-policy</a>, and we have written it in clear, straightforward language so you can see exactly how we collect, use, and protect your information.</p>
<h2>What's covered in our privacy policy</h2>
<h3>Data collection and use</h3>
<ul>
<li>What information we collect (and what we don't)</li>
<li>How we use your data</li>
<li>Legal basis for processing</li>
<li>Data retention periods</li>
</ul>
<h3>Your privacy rights</h3>
<ul>
<li>How to access your data</li>
<li>Requesting corrections or deletions</li>
<li>Data portability options</li>
<li>Opting out of communications</li>
</ul>
<h3>Security measures</h3>
<ul>
<li>Technical safeguards we use</li>
<li>Organizational security policies</li>
<li>Incident response procedures</li>
<li>Third-party security audits</li>
</ul>
<h3>Data sharing</h3>
<ul>
<li>When we might share data (rarely)</li>
<li>Third-party service providers we use</li>
<li>International data transfers</li>
<li>Law enforcement requests</li>
</ul>
<h2>Quick privacy facts</h2>
<p>Here is what you need to know right away:</p>
<ul>
<li><strong>We don't sell your data.</strong> Never have, never will.</li>
<li><strong>Minimal data collection.</strong> We only collect what's necessary.</li>
<li><strong>You're in control.</strong> Delete your data anytime.</li>
<li><strong>Transparent practices.</strong> No hidden data collection.</li>
</ul>
<h2>Related resources</h2>
<p>For a complete picture of our privacy practices:</p>
<ul>
<li><strong>Security Overview</strong>: <a href="/security">papersurvey.io/security</a> for technical security details</li>
<li><strong>GDPR Compliance</strong>: Full GDPR documentation available</li>
<li><strong>Data Processing Agreement</strong>: Available for enterprise customers</li>
</ul>
<h2>Privacy policy updates</h2>
<p>We keep our privacy policy current. The last updated date is shown at the top of the policy, and we send email notifications for significant changes along with clear summaries of what changed.</p>
<h2>Have privacy questions?</h2>
<p>We take privacy seriously and want you to feel confident using PaperSurvey. Whether you need help understanding specific policy sections, exercising your privacy rights, submitting data deletion requests, or configuring privacy settings for your surveys, our privacy team is ready to assist.</p>
<p>Contact our privacy team at privacy@papersurvey.io. We respond within 48 hours.</p>]]>
            </summary>
                                    <updated>2026-03-29T04:30:48+00:00</updated>
        </entry>
            <entry>
            <title><![CDATA[Does Switching Between Plans Incur Additional Costs?]]></title>
            <link rel="alternate" href="https://www.papersurvey.io/help/subscription/article/does-switching-between-plans-incur-costs" />
            <id>https://www.papersurvey.io/59</id>
            <author>
                <name><![CDATA[PaperSurvey.io]]></name>
            </author>
            <summary type="html">
                <![CDATA[<p>Switching between PaperSurvey plans never incurs additional fees. You only pay for the service you actually use, with any changes calculated fairly through prorated billing.</p>
<p>This means you can adjust your plan as often as needed without worrying about hidden charges or penalties.</p>
<h2>How Plan Changes Work</h2>
<p>When you switch plans, we calculate the difference fairly:</p>
<ul>
<li><strong>Upgrading</strong>: Your new plan starts a fresh billing cycle right away, and unused time on your old plan is applied as credit to that first invoice</li>
<li><strong>Downgrading</strong>: Your current plan runs until the end of the period you already paid for, then the lower plan begins. There is no charge today and no credit, since you keep exactly what you paid for</li>
<li><strong>No switching fees</strong>: Change plans as often as needed</li>
</ul>
<h2>Billing Examples</h2>
<p><strong>Upgrade scenario:</strong></p>
<ul>
<li>Current plan: $20/month, halfway through the month</li>
<li>New plan: $50/month</li>
<li>You receive a $10 credit for the unused half of your old plan and pay $40 for a full new month. Your renewal date resets to the day you upgrade</li>
</ul>
<p><strong>Downgrade scenario:</strong></p>
<ul>
<li>Current plan: $50/month</li>
<li>New plan: $20/month</li>
<li>You are not charged today. You keep the $50 plan until the end of your current period, then the $20 plan starts at your next renewal</li>
</ul>
<h2>When Changes Take Effect</h2>
<p>Plan upgrades activate immediately and reset your billing cycle. Plan downgrades apply at the end of your current billing period. Your data and work remain accessible throughout.</p>
<h2>Switching Billing Periods</h2>
<p>You can also switch between monthly and yearly billing:</p>
<ul>
<li><strong>Monthly to yearly</strong>: This is treated as an upgrade. The annual plan starts right away, credit for the unused part of your current month is applied to the first invoice, and your renewal date resets</li>
<li><strong>Yearly to monthly</strong>: This is treated as a downgrade. You keep your annual plan until the end of the period you paid for, then monthly billing begins</li>
</ul>
<h2>Making the Right Choice</h2>
<p>Review your usage in <a href="/app/settings/subscription">Account settings</a> before switching. If you are a regular user, consider yearly billing, which works out to two free months compared with paying monthly. Our support team can also help you choose the right plan.</p>]]>
            </summary>
                                    <updated>2026-07-18T08:45:27+00:00</updated>
        </entry>
            <entry>
            <title><![CDATA[Are There Any Hidden Fees Once I Subscribe?]]></title>
            <link rel="alternate" href="https://www.papersurvey.io/help/subscription/article/hidden-fees-once-subscribed" />
            <id>https://www.papersurvey.io/60</id>
            <author>
                <name><![CDATA[PaperSurvey.io]]></name>
            </author>
            <summary type="html">
                <![CDATA[<p>PaperSurvey has no hidden fees. The price you see on our pricing page is exactly what you pay, with no setup costs, cancellation penalties, or surprise charges.</p>
<p>We believe in transparent pricing so you can budget with confidence and focus on your work.</p>
<h2>What's Included in Your Subscription</h2>
<p>Every plan includes:</p>
<ul>
<li><strong>Full access</strong> to all features within your plan tier</li>
<li><strong>Unlimited surveys</strong> and questions</li>
<li><strong>Data storage</strong> and processing</li>
<li><strong>Customer support</strong></li>
<li><strong>Software updates</strong> and improvements</li>
</ul>
<h2>Transparent Pricing</h2>
<ul>
<li><strong>Monthly plans</strong>: Billed each month at the advertised rate</li>
<li><strong>Yearly plans</strong>: Billed annually at a lower effective rate, equivalent to two free months compared with paying monthly</li>
<li><strong>No setup fees</strong>: Start using PaperSurvey immediately</li>
<li><strong>No cancellation fees</strong>: Cancel anytime without penalties</li>
</ul>
<h2>What Could Affect Your Bill</h2>
<p>The only changes to your regular billing would be:</p>
<ol>
<li><strong>Plan upgrades</strong>: If you choose a higher tier (prorated fairly)</li>
<li><strong>Additional services</strong>: Only if you explicitly request them</li>
<li><strong>Currency conversion</strong>: Your bank may charge for international transactions</li>
</ol>
<h2>Our Commitment to Transparency</h2>
<p>All prices are clearly displayed before purchase. You receive email confirmation for every charge, detailed invoices are available in your account, and there are no automatic upgrades or surprise charges.</p>
<h2>Have Billing Questions?</h2>
<p>Review your invoices anytime in <a href="/app/settings/subscription">Account settings</a> or contact our support team at <a href="mailto:support@papersurvey.io">support@papersurvey.io</a>. We are happy to explain any aspect of your billing.</p>]]>
            </summary>
                                    <updated>2026-07-18T08:45:27+00:00</updated>
        </entry>
            <entry>
            <title><![CDATA[Will I Lose My Data if I Upgrade from the Free Trial?]]></title>
            <link rel="alternate" href="https://www.papersurvey.io/help/subscription/article/if-i-upgrade-free-trial-will-data-be-lost" />
            <id>https://www.papersurvey.io/61</id>
            <author>
                <name><![CDATA[PaperSurvey.io]]></name>
            </author>
            <summary type="html">
                <![CDATA[<p>All your data is completely safe when upgrading from a free trial to a paid plan. Everything you have created during your trial transfers seamlessly, so you can continue working without any interruption.</p>
<p>There is no need to re-upload documents, recreate surveys, or reconfigure settings.</p>
<h2>What Transfers to Your Paid Account</h2>
<p>When you upgrade, you keep:</p>
<ul>
<li><strong>All surveys and templates</strong> you have created</li>
<li><strong>Uploaded forms</strong> and processed data</li>
<li><strong>Team members</strong> and permissions</li>
<li><strong>Account settings</strong> and preferences</li>
<li><strong>Integration configurations</strong></li>
<li><strong>Historical data</strong> and analytics</li>
</ul>
<h2>How the Upgrade Process Works</h2>
<p>Upgrading is simple and immediate:</p>
<ol>
<li>Choose your plan in <a href="/app/settings/subscription">Subscription settings</a></li>
<li>Enter your payment information</li>
<li>Your account upgrades instantly</li>
<li>Continue working without interruption</li>
</ol>
<h2>What Happens if Your Trial Expires First?</h2>
<p>Even if your trial expires before upgrading, your data remains intact. You can still access your account to upgrade, and all data reactivates upon payment. No re-upload or reconfiguration is needed.</p>]]>
            </summary>
                                    <updated>2026-03-29T04:30:48+00:00</updated>
        </entry>
            <entry>
            <title><![CDATA[Is the Subscription on a 30-Day Basis or Monthly Basis?]]></title>
            <link rel="alternate" href="https://www.papersurvey.io/help/subscription/article/is-subscription-on-30-day-basis-or-monthly-basis" />
            <id>https://www.papersurvey.io/62</id>
            <author>
                <name><![CDATA[PaperSurvey.io]]></name>
            </author>
            <summary type="html">
                <![CDATA[<p>Monthly subscriptions renew on a calendar month basis. Your billing date stays the same each month, so charges are predictable regardless of which day you subscribe on.</p>
<p>Knowing how your billing cycle works helps you plan renewals and understand when charges will appear on your statement.</p>
<h2>How the Billing Cycle Works</h2>
<p>When you subscribe, your billing cycle starts immediately and you are billed each month on the same date. Billing is handled through Stripe, so renewals fall on the same day of the month, adjusting for shorter months.</p>
<p><strong>Example:</strong> Subscribe on January 15th, and your next bills fall on February 15th, March 15th, and so on.</p>
<h2>Why a Monthly Cycle?</h2>
<p>A calendar month cycle means:</p>
<ul>
<li><strong>Fair pricing</strong>: You always get the full period you pay for</li>
<li><strong>Predictable billing</strong>: The same day of the month, every month</li>
<li><strong>Simple proration</strong>: Easy calculations when changing plans</li>
</ul>
<h2>Billing Date Examples</h2>
<p>If you subscribe on the:</p>
<ul>
<li><strong>1st</strong>: Bills recur on the 1st</li>
<li><strong>15th</strong>: Bills recur on the 15th</li>
<li><strong>31st</strong>: Bills recur on the last day of the month for shorter months</li>
</ul>
<h2>Yearly Subscriptions</h2>
<p>Annual plans work differently. They are billed once per year with a full year of access and cost the equivalent of ten monthly payments, so two months are effectively free compared to monthly billing.</p>
<h2>Viewing Your Next Billing Date</h2>
<p>Check your exact billing date anytime:</p>
<ol>
<li>Go to <a href="/app/settings/subscription">Subscription settings</a></li>
<li>View "Next billing date"</li>
<li>See your complete billing history</li>
</ol>]]>
            </summary>
                                    <updated>2026-07-18T08:45:27+00:00</updated>
        </entry>
            <entry>
            <title><![CDATA[Do I Pay the Full Amount or Just the Difference When Upgrading?]]></title>
            <link rel="alternate" href="https://www.papersurvey.io/help/subscription/article/paying-full-amount-or-difference-when-upgrading-to-more-expensive-plan" />
            <id>https://www.papersurvey.io/63</id>
            <author>
                <name><![CDATA[PaperSurvey.io]]></name>
            </author>
            <summary type="html">
                <![CDATA[<p>You only pay the prorated difference when upgrading plans. PaperSurvey automatically credits your unused time from the current plan, so you are never charged twice for the same period.</p>
<p>This fair billing approach means you can upgrade with confidence, knowing exactly what you will be charged.</p>
<h2>How Upgrade Billing Works</h2>
<p>When you upgrade mid-cycle:</p>
<ol>
<li>We calculate your unused days on the current plan</li>
<li>Convert this to a credit amount</li>
<li>Apply it to your new plan cost</li>
<li>You pay only the difference</li>
</ol>
<h2>Real Example</h2>
<p><strong>Scenario:</strong> Upgrading from $20 Standard to $50 Enterprise plan</p>
<p>If you have used 15 days of your $20 plan:</p>
<ul>
<li><strong>Credit for unused time</strong>: $10</li>
<li><strong>New plan monthly cost</strong>: $50</li>
<li><strong>Your payment</strong>: $40 (for the full month on Enterprise)</li>
<li><strong>Next month</strong>: Regular $50</li>
</ul>
<h2>The Math Behind Proration</h2>
<p>We calculate daily rates for accuracy:</p>
<pre><code>Current plan daily rate = $20 / 30 days = $0.67/day
Unused days = 15
Credit = $0.67 x 15 = $10</code></pre>
<h2>Common Upgrade Scenarios</h2>
<p><strong>Early in billing cycle:</strong> More unused time means a larger credit and lower upgrade payment.</p>
<p><strong>Late in billing cycle:</strong> Less unused time means a smaller credit and higher upgrade payment.</p>
<p><strong>Upgrading on renewal date:</strong> No proration is needed. You simply pay the full price of the new plan.</p>
<h2>What About Downgrading?</h2>
<p>Downgrades work differently from upgrades. Instead of changing immediately, a downgrade is scheduled for the end of your current billing period. You keep your current plan and its full allowance until then, and the lower price starts at your next renewal. Because the change takes effect at renewal, no proration or credit is involved, and no refunds are issued to your payment method.</p>
<h2>Multiple Upgrades in One Month</h2>
<p>If you change plans multiple times, each change is prorated. Credits and charges are calculated precisely, and the final charge reflects your actual usage.</p>
<h2>See the Cost Before Upgrading</h2>
<p>Our system shows exactly what you will pay:</p>
<ol>
<li>Go to <a href="/app/settings/subscription">Subscription settings</a></li>
<li>Select your new plan</li>
<li>Review the prorated amount</li>
<li>Confirm only when ready</li>
</ol>
<p>You will always see costs upfront, receive immediate email confirmation, and get a detailed invoice showing the calculations.</p>]]>
            </summary>
                                    <updated>2026-07-18T08:45:27+00:00</updated>
        </entry>
            <entry>
            <title><![CDATA[Can I Upload More Than 10,000 Pages per Month?]]></title>
            <link rel="alternate" href="https://www.papersurvey.io/help/subscription/article/plan-for-uploading-more-than-10000-pages-per-month" />
            <id>https://www.papersurvey.io/64</id>
            <author>
                <name><![CDATA[PaperSurvey.io]]></name>
            </author>
            <summary type="html">
                <![CDATA[<p>PaperSurvey supports high-volume processing through stackable Enterprise Plus plans. Whether you need 20,000 or 100,000 pages per month, you can scale to any volume by combining multiple plans or working with our team for custom solutions.</p>
<p>This flexible approach means you only pay for the capacity you need and can adjust at any time.</p>
<h2>How High-Volume Pricing Works</h2>
<p>Our Enterprise Plus plan provides:</p>
<ul>
<li><strong>10,000 pages</strong> per month</li>
<li><strong>$125/month</strong> (or approximately $100/month billed annually)</li>
<li><strong>Stackable</strong> for higher volumes</li>
</ul>
<p>Need 30,000 pages monthly? Simply subscribe to three Enterprise Plus plans.</p>
<h2>Volume Examples and Pricing</h2>
<table>
<thead>
<tr>
<th>Monthly Pages</th>
<th>Plans Needed</th>
<th>Monthly Cost</th>
<th>Annual Cost (two months free)</th>
</tr>
</thead>
<tbody>
<tr>
<td>10,000</td>
<td>1 plan</td>
<td>$125</td>
<td>$1,250</td>
</tr>
<tr>
<td>20,000</td>
<td>2 plans</td>
<td>$250</td>
<td>$2,500</td>
</tr>
<tr>
<td>30,000</td>
<td>3 plans</td>
<td>$375</td>
<td>$3,750</td>
</tr>
<tr>
<td>50,000</td>
<td>5 plans</td>
<td>$625</td>
<td>$6,250</td>
</tr>
<tr>
<td>100,000</td>
<td>10 plans</td>
<td>$1,250</td>
<td>$12,500</td>
</tr>
</tbody>
</table>
<h2>Benefits of Our Flexible Approach</h2>
<p><strong>Scale up or down anytime.</strong> Add plans during busy periods, remove plans when volume decreases, and pay only for what you need. There are no long-term commitments, no penalties for changes, and full flexibility to adjust monthly.</p>
<h2>Managing Multiple Plans</h2>
<p>Working with multiple plans is straightforward:</p>
<ol>
<li>All plans share the same account</li>
<li>Page allowances combine automatically</li>
<li>Single login, unified dashboard</li>
<li>One consolidated invoice</li>
</ol>
<h2>Custom Enterprise Solutions</h2>
<p>For very high volumes (100,000+ pages/month), we offer custom pricing tiers, dedicated account management, SLA guarantees, priority processing, and API rate limit increases.</p>
<h2>Seasonal or Project-Based Needs</h2>
<p>This model is perfect for organizations with variable demand, such as research projects that require high volume for a limited duration or academic institutions that need to adjust for semester schedules.</p>
<h2>Getting Started with High Volume</h2>
<ol>
<li><strong>Estimate your monthly pages</strong></li>
<li><strong>Choose the number of plans needed</strong></li>
<li><strong>Subscribe in your <a href="/app/settings/subscription">Account settings</a></strong></li>
<li><strong>Adjust anytime based on actual usage</strong></li>
</ol>
<h2>Monitoring Your Usage</h2>
<p>Stay informed about your page consumption with a real-time usage dashboard, email alerts at 80% and 100% usage, monthly usage reports, and historical trends.</p>]]>
            </summary>
                                    <updated>2026-07-18T08:45:27+00:00</updated>
        </entry>
            <entry>
            <title><![CDATA[How Do I Create a Web Survey?]]></title>
            <link rel="alternate" href="https://www.papersurvey.io/help/web-surveys/article/how-to-create-web-survey" />
            <id>https://www.papersurvey.io/65</id>
            <author>
                <name><![CDATA[PaperSurvey.io]]></name>
            </author>
            <summary type="html">
                <![CDATA[<p>Creating a web survey in PaperSurvey takes just a few clicks. Because PaperSurvey is designed for both paper and web data collection, your web survey will match your paper version exactly, ensuring consistent data across all collection methods.</p>
<h2>Quick Start Guide</h2>
<ol>
<li><strong>Design your survey</strong>: Create your survey questions as usual</li>
<li><strong>Open survey settings</strong>: Click the settings icon for your survey</li>
<li><strong>Enable web surveys</strong>: Toggle the "Web Surveys" option to ON</li>
<li><strong>Save changes</strong>: Your web survey is now live</li>
</ol>
<p><img src="/images/blog/web-surveys.png" alt="Web Surveys" /></p>
<p>That is all it takes. Your survey is now available online while maintaining the exact same structure as your paper version.</p>
<h2>Understanding Your Web Survey Link</h2>
<p>Once enabled, you will receive a unique URL like: <code>papersurvey.io/s/30pk2m</code></p>
<p>This link:</p>
<ul>
<li>Works on all devices (desktop, tablet, mobile)</li>
<li>Can be shared via email, social media, or QR code</li>
<li>Accepts responses 24/7 until you close the survey</li>
<li>Automatically saves responses to your database</li>
</ul>
<h2>Customizing Your Web Survey</h2>
<p><strong>Survey URL</strong>: You can customize the ending of your URL (e.g., change "30pk2m" to "customer-feedback-2025") if your preferred name is available.</p>
<p><strong>Welcome message</strong>: Add instructions or context at the beginning of your survey to guide respondents.</p>
<p><strong>Thank you page</strong>: Customize what respondents see after submitting their responses.</p>
<p><strong>Multiple languages</strong>: If you have created translations, respondents can switch languages while completing the survey.</p>
<p><strong>Save progress</strong>: Enable "Save progress to browser" in settings to automatically save respondent progress. This allows participants to close and reopen the survey without losing their answers, as long as they use the same device and browser.</p>
<h2>Sharing Your Survey Effectively</h2>
<p><strong>Email invitations</strong>:</p>
<pre><code>Subject: We'd appreciate your feedback

Dear [Name],

Please take a moment to complete our survey:
[your-survey-link]

Your responses help us improve our services.

Thank you!</code></pre>
<p><strong>QR codes</strong>: Generate a QR code for your survey link to use on printed materials, event displays, product packaging, and business cards.</p>
<p><strong>Social media</strong>: Share directly on platforms where your audience is active.</p>
<h2>Monitoring Responses</h2>
<p>Track your web survey performance in real time:</p>
<ul>
<li>View response count as submissions come in</li>
<li>Check completion rates</li>
<li>Monitor average completion time</li>
<li>Export data anytime</li>
</ul>
<h2>Common Questions</h2>
<p><strong>Can I edit the survey after enabling web mode?</strong>
Yes, but be cautious. Changes affect new responses only. For major changes, consider creating a new version.</p>
<p><strong>Is there a response limit?</strong>
No, you can collect unlimited responses based on your subscription plan.</p>
<p><strong>Can respondents save and return later?</strong>
Enable "Save progress to browser" in survey settings. If respondents close the survey and return on the same device, their previous answers will be preserved. Note that partial submissions only appear after clicking "Submit."</p>
<p><strong>How secure are web surveys?</strong>
All data is encrypted in transit and at rest. Responses are as secure as your PaperSurvey account.</p>]]>
            </summary>
                                    <updated>2026-07-18T08:45:27+00:00</updated>
        </entry>
            <entry>
            <title><![CDATA[How Do I Merge Multiple Survey Responses into One?]]></title>
            <link rel="alternate" href="https://www.papersurvey.io/help/responses/article/how-to-merge-multiple-entries-into-one" />
            <id>https://www.papersurvey.io/66</id>
            <author>
                <name><![CDATA[PaperSurvey.io]]></name>
            </author>
            <summary type="html">
                <![CDATA[<p>Sometimes a single respondent's data ends up split across multiple entries. This can happen when paper surveys are scanned in separate batches or when test responses need consolidation before analysis. PaperSurvey's merge feature lets you combine these entries into one unified response in just a few steps.</p>
<h2>When to Use Response Merging</h2>
<p>Response merging is helpful when paper surveys were scanned in separate batches but belong to one respondent, or when test responses need consolidation before analysis.</p>
<h2>Step-by-Step Instructions</h2>
<h3>1. Enable edit mode</h3>
<p>Navigate to your survey's responses page and click the <strong>"Edit"</strong> button in the bottom-right corner.</p>
<p><img src="/images/blog/response-edit.png" alt="Responses Edit Button" /></p>
<h3>2. Select responses to merge</h3>
<p>Check the boxes next to each response you want to combine. You can select multiple responses that belong together.</p>
<p><img src="/images/blog/check-responses.png" alt="Check Responses" /></p>
<h3>3. Merge the selected responses</h3>
<p>Click the <strong>"Bulk Actions"</strong> button and select <strong>"Merge into One"</strong> from the dropdown menu.</p>
<p><img src="/images/blog/merge-responses.png" alt="Merge Responses" /></p>
<h2>How Merging Works</h2>
<p>When you merge responses, all selected entries combine into a single response and the system preserves data from all selected entries. The entry you selected first becomes the one everything is merged into, and the rest are removed after the merge. If the same question was answered in more than one entry, only the last uploaded non-empty response is kept. Empty responses are dropped in favor of any non-empty answer, and uploaded pages from every selected entry are moved onto the merged entry.</p>
<h2>Important Considerations</h2>
<h3>Data preservation</h3>
<p>Review responses before merging to ensure they actually belong together. The merge action cannot be undone automatically, so it is a good idea to export your data before merging if you need a backup.</p>]]>
            </summary>
                                    <updated>2026-07-18T08:45:27+00:00</updated>
        </entry>
            <entry>
            <title><![CDATA[How Do I Delete Specific Survey Responses?]]></title>
            <link rel="alternate" href="https://www.papersurvey.io/help/responses/article/how-to-remove-specific-records-from-survey-responses" />
            <id>https://www.papersurvey.io/67</id>
            <author>
                <name><![CDATA[PaperSurvey.io]]></name>
            </author>
            <summary type="html">
                <![CDATA[<p>Keeping your dataset clean is essential for accurate analysis. Whether you need to remove test submissions, duplicate entries, or responses with invalid data, PaperSurvey lets you selectively delete specific responses while preserving the rest of your data.</p>
<p>By combining the table filter with bulk actions, you can quickly locate and remove exactly the responses you do not need.</p>
<h2>Step-by-Step Instructions</h2>
<h3>1. Enable edit mode</h3>
<p>Navigate to your survey's responses page and click the <strong>"Edit"</strong> button in the bottom-right corner.</p>
<p><img src="/images/blog/response-edit.png" alt="Responses Edit Button" /></p>
<h3>2. Find responses to delete</h3>
<p>Use the table filter to locate specific responses. Click the search icon in the table header, enter keywords, values, or identifiers, and the table will show only matching responses.</p>
<p><img src="/images/blog/response-filter.png" alt="Responses Filter" /></p>
<h3>3. Select filtered responses</h3>
<p>After filtering, click the checkbox at the top-left corner of the table to select all visible (filtered) responses. Verify the selection shows the correct number of entries.</p>
<p><img src="/images/blog/response-bulk-select.png" alt="Bulk Select" /></p>
<h3>4. Delete selected responses</h3>
<p>Click the <strong>"Bulk Actions"</strong> button, choose <strong>"Delete"</strong> from the dropdown menu, and confirm the deletion when prompted.</p>
<p><img src="/images/blog/response-delete.png" alt="Bulk Delete" /></p>
<h2>Filtering for Accurate Selection</h2>
<h3>Search by specific values</h3>
<ul>
<li><strong>Exact matches</strong>: Enter complete values like email addresses or ID numbers</li>
<li><strong>Partial matches</strong>: Use keywords that appear in responses</li>
<li><strong>Date ranges</strong>: Filter by submission dates to find old test data</li>
<li><strong>Response status</strong>: Filter by completion status or tags</li>
</ul>
<h3>Multiple criteria</h3>
<p>Combine filters for precise selection. For example, filter by date and specific answer values, search by respondent information and response quality, or use tags to group responses before filtering.</p>
<h2>Important Considerations</h2>
<h3>Before deleting</h3>
<ul>
<li><strong>No automatic recovery</strong>: Deleted responses cannot be restored through the interface</li>
<li><strong>Export first</strong>: Save a backup of your data before bulk deletions</li>
<li><strong>Double-check filters</strong>: Ensure filters show only unwanted responses</li>
<li><strong>Count verification</strong>: Confirm the number of selected items matches expectations</li>
</ul>
<h3>Impact on analysis</h3>
<p>Deletion immediately affects all reports and exports. Shared dashboards will reflect the changes, and response counts and statistics update automatically.</p>
<h2>Alternative Approaches</h2>
<p>Instead of permanent deletion, consider these options:</p>
<ul>
<li><strong>Tagging</strong>: Mark responses as "test" or "invalid" and filter them out during analysis</li>
<li><strong>Archiving</strong>: Export unwanted responses before deletion for record-keeping</li>
<li><strong>Separate analysis</strong>: Create filtered views without deleting data</li>
<li><strong>Status updates</strong>: Mark responses as inactive rather than deleting</li>
</ul>]]>
            </summary>
                                    <updated>2026-03-29T04:30:48+00:00</updated>
        </entry>
            <entry>
            <title><![CDATA[How to Delete Your Account]]></title>
            <link rel="alternate" href="https://www.papersurvey.io/help/account-settings/article/how-to-delete-my-account" />
            <id>https://www.papersurvey.io/68</id>
            <author>
                <name><![CDATA[PaperSurvey.io]]></name>
            </author>
            <summary type="html">
                <![CDATA[<p>If you no longer need your PaperSurvey account, you can permanently delete it through your account settings. This action is irreversible and will remove all your data, including surveys, responses, and team information. Before proceeding, make sure you have exported anything you want to keep.</p>
<h2>Steps to delete your account</h2>
<p><img src="/images/blog/account-personal-settings.png" alt="Personal settings with delete account button" /></p>
<ol>
<li>Go to <strong>Settings</strong> and open the <strong>Personal</strong> page</li>
<li>Scroll to the bottom of the page</li>
<li>Click <strong>Permanently delete my account</strong></li>
<li>Confirm your identity with your password or a passkey</li>
<li>Click <strong>Confirm</strong></li>
</ol>
<h2>What gets deleted</h2>
<p>When you delete your account, the following will be permanently removed:</p>
<ul>
<li><strong>All surveys and survey templates</strong></li>
<li><strong>Collected responses and uploaded documents</strong></li>
<li><strong>Export history and generated reports</strong></li>
<li><strong>Team memberships and shared access</strong></li>
<li><strong>Subscription and billing history</strong></li>
<li><strong>Account settings and preferences</strong></li>
</ul>
<h2>Before you delete</h2>
<p>Consider these alternatives before deleting your account:</p>
<ul>
<li><strong>Cancel your subscription</strong> to stop billing while keeping your account and data</li>
<li><strong>Export your data</strong> to download all surveys and responses first</li>
<li><strong>Delete individual surveys</strong> you no longer need. Deleted surveys stay in the trash bin for 90 days, so you can restore them if you change your mind</li>
</ul>
<h2>Data deletion timeline</h2>
<p>When you delete your account:</p>
<ul>
<li><strong>Immediate</strong>: Account access is revoked, any active subscription is cancelled, and your web survey links stop accepting responses</li>
<li><strong>Within 90 days</strong>: Surveys, uploaded documents, and associated database records are permanently removed from our systems</li>
</ul>
<h2>Important warnings</h2>
<ul>
<li>Deletion is immediate and cannot be undone</li>
<li>Active subscriptions will be cancelled without refund</li>
<li>Shared surveys will become inaccessible to team members</li>
<li>Any scheduled webhooks or integrations will stop working</li>
<li>Data in backup systems is not accessible but may exist for up to 90 days</li>
</ul>]]>
            </summary>
                                    <updated>2026-07-17T12:49:14+00:00</updated>
        </entry>
            <entry>
            <title><![CDATA[How Do I Tag Survey Responses?]]></title>
            <link rel="alternate" href="https://www.papersurvey.io/help/responses/article/tag-survey-responses" />
            <id>https://www.papersurvey.io/69</id>
            <author>
                <name><![CDATA[PaperSurvey.io]]></name>
            </author>
            <summary type="html">
                <![CDATA[<p>Tags let you organize survey responses into meaningful groups so you can filter, export, and analyze subsets of your data with ease. Whether you want to categorize by collection location, date, event, instructor, or any other criteria, tagging gives you the flexibility to work with exactly the data you need.</p>
<p>You can apply tags before or after data collection, depending on your workflow and whether your surveys use unique page marking.</p>
<p><img src="/images/tagging-info.png" alt="Tagging survey responses" /></p>
<h2>Tagging Overview</h2>
<p>Tags serve as labels that help you:</p>
<ul>
<li>Group responses by collection method or source</li>
<li>Filter data for specific analysis</li>
<li>Track responses across different locations or time periods</li>
<li>Identify test data or special cases</li>
<li>Export filtered datasets based on categories</li>
<li>Attach structured data points that become their own export columns (see <a href="#structured-tags-keyvalue">Structured Tags</a> below)</li>
</ul>
<h2>Tagging Methods Comparison</h2>
<p>Your tagging options depend on whether you use <a href="/help/printing/article/unique-paper-survey-identifiers">unique page marking</a>:</p>
<h3>Without unique page marking</h3>
<ul>
<li>Create multiple survey versions</li>
<li>Tag after data collection</li>
</ul>
<h3>With unique page marking</h3>
<ul>
<li>Set batch numbers when printing</li>
<li>Add identifier prefixes</li>
<li>Create multiple survey versions</li>
<li>Use prefill forms (advanced)</li>
<li>Tag after data collection</li>
</ul>
<h2>Method 1: Tag Before Data Collection</h2>
<p>Pre-collection tagging works best for paper surveys with unique page marking. This approach embeds tags directly into printed forms.</p>
<h3>Set batch number when generating copies</h3>
<p><img src="/images/batch.png" alt="Survey batch number" /></p>
<p>Batch numbers identify groups of surveys printed together:</p>
<ol>
<li>Navigate to the Print tab</li>
<li>Enable unique page marking</li>
<li>Click Generate to start creating PDFs</li>
<li>Enter a batch label after generation starts</li>
<li>Each form in that batch carries this identifier</li>
</ol>
<p><strong>Use cases</strong>: Track forms by print date, distribution location, or event.</p>
<h3>Set identifier prefix when generating copies</h3>
<p><img src="/images/prefix.png" alt="Prefix survey identifiers" /></p>
<p>Prefixes customize the unique identifiers on each page:</p>
<ol>
<li>Enable unique page marking in Print settings</li>
<li>Enter a prefix (letters, numbers, underscores, and dashes, up to 15 characters)</li>
<li>Generate your copies</li>
</ol>
<p><strong>Example</strong>: Prefix "NYC_" creates identifiers NYC_1, NYC_2, NYC_3...</p>
<p><strong>Use cases</strong>: Identify surveys by location, department, or study phase.</p>
<h3>Create multiple survey versions</h3>
<p><img src="/images/survey_versions.png" alt="Survey versions" /></p>
<p>Survey versions let you create variations with built-in tags:</p>
<ol>
<li>Go to the Print tab</li>
<li>Click "Create Version"</li>
<li>Name each version descriptively</li>
<li>Enable "Advanced Versioning" for easy renaming</li>
</ol>
<p>One thing to keep in mind: if you decide to update the survey later on, you will need to recreate all of the versions.</p>
<h3>Use prefill forms (Advanced)</h3>
<p><a href="https://www.papersurvey.io/help/prefill-data/article/how-to-prefill-survey-data-in-form">Prefill forms</a> embed respondent information directly into forms. This advanced feature requires technical setup but provides the most detailed tagging.</p>
<h2>Method 2: Tag After Data Collection</h2>
<p>Post-collection tagging works for all survey types and collection methods.</p>
<h3>Web upload tagging</h3>
<p><img src="/images/upload_tag.png" alt="Upload and tag" /></p>
<p>Add tags during the upload process:</p>
<ol>
<li>Scan your completed surveys</li>
<li>Click "Upload" in your survey dashboard</li>
<li>Enter a tag in the tag field</li>
<li>Complete the upload</li>
</ol>
<h3>Email upload tagging</h3>
<p>Use the +plus notation in email addresses:</p>
<ul>
<li>Base email: <code>demo@upload.papersurvey.io</code></li>
<li>Tagged email: <code>demo+classroom1@upload.papersurvey.io</code></li>
</ul>
<p>The system extracts "classroom1" as the tag automatically.</p>
<p>Alternatively, all uploads can be <a href="/app/settings">tagged with sender address</a>. For example, if <em>john.doe@example.com</em> uploads scanned documents, all of their responses will be tagged with the <em>john.doe@example.com</em> email.</p>
<h3>Web survey tagging</h3>
<p>Add tags via URL parameters:</p>
<pre><code>https://www.papersurvey.io/s/52k6rk?tag=spring2024</code></pre>
<p>Share different URLs with different groups to automatically tag responses.</p>
<h3>API and integration tagging</h3>
<ul>
<li><strong>Zapier</strong>: Default tag "zapier"</li>
<li><strong>API</strong>: Default tag "api"</li>
<li><strong>Mobile app</strong>: Default tag "mobile_app"</li>
</ul>
<p>Custom tags are not available for these methods. Use bulk updates afterward to apply your own tags.</p>
<h2>Updating Existing Tags</h2>
<h3>Bulk tag updates</h3>
<p><img src="/images/update_tag.png" alt="Update tag" /></p>
<p>To change tags for existing responses:</p>
<ol>
<li>Go to your Responses page</li>
<li>Click "Edit" mode</li>
<li>Select responses using checkboxes</li>
<li>Click "Bulk actions" then "Update Tag"</li>
<li>Enter the new tag and confirm</li>
</ol>
<h2>Tag Management</h2>
<h3>Filtering by tags</h3>
<p>Use the filter option in the Responses view to select one or multiple tags, export filtered data for analysis, and create saved views for common filters.</p>
<p>When structured <code>KEY:VALUE</code> tags are in use, the tag filters in the Responses table and in the Dashboard and Analysis views group them by key. For example, with tags <code>Venue:Main Hall</code>, <code>Venue:Cafeteria</code>, and <code>School:Lincoln High</code>, the filter shows a Venue group and a School group, each listing its values, alongside your regular tags.</p>
<h3>Combining tags</h3>
<p>Each response can have multiple tags. You can assign additional tags through bulk actions, use prefill forms for multiple data points, or combine tags with other fields for more detailed filtering.</p>
<h2>Structured Tags (KEY:VALUE)</h2>
<p>A tag written as <code>KEY:VALUE</code> is treated as a structured tag: the part before the first colon is the key, the part after it is the value. Structured tags work everywhere regular tags do, and add two things on top:</p>
<ul>
<li>In the app, the key is highlighted inside the tag pill, so <code>Venue:Main Hall</code> reads at a glance as the key "Venue" with the value "Main Hall".</li>
<li>In data exports, each key automatically becomes its own column, filled with the value for every response that carries that key.</li>
</ul>
<p>There is nothing to configure. Type the tag with a colon and PaperSurvey does the rest.</p>
<h3>Examples of structured tags</h3>
<p>Any key that describes your data works:</p>
<ul>
<li><code>Venue:Main Hall</code>, <code>Venue:Cafeteria</code>, <code>Venue:Library</code></li>
<li><code>School:Lincoln High</code>, <code>School:Riverside Elementary</code></li>
<li><code>Class:5B</code>, <code>Class:6A</code></li>
<li><code>Location:Berlin</code>, <code>Location:Vilnius</code></li>
<li><code>Cohort:2026</code></li>
<li><code>Instructor:Dr. Smith</code></li>
<li><code>Event:Spring Gala</code></li>
<li><code>Shift:Night</code></li>
<li><code>Department:Radiology</code></li>
<li><code>Session:Morning</code>, <code>Session:Afternoon</code></li>
</ul>
<p>Only the first colon splits the tag, so values may contain colons themselves: <code>Time:10:30</code> has the key "Time" and the value "10:30".</p>
<p>Tags without a colon, such as <code>VIP</code>, <code>Urgent</code>, or <code>Test data</code>, remain regular tags and behave exactly as before. Web addresses like <code>http://example.com</code> are also left alone; they are not mistaken for structured tags.</p>
<h3>How structured tags appear in exports</h3>
<p>Suppose three responses are tagged like this:</p>
<table>
<thead>
<tr>
<th>Response</th>
<th>Tags</th>
</tr>
</thead>
<tbody>
<tr>
<td>1</td>
<td><code>Venue:Main Hall</code>, <code>School:Lincoln High</code>, <code>VIP</code></td>
</tr>
<tr>
<td>2</td>
<td><code>Venue:Cafeteria</code>, <code>School:Riverside Elementary</code></td>
</tr>
<tr>
<td>3</td>
<td><code>Cohort:2026</code></td>
</tr>
</tbody>
</table>
<p>The export gains one column per key, next to the regular Tag column:</p>
<table>
<thead>
<tr>
<th>Tag</th>
<th>Cohort</th>
<th>School</th>
<th>Venue</th>
</tr>
</thead>
<tbody>
<tr>
<td>Venue:Main Hall, School:Lincoln High, VIP</td>
<td></td>
<td>Lincoln High</td>
<td>Main Hall</td>
</tr>
<tr>
<td>Venue:Cafeteria, School:Riverside Elementary</td>
<td></td>
<td>Riverside Elementary</td>
<td>Cafeteria</td>
</tr>
<tr>
<td>Cohort:2026</td>
<td>2026</td>
<td></td>
<td></td>
</tr>
</tbody>
</table>
<p>A few details worth knowing:</p>
<ul>
<li>The regular Tag column is unchanged and still lists every tag, structured or not.</li>
<li>Responses without a given key get an empty cell in that key's column.</li>
<li>Keys match regardless of capitalization, so <code>venue:Cafeteria</code> and <code>Venue:Main Hall</code> share one Venue column.</li>
<li>If one response carries several tags with the same key, for example <code>Language:English</code> and <code>Language:Spanish</code>, the cell contains both values separated by commas.</li>
<li>The key columns appear in Excel, CSV, SPSS, SAS, Stata, and R exports, in multi-survey exports (keys are combined across the surveys), and in connected Google Sheets.</li>
<li>In statistical formats the columns get proper variable names (for example <code>tag_Venue</code> in SAS and Stata, <code>TAG_VENUE</code> in SPSS) with the label "Tag: Venue".</li>
</ul>
<h3>Where structured tags come from</h3>
<p>You can apply structured tags through every tagging method described above:</p>
<ul>
<li>Type <code>Venue:Main Hall</code> in the tag field when uploading scans</li>
<li>Email scans to <code>demo+Venue_MainHall@upload.papersurvey.io</code> style addresses if you prefer plain tags, or apply the structured tag afterwards with a bulk update</li>
<li>Share web survey links like <code>https://www.papersurvey.io/s/52k6rk?tag=School:Lincoln High</code></li>
<li>Use bulk actions on the Responses page to add <code>Cohort:2026</code> to a selection of existing responses</li>
<li>Create tracked prefill links with structured tags attached</li>
</ul>
<h3>Practical patterns</h3>
<ul>
<li>Multi-site studies: tag each site's forms with <code>Location:Berlin</code>, <code>Location:Munich</code>, <code>Location:Hamburg</code>, and the export gives you a ready-made Location column for cross-site comparison.</li>
<li>School assessments: combine <code>School:Lincoln High</code> and <code>Class:5B</code> on the same response, and the export contains separate School and Class columns.</li>
<li>Training sessions: <code>Instructor:Dr. Smith</code> plus <code>Session:Morning</code> lets you pivot results by instructor and by session without touching the questionnaire.</li>
<li>Longitudinal waves: <code>Wave:Baseline</code> and <code>Wave:Follow-up</code> produce a Wave column you can use directly in SPSS or R.</li>
</ul>]]>
            </summary>
                                    <updated>2026-08-05T07:27:34+00:00</updated>
        </entry>
            <entry>
            <title><![CDATA[How Do I Embed a Survey in My Website?]]></title>
            <link rel="alternate" href="https://www.papersurvey.io/help/web-surveys/article/embed-web-survey" />
            <id>https://www.papersurvey.io/70</id>
            <author>
                <name><![CDATA[PaperSurvey.io]]></name>
            </author>
            <summary type="html">
                <![CDATA[<p>You can embed PaperSurvey forms directly into your website pages, allowing visitors to complete surveys without leaving your site. This creates a seamless experience that matches your website's design and keeps visitors engaged throughout the survey process.</p>
<h2>Embedding with JavaScript</h2>
<p>The easiest way to embed your survey is using the JavaScript snippet:</p>
<ol>
<li>Navigate to your survey settings</li>
<li>Click "Embed Code" to generate the snippet</li>
<li>Copy the provided code</li>
<li>Paste it into your website's HTML where you want the survey to appear</li>
</ol>
<img src="/images/blog/embed-code.png" alt="Embed Survey JavaScript Code" style="width:50%"/>
<p>The embed code automatically handles:</p>
<ul>
<li><strong>Responsive sizing</strong> to fit different screen sizes</li>
<li><strong>Height adjustment</strong> based on survey length</li>
<li><strong>Cross-browser compatibility</strong></li>
<li><strong>Mobile device optimization</strong></li>
</ul>
<h2>Customizing the Embedded Survey</h2>
<p>To make the survey blend seamlessly with your website, use <strong>Custom CSS</strong> in the survey settings to match your site's look and feel. You can adjust font families and sizes, colors and backgrounds, button styles, and spacing and margins.</p>
<p><strong>Example CSS</strong>:</p>
<pre><code class="language-css">body { font-family: 'Your-Font', sans-serif; }
.submit-button { background-color: #your-color; }</code></pre>
<p>If you need help with CSS customization, your web developer can assist with matching your site's design.</p>
<h2>Important Considerations</h2>
<p><strong>Browser compatibility</strong>: The embed includes a fallback link reading "Click here to complete survey" for visitors using:</p>
<ul>
<li>Privacy-focused browser extensions that block iframes</li>
<li>Older browsers with limited iframe support</li>
<li>Corporate networks with strict security settings</li>
</ul>
<p><strong>Security restrictions</strong>: Some websites may prevent embedding due to:</p>
<ul>
<li>Content Security Policy (CSP) settings</li>
<li>X-Frame-Options headers</li>
<li>HTTPS/SSL requirements</li>
</ul>
<p>If embedding does not work on your site, consider using a custom domain instead.</p>
<h2>Alternative: Custom Domain Hosting</h2>
<p>For complete control over the survey experience, Enterprise Plus subscribers can host surveys on their own domain. This gives you full branding control, eliminates iframe restrictions, provides direct URL access, and works better for sharing.</p>
<p>Learn more about <a href="/help/web-surveys/article/custom-survey-domain-or-subdomain">custom domain setup</a>.</p>]]>
            </summary>
                                    <updated>2026-07-18T08:45:27+00:00</updated>
        </entry>
            <entry>
            <title><![CDATA[Can I Create a Form in Landscape Format?]]></title>
            <link rel="alternate" href="https://www.papersurvey.io/help/form-design/article/can-i-create-form-in-landscape-format" />
            <id>https://www.papersurvey.io/71</id>
            <author>
                <name><![CDATA[PaperSurvey.io]]></name>
            </author>
            <summary type="html">
                <![CDATA[<p>Page orientation affects how much content fits on each page and how respondents interact with your survey. PaperSurvey currently supports portrait layout only. Landscape orientation is not available at this time.</p>
<p>If you need to fit more content on a single page, consider using <a href="/help/form-design/article/multi-column-paper-survey-layout">multi-column layouts</a> or adjusting your <a href="/help/form-design/article/can-i-create-survey-smaller-than-full-paper">paper size</a> to a larger format such as A3 or Legal.</p>]]>
            </summary>
                                    <updated>2026-07-17T12:49:14+00:00</updated>
        </entry>
            <entry>
            <title><![CDATA[How to Create Anonymous Linked Pre/Post Surveys]]></title>
            <link rel="alternate" href="https://www.papersurvey.io/help/printing/article/pre-post-surveys" />
            <id>https://www.papersurvey.io/72</id>
            <author>
                <name><![CDATA[PaperSurvey.io]]></name>
            </author>
            <summary type="html">
                <![CDATA[<p>PaperSurvey supports anonymous pre/post surveys that track changes over time while maintaining respondent privacy. This feature is essential for measuring the impact of interventions, training programs, or treatments, and PaperSurvey offers multiple methods to fit your specific workflow.</p>
<h2>Understanding Pre/Post Survey Requirements</h2>
<p>Pre/post surveys need to:</p>
<ul>
<li>Link responses from the same person across time points</li>
<li>Maintain complete anonymity</li>
<li>Handle varying response rates between pre and post phases</li>
<li>Support flexible distribution methods</li>
</ul>
<h2>Choose Your Method Based on Your Needs</h2>
<p>PaperSurvey offers four proven methods for implementing pre/post surveys. Select the one that best matches your sample size, distribution constraints, and technical requirements.</p>
<p><img src="/images/blog/print-download-pdf.png" alt="Print tab with version for printing" /></p>
<h2>Method 1: Single Survey with Unique Page Marking (Recommended)</h2>
<p>Best for: Most scenarios where you can control distribution.</p>
<h3>How It Works</h3>
<ol>
<li>Create one survey containing both pre and post questions</li>
<li>Enable unique page marking in survey settings</li>
<li>Print copies and separate pre/post sections into different envelopes</li>
<li>Distribute pre-survey first, post-survey later</li>
<li>Upload responses separately. PaperSurvey automatically links matching IDs.</li>
</ol>
<h3>Advantages</h3>
<ul>
<li>Automatic linking with no manual work</li>
<li>Handles any time gap between pre and post</li>
<li>Supports batch processing</li>
<li>Most reliable method</li>
</ul>
<h3>Important Note</h3>
<p>If you prefer not using unique page marking, scan both pre and post responses in the same PDF file for proper linking.</p>
<h2>Method 2: Single Survey Without Unique Marking</h2>
<p>Best for: Situations where photocopying might be needed.</p>
<h3>How It Works</h3>
<ol>
<li>Create one survey with both pre and post questions</li>
<li>Download PDF and manually split into pre-survey.pdf and post-survey.pdf</li>
<li>Print both parts with matching quantities</li>
<li>Distribute pre-surveys first</li>
<li>Ask respondents to keep their pre-survey until post distribution</li>
<li>Collect and scan both parts together in one file</li>
</ol>
<h3>Advantages</h3>
<ul>
<li>Allows photocopying if needed</li>
<li>Simple distribution process</li>
<li>No special settings required</li>
</ul>
<h3>Limitations</h3>
<ul>
<li>Requires respondents to retain papers</li>
<li>Both parts must be scanned together</li>
</ul>
<h2>Method 3: Two Surveys with Identifier Field</h2>
<p>Best for: Maximum flexibility or existing ID systems.</p>
<h3>How It Works</h3>
<ol>
<li>Create separate pre and post surveys</li>
<li>Add a number field for identifier entry in both</li>
<li>Generate unique identifiers (e.g., 1001, 1002, 1003...)</li>
<li>Distribute identifiers to respondents</li>
<li>Export data separately and merge using identifiers</li>
</ol>
<h3>Advantages</h3>
<ul>
<li>Works with existing participant ID systems</li>
<li>Surveys can be completely different</li>
<li>Flexible timing and distribution</li>
</ul>
<h3>Considerations</h3>
<ul>
<li>Requires manual data merging</li>
<li>Participants must remember their identifier</li>
<li>Risk of transcription errors</li>
</ul>
<h2>Method 4: Two Surveys Without Linking</h2>
<p>Best for: When individual tracking is not required.</p>
<h3>How It Works</h3>
<ol>
<li>Create separate pre and post surveys</li>
<li>Distribute and collect independently</li>
<li>Analyze aggregate changes only</li>
</ol>
<h3>Limitations</h3>
<ul>
<li>No paired statistical analyses possible</li>
<li>Cannot track individual progress</li>
<li>Only suitable for group-level comparisons</li>
</ul>
<h3>Common Challenges and Solutions</h3>
<p><strong>Challenge</strong>: Low post-survey return rate.
<strong>Solution</strong>: Send reminders, emphasize importance, consider incentives.</p>
<p><strong>Challenge</strong>: Mismatched pre/post responses.
<strong>Solution</strong>: Use Method 1 with unique marking for automatic matching.</p>
<p><strong>Challenge</strong>: Long gap between phases.
<strong>Solution</strong>: Methods 1 and 3 handle any time gap effectively.</p>
<h2>Technical Notes</h2>
<ol>
<li><strong>Test your chosen method</strong> with a small pilot group</li>
<li><strong>Document your process</strong> for team members</li>
<li><strong>Plan for non-responses</strong>, as typically 20-30% do not complete both phases</li>
<li><strong>Export data promptly</strong> after each phase for backup</li>
</ol>
<h2>Choosing the Right Method</h2>
<ul>
<li><strong>Method 1</strong>: Choose when you need reliable, automated matching</li>
<li><strong>Method 2</strong>: Select when simplicity and photocopying capability matter</li>
<li><strong>Method 3</strong>: Use when you have existing ID systems or need maximum flexibility</li>
<li><strong>Method 4</strong>: Only when individual tracking truly is not needed</li>
</ul>
<p>Most users find Method 1 provides the best balance of reliability and ease of use.</p>]]>
            </summary>
                                    <updated>2026-03-29T09:58:15+00:00</updated>
        </entry>
            <entry>
            <title><![CDATA[How to Move an Uploaded Page to a Different Response]]></title>
            <link rel="alternate" href="https://www.papersurvey.io/help/responses/article/moving-pages-to-a-different-entry" />
            <id>https://www.papersurvey.io/73</id>
            <author>
                <name><![CDATA[PaperSurvey.io]]></name>
            </author>
            <summary type="html">
                <![CDATA[<p>If a page was incorrectly assigned to the wrong response during manual entry, you can easily move it to the correct one. This is a common situation when processing multi-page paper surveys, and correcting it takes only a few clicks.</p>
<h2>Step-by-Step Instructions</h2>
<h3>1. Enable edit mode</h3>
<p>Click the <strong>"Edit"</strong> button located at the bottom-right corner of your responses page.</p>
<p><img src="/images/blog/response-edit.png" alt="Responses Edit Button" /></p>
<h3>2. Select the target response</h3>
<p>Select the response to which you want to move the page.</p>
<p><img src="/images/blog/check-responses.png" alt="Check Responses" /></p>
<h3>3. Move the page</h3>
<p>Hover over the page in the "Uploads" column and click on the <strong>"Move pages to a different entry"</strong> option.</p>
<p>The page will be reassigned to the selected response immediately. You can verify the change by reviewing both entries to confirm the page now appears under the correct response.</p>]]>
            </summary>
                                    <updated>2026-03-29T04:30:48+00:00</updated>
        </entry>
            <entry>
            <title><![CDATA[Editing and Verifying Survey Responses]]></title>
            <link rel="alternate" href="https://www.papersurvey.io/help/scanning/article/editing-responses" />
            <id>https://www.papersurvey.io/74</id>
            <author>
                <name><![CDATA[PaperSurvey.io]]></name>
            </author>
            <summary type="html">
                <![CDATA[<p>After collecting paper survey responses, you may need to correct recognition errors or verify handwritten fields. PaperSurvey gives you full control over who performs this verification, whether it is you, your employees, students, or outsourced personnel.</p>
<p>To modify survey responses:</p>
<ol>
<li>Open your survey and go to the <strong>Responses</strong> tab</li>
<li>To find a specific entry, use the search or filter options in the column headers (e.g., search by entry ID or identifier)</li>
<li>Toggle the <strong>Edit</strong> switch in the toolbar to enable editing</li>
<li>Click on any cell to modify the response value</li>
</ol>
<p>You can also link directly to a specific entry by adding a filter to the URL, for example: <code>https://www.papersurvey.io/app/surveys/my-survey/responses?public_id[0]=WEB_123</code></p>
<p>To minimize costs, PaperSurvey leaves data verification to your discretion so you can choose the most efficient approach for your team.</p>
<p><img src="/images/blog/team-settings.png" alt="My team settings" /></p>
<center><i>You can access your team settings <a href="/app/settings/team">here</a></i></center>
<h2>How to Invite Someone to Your Account</h2>
<p>You have several options for inviting additional users to your account.</p>
<ol>
<li>
<p><strong>Member Access</strong>: Invite users as members to grant them full access to <a href="https://papersurvey.io">papersurvey.io</a>. They can create, update, or remove surveys and responses. This method is suitable for users you completely trust.</p>
</li>
<li>
<p><strong>Verification Operator Access</strong>: Invite users as verification operators, granting them access to the verification area for specific surveys in your account. You can set a limit on their access duration. This approach is ideal when you want people to verify responses without giving them full access to collected data. It also ensures anonymous verification, as operators can only view question excerpts and, if necessary, open the full page.</p>
</li>
</ol>
<p><img src="/images/blog/verification-access.png" alt="Verification access view" /></p>
<center><i>This is what Verification Operators see when they open the link.</i></center>
<p>Verification Operators do not need to create an account on <a href="https://papersurvey.io">papersurvey.io</a>. To begin verification, they only need to open an unguessable link sent to their email address.</p>
<p><img src="/images/blog/email-verification-access.png" alt="Verification operator email" /></p>
<center><i>Email sent to Verification Operator.</i></center>
<p>Ready to speed up your verification process? Head to your <a href="/app/settings/team">team settings</a> to invite members or verification operators.</p>]]>
            </summary>
                                    <updated>2026-03-29T09:58:15+00:00</updated>
        </entry>
            <entry>
            <title><![CDATA[What Is the Minimum Subscription Duration?]]></title>
            <link rel="alternate" href="https://www.papersurvey.io/help/subscription/article/what-is-minimum-subscribtion-duration" />
            <id>https://www.papersurvey.io/75</id>
            <author>
                <name><![CDATA[PaperSurvey.io]]></name>
            </author>
            <summary type="html">
                <![CDATA[<p>There is no minimum commitment. Monthly plans renew each month and can be cancelled at any time, and you keep access until the end of your current billing period. There are no long-term contracts required, so you can start, pause, or cancel whenever your needs change.</p>
<p>We believe in earning your business every billing cycle, which is why we keep our terms flexible.</p>
<h2>Flexible Subscription Options</h2>
<p>We offer two billing cycles:</p>
<ul>
<li><strong>Monthly</strong>: Pay once per month</li>
<li><strong>Annual</strong>: Pay yearly for the equivalent of ten monthly payments, so two months are effectively free</li>
</ul>
<p>Both options can be canceled anytime without penalties.</p>
<h2>No Lock-In Commitment</h2>
<ul>
<li><strong>Start anytime</strong>: Begin using PaperSurvey immediately</li>
<li><strong>Cancel anytime</strong>: No questions asked</li>
<li><strong>No cancellation fees</strong>: Ever</li>
<li><strong>No minimum contract</strong>: Month-to-month is perfectly fine</li>
</ul>
<h2>How Billing Periods Work</h2>
<p><strong>Monthly subscriptions</strong> are billed each month on the same date. Cancel before renewal to avoid the next charge, and you keep access until your current period ends.</p>
<p><strong>Annual subscriptions</strong> are billed once per year for the equivalent of ten monthly payments, so two months are effectively free compared to monthly billing. You can still cancel anytime, though no refunds are issued on unused time.</p>
<h2>Perfect for Different Needs</h2>
<p>Our flexible terms work for short projects (subscribe for just one month), seasonal work (stay active only when needed), trial periods (test with real projects), and ongoing operations (save with annual billing).</p>
<h2>What Happens After One Month?</h2>
<p>Unless you cancel, monthly plans auto-renew each month and annual plans auto-renew after one year. You receive email reminders before renewal and can update payment methods anytime.</p>
<h2>Pausing vs. Canceling</h2>
<p>If you need a break, cancel your subscription and your data remains for 90 days. Resubscribe whenever you are ready and pick up where you left off.</p>]]>
            </summary>
                                    <updated>2026-07-18T08:45:27+00:00</updated>
        </entry>
            <entry>
            <title><![CDATA[What Is the Processing Time for Large Uploads?]]></title>
            <link rel="alternate" href="https://www.papersurvey.io/help/recognition/article/what-is-the-reading-time" />
            <id>https://www.papersurvey.io/76</id>
            <author>
                <name><![CDATA[PaperSurvey.io]]></name>
            </author>
            <summary type="html">
                <![CDATA[<p>When you upload hundreds or thousands of scanned survey pages, processing time becomes an important planning consideration. PaperSurvey automatically scales its infrastructure to handle large volumes efficiently, but understanding the expected timelines helps you plan your workflow.</p>
<h2>Expected processing speeds</h2>
<p>For large uploads, expect approximately:</p>
<ul>
<li><strong>1,000 pages</strong> in 30-60 minutes</li>
<li><strong>10,000 pages</strong> in 3-5 hours</li>
<li><strong>50,000 pages</strong> in 12-24 hours</li>
</ul>
<p>These are estimates for typical surveys. Actual times vary based on survey complexity and current system load.</p>
<h2>Factors affecting processing speed</h2>
<h3>Survey complexity</h3>
<ul>
<li><strong>Simple surveys</strong> (multiple choice only) process fastest</li>
<li><strong>Mixed surveys</strong> (checkboxes + text) take moderate time</li>
<li><strong>Text-heavy surveys</strong> (handwriting recognition) are slower</li>
</ul>
<h3>File characteristics</h3>
<ul>
<li><strong>File format.</strong> PDFs process faster than individual images.</li>
<li><strong>Scan quality.</strong> Clear scans process more quickly than noisy ones.</li>
<li><strong>Page count per file.</strong> Larger files take longer to initialize.</li>
</ul>
<h3>System factors</h3>
<ul>
<li><strong>Current queue size.</strong> Busy periods may add wait time.</li>
<li><strong>Auto-scaling.</strong> The system adds resources for large jobs automatically.</li>
<li><strong>Priority processing.</strong> Available for urgent needs upon request.</li>
</ul>
<h2>What happens during processing</h2>
<ol>
<li><strong>Upload phase.</strong> Files transfer to our servers.</li>
<li><strong>Queue entry.</strong> The job enters the processing queue.</li>
<li><strong>Page extraction.</strong> Multi-page documents are split into individual pages.</li>
<li><strong>Field processing.</strong> Each page is analyzed for responses.</li>
<li><strong>Verification.</strong> Results are validated against expected formats.</li>
<li><strong>Compilation.</strong> Data is assembled and made available for review.</li>
</ol>
<h2>Monitoring your upload</h2>
<h3>Real-time status</h3>
<ul>
<li>Track progress in the Uploads section</li>
<li>See pages completed versus total</li>
</ul>
<h3>Processing states</h3>
<ul>
<li><strong>Uploading</strong> means the file transfer is in progress</li>
<li><strong>Processing</strong> means the document is being analyzed and separated into individual pages</li>
<li><strong>Extracting data</strong> means responses are being read from the pages; once completed, the results are ready for review</li>
<li><strong>Delayed processing</strong> means processing was temporarily paused for review by our technical team, generally resolved within 3-24 hours</li>
<li>Pages that could not be matched to your survey appear under <strong>Unrecognized Pages</strong> for your attention</li>
</ul>
<h2>Handling urgent deadlines</h2>
<p>If you need faster processing, contact our support team with your deadline requirements, total page count, and a request for priority processing. Planning ahead by uploading as early as possible, processing in smaller batches, and running test batches first will also help you meet tight deadlines.</p>
<h2>System scaling</h2>
<p>PaperSurvey automatically handles high-volume periods by adding processing servers during peak loads, distributing work across multiple servers, prioritizing active customers, and maintaining performance standards throughout.</p>
<h2>Common questions</h2>
<p><strong>Can I upload while processing?</strong>
Yes, you can upload additional files while others are being processed.</p>
<p><strong>Will my job slow down other users?</strong>
No. The system scales to maintain performance for all users simultaneously.</p>
<p><strong>What if I uploaded the wrong file?</strong>
You can delete an upload from the Uploads page. Keep in mind that deleting an upload also removes the responses that were extracted from it.</p>
<p><strong>Do uploads expire?</strong>
Completed uploads remain available indefinitely.</p>]]>
            </summary>
                                    <updated>2026-07-18T07:29:35+00:00</updated>
        </entry>
            <entry>
            <title><![CDATA[Can I Pay Using PayPal?]]></title>
            <link rel="alternate" href="https://www.papersurvey.io/help/subscription/article/can-i-pay-using-paypal" />
            <id>https://www.papersurvey.io/77</id>
            <author>
                <name><![CDATA[PaperSurvey.io]]></name>
            </author>
            <summary type="html">
                <![CDATA[<p>PayPal is not currently available as a payment method on PaperSurvey. We accept credit cards and debit cards through Stripe, our secure payment processor, and offer bank transfers for qualifying enterprise accounts.</p>
<p>Understanding your options will help you choose the most convenient way to get started.</p>
<h2>Available Payment Methods</h2>
<p>We currently accept:</p>
<ul>
<li><strong>Credit cards</strong>: Visa, Mastercard, American Express, Discover</li>
<li><strong>Debit cards</strong>: With Visa or Mastercard logos</li>
<li><strong>Bank transfers</strong>: Available for Enterprise Plus yearly plans ($2,500+)</li>
</ul>
<p>All card payments are processed securely through Stripe.</p>
<h2>Alternative Payment Options</h2>
<p>If you are unable to use a credit or debit card:</p>
<ol>
<li>
<p><strong>Bank transfer</strong>: Available for Enterprise Plus yearly subscriptions ($2,500+). Contact <a href="mailto:support@papersurvey.io">support@papersurvey.io</a> to arrange payment.</p>
</li>
<li>
<p><strong>Company purchase orders</strong>: For Enterprise Plus customers ($2,500+), we can work with your procurement process. Please reach out to our support team.</p>
</li>
</ol>
<h2>Why We Don't Support PayPal</h2>
<p>We have chosen to focus on direct card payments and bank transfers to keep our pricing competitive and streamline our billing processes.</p>]]>
            </summary>
                                    <updated>2026-03-29T04:30:48+00:00</updated>
        </entry>
            <entry>
            <title><![CDATA[How Do I Get Invoices for My Subscription?]]></title>
            <link rel="alternate" href="https://www.papersurvey.io/help/subscription/article/how-do-i-get-invoices" />
            <id>https://www.papersurvey.io/78</id>
            <author>
                <name><![CDATA[PaperSurvey.io]]></name>
            </author>
            <summary type="html">
                <![CDATA[<p>Invoices are automatically generated for every payment and are available instantly in your account. You can download them as PDFs, set up automatic email delivery, and customize the billing details that appear on each invoice.</p>
<p>Having easy access to invoices is important for accounting, expense reports, and tax purposes. Here is how to manage yours.</p>
<h2>Accessing Your Invoices</h2>
<p>All your invoices are stored in one place:</p>
<ol>
<li>Go to <a href="/app/settings/subscription">Account settings then Subscription</a></li>
<li>Click on "Invoices" to view your billing history</li>
<li>Download any invoice as a PDF</li>
</ol>
<p>Each invoice includes your company details (if provided), payment date and amount, service period covered, our company registration details, and VAT information where applicable.</p>
<h2>Setting Up Automatic Email Delivery</h2>
<p>To receive invoices directly in your inbox:</p>
<ol>
<li>Navigate to your subscription settings</li>
<li>Enter your preferred email address in the invoice delivery section</li>
<li>Save your preferences</li>
</ol>
<p><img src="/images/blog/invoice-email.png" alt="Invoice to Email" /></p>
<p>You will receive invoices automatically after each payment.</p>
<h2>Customizing Invoice Details</h2>
<p>If you need your company name or tax ID on invoices:</p>
<ol>
<li>Go to your subscription settings</li>
<li>Update your billing information</li>
<li>Future invoices will include these details</li>
</ol>
<p>Previously generated invoices will not update retroactively, so it is best to set up your billing details before your first payment.</p>
<h2>VAT and Tax Information</h2>
<ul>
<li><strong>EU businesses</strong>: Provide your VAT number to remove VAT charges in future invoices</li>
<li><strong>Non-EU customers</strong>: No VAT applied</li>
<li><strong>All invoices</strong>: Tax details are clearly shown on each invoice</li>
</ul>]]>
            </summary>
                                    <updated>2026-03-29T04:30:48+00:00</updated>
        </entry>
            <entry>
            <title><![CDATA[Is It Possible to Pay by Bank Transfer?]]></title>
            <link rel="alternate" href="https://www.papersurvey.io/help/subscription/article/is-it-possible-to-pay-by-bank-transfer" />
            <id>https://www.papersurvey.io/79</id>
            <author>
                <name><![CDATA[PaperSurvey.io]]></name>
            </author>
            <summary type="html">
                <![CDATA[<p>Bank transfers are available for Enterprise Plus annual subscriptions of $2,500 or more. Many organizations prefer or require this payment method, and we are happy to accommodate qualifying accounts.</p>
<p>For smaller plans, our secure card payment system provides immediate access without the delays of manual transfers.</p>
<h2>Eligibility for Bank Transfers</h2>
<p>Bank transfer payment is available for:</p>
<ul>
<li><strong>Enterprise Plus plans</strong> with annual billing</li>
<li><strong>Minimum commitment</strong>: $2,500/year (20,000+ pages)</li>
<li><strong>Payment terms</strong>: Annual payment in advance</li>
</ul>
<h2>How to Arrange a Bank Transfer</h2>
<ol>
<li><strong>Contact our team</strong> at <a href="mailto:support@papersurvey.io">support@papersurvey.io</a></li>
<li><strong>Specify your requirements</strong>: number of pages needed per month, preferred billing period, and your organization's details</li>
<li><strong>Receive banking details</strong> and a formal invoice</li>
<li><strong>Complete the transfer</strong> through your standard process</li>
<li><strong>Account activation</strong> within 24 hours of payment receipt</li>
</ol>
<h2>What We'll Need from You</h2>
<p>To process your bank transfer efficiently:</p>
<ul>
<li>Organization name and billing address</li>
<li>Contact person for billing matters</li>
<li>VAT number (if applicable)</li>
<li>Any specific invoicing requirements</li>
</ul>
<h2>Why Bank Transfers Are Limited to Larger Plans</h2>
<p>We limit bank transfers to enterprise plans to keep our pricing competitive for smaller accounts, reduce administrative overhead, and ensure faster account activation for most users.</p>
<h2>Alternative Payment Methods</h2>
<p>For plans under $2,500/year, we offer:</p>
<ul>
<li><strong>Credit/debit cards</strong>: Instant activation</li>
<li><strong>Company cards</strong>: Accepted with proper authorization</li>
<li><strong>Annual billing</strong>: Two months effectively free compared to monthly</li>
</ul>
<h2>Access Through Procurement Partners</h2>
<p>Organizations can also obtain PaperSurvey through:</p>
<ul>
<li><strong>IT procurement partners</strong>: Work with your preferred technology vendor</li>
<li><strong>Software resellers</strong>: Available through major software distributors</li>
<li><strong>Educational distributors</strong>: Special arrangements for academic institutions</li>
</ul>
<p>These partners can often handle purchase orders, net payment terms, and consolidated billing with other software.</p>
<h2>Need a Custom Arrangement?</h2>
<p>If you have specific payment requirements or need a custom plan, our sales team can help. Contact <a href="mailto:support@papersurvey.io">support@papersurvey.io</a> to discuss your needs.</p>]]>
            </summary>
                                    <updated>2026-07-18T08:45:27+00:00</updated>
        </entry>
            <entry>
            <title><![CDATA[Why Does My Card Keep Getting Declined?]]></title>
            <link rel="alternate" href="https://www.papersurvey.io/help/subscription/article/why-does-my-card-keep-getting-declined" />
            <id>https://www.papersurvey.io/80</id>
            <author>
                <name><![CDATA[PaperSurvey.io]]></name>
            </author>
            <summary type="html">
                <![CDATA[<p>Card declines are frustrating, but they are usually easy to resolve. The most common reason is that your bank blocks international transactions, since PaperSurvey is based in Lithuania. A quick call to your bank is typically all it takes to fix the issue.</p>
<p>This guide walks you through the most common causes and how to resolve them.</p>
<h2>Most Common Reason: International Payments</h2>
<p>Many banks automatically block international transactions for security:</p>
<ul>
<li><strong>PaperSurvey is based in Lithuania</strong> (European Union)</li>
<li>Your bank may flag this as suspicious activity</li>
<li>This is especially common with US and Canadian cards</li>
</ul>
<p><strong>Quick fix:</strong> Call your bank and authorize international payments to Lithuania/EU.</p>
<h2>Other Common Decline Reasons</h2>
<h3>Card-related issues</h3>
<ul>
<li><strong>Insufficient funds</strong>: Check your available balance</li>
<li><strong>Expired card</strong>: Verify the expiration date</li>
<li><strong>Daily limit reached</strong>: Some cards have transaction limits</li>
<li><strong>Incorrect details</strong>: Double-check all card information</li>
</ul>
<h3>Security blocks</h3>
<ul>
<li><strong>Fraud protection</strong>: Your bank's automated systems may flag the charge</li>
<li><strong>First-time international charge</strong>: Often triggers security alerts</li>
<li><strong>Multiple attempts</strong>: Can trigger temporary blocks</li>
</ul>
<h3>Technical issues</h3>
<ul>
<li><strong>Wrong billing address</strong>: Must match bank records exactly</li>
<li><strong>3D Secure failure</strong>: Additional verification may be required</li>
<li><strong>Card type not supported</strong>: Though we accept most major cards</li>
</ul>
<h2>How to Resolve Payment Issues</h2>
<h3>1. Check with your bank first</h3>
<p>Call the number on your card, mention "international payment to Lithuania," and ask them to whitelist the transaction.</p>
<h3>2. Try these solutions</h3>
<ul>
<li>Use a different card</li>
<li>Ensure your billing address matches your bank records exactly</li>
<li>Clear your browser cache and cookies</li>
<li>Try a different browser or device</li>
</ul>
<h3>3. Alternative payment methods</h3>
<ul>
<li>A different credit or debit card</li>
<li>A company card if available</li>
<li><a href="/help/subscription/article/is-it-possible-to-pay-by-bank-transfer">Bank transfer</a> for Enterprise plans</li>
</ul>
<h2>What Information Helps Your Bank</h2>
<p>When calling your bank, mention:</p>
<ul>
<li>"Online software subscription"</li>
<li>"Merchant in Lithuania, European Union"</li>
<li>"Processed through Stripe"</li>
<li>The exact amount being charged</li>
</ul>
<h2>Still Having Trouble?</h2>
<p>Contact our support team at <a href="mailto:support@papersurvey.io">support@papersurvey.io</a> and include the type of card (Visa, Mastercard, etc.), your country or region, any error messages shown, and what you have already tried.</p>
<p>We can provide alternative payment arrangements, a direct invoice for bank transfer, or additional verification if needed.</p>
<h2>Preventing Future Declines</h2>
<p>Once the issue is resolved, consider adding our charges to your bank's whitelist, using a card without foreign transaction restrictions, or setting up annual billing to reduce transaction frequency.</p>
<p>Payment declines are usually your bank protecting you from fraud. A quick phone call typically resolves the issue.</p>]]>
            </summary>
                                    <updated>2026-03-29T04:30:48+00:00</updated>
        </entry>
            <entry>
            <title><![CDATA[What Languages Are Supported for Handwriting Recognition?]]></title>
            <link rel="alternate" href="https://www.papersurvey.io/help/recognition/article/what-languages-are-supported-in-handwritten-text-recognition" />
            <id>https://www.papersurvey.io/81</id>
            <author>
                <name><![CDATA[PaperSurvey.io]]></name>
            </author>
            <summary type="html">
                <![CDATA[<p>Running surveys across multiple regions and languages requires a recognition engine that can handle diverse scripts and handwriting styles. PaperSurvey supports handwriting recognition in 40 languages, covering major world languages and writing systems so you can collect data from respondents worldwide.</p>
<h2>Supported languages</h2>
<h3>European languages</h3>
<ul>
<li>Croatian, Czech, Danish, Dutch, English</li>
<li>French, German, Greek, Hungarian, Italian</li>
<li>Lithuanian, Norwegian, Polish, Portuguese</li>
<li>Romanian, Russian, Spanish, Swedish, Turkish</li>
</ul>
<h3>Asian languages</h3>
<ul>
<li>Arabic, Armenian, Burmese (Myanmar), Chinese</li>
<li>Farsi (Persian), Indonesian, Japanese</li>
<li>Khmer (Cambodian), Korean, Tagalog (Filipino)</li>
<li>Thai, Tibetan, Urdu, Vietnamese</li>
</ul>
<h3>South Asian languages</h3>
<ul>
<li>Bengali, Hindi, Malayalam, Marathi, Nepali</li>
</ul>
<h3>African languages</h3>
<ul>
<li>Amharic, Swahili</li>
</ul>
<h2>Language-specific considerations</h2>
<h3>Script types supported</h3>
<ul>
<li><strong>Latin script</strong> delivers the best accuracy (English, Spanish, French, etc.)</li>
<li><strong>Cyrillic script</strong> provides high accuracy (Russian)</li>
<li><strong>Arabic script</strong> has RTL automatically enabled (Arabic, Farsi, Urdu)</li>
<li><strong>Asian scripts</strong> include complex character support (Chinese, Japanese, Korean)</li>
<li><strong>Indic scripts</strong> offer full support (Hindi, Bengali, Malayalam, Marathi)</li>
</ul>
<h3>Setting the language</h3>
<ol>
<li>Go to Survey Settings</li>
<li>Select the primary language</li>
<li>Printed instructions and web survey text use that language, while the AI recognition adapts to the handwritten script automatically</li>
<li>RTL layout is automatically applied for Arabic, Farsi, and Urdu</li>
<li>You can change the language on a per-survey basis</li>
</ol>
<h2>Accuracy considerations</h2>
<h3>High accuracy languages</h3>
<p>Languages with Latin scripts typically achieve 95%+ accuracy, including English, Spanish, French, German, Italian, Portuguese, and Dutch.</p>
<h3>Moderate accuracy languages</h3>
<p>Complex scripts may require more verification, including Arabic, Chinese, Japanese, Hindi, Thai, and Korean.</p>
<h3>Factors affecting accuracy</h3>
<ul>
<li><strong>Handwriting quality.</strong> Clear printing works best.</li>
<li><strong>Script complexity.</strong> Simpler scripts recognize better.</li>
<li><strong>Regional variations.</strong> Standard letter forms are preferred.</li>
</ul>
<h2>Common questions</h2>
<p><strong>Can I mix languages in one survey?</strong>
Yes, but set the primary language for best results.</p>
<p><strong>Which English variant is used?</strong>
The system recognizes all English variants (US, UK, Australian, etc.).</p>
<p><strong>Are accented characters supported?</strong>
Yes, all diacritical marks are recognized.</p>
<p><strong>What about regional scripts?</strong>
Major regional variants are supported within each language.</p>
<h2>Not seeing your language?</h2>
<p>If your required language is not listed, contact our support team for potential alternatives or to request addition for future updates. Our language support continues to expand based on customer needs, and the recognition technology adapts to various handwriting styles within each supported language.</p>]]>
            </summary>
                                    <updated>2026-07-18T07:29:35+00:00</updated>
        </entry>
            <entry>
            <title><![CDATA[How Do I Close My Web Survey?]]></title>
            <link rel="alternate" href="https://www.papersurvey.io/help/web-surveys/article/close-web-survey" />
            <id>https://www.papersurvey.io/82</id>
            <author>
                <name><![CDATA[PaperSurvey.io]]></name>
            </author>
            <summary type="html">
                <![CDATA[<p>You can close your survey at any time to stop accepting new responses. This is useful when you have reached your target sample size or need to begin analyzing your data without new submissions affecting your results.</p>
<h2>Closing Your Survey</h2>
<p><img src="/images/blog/settings-general.png" alt="General settings with survey status" /></p>
<p>To stop accepting responses:</p>
<ol>
<li>Navigate to your survey's settings page</li>
<li>Change the survey status from "Open" to "Closed"</li>
<li>Save your changes</li>
</ol>
<p>Once closed, your survey will no longer accept:</p>
<ul>
<li>New web form submissions</li>
<li>Paper survey uploads</li>
</ul>
<h2>What Happens When Someone Tries to Access a Closed Survey?</h2>
<p>When visitors attempt to access a closed survey, they will see a standard message indicating the survey is no longer accepting responses. PaperSurvey does not currently offer built-in custom closure messages, but there is an effective workaround.</p>
<h2>Creating a Custom Closure Message</h2>
<p>If you need to display a specific message to visitors when your survey is closed, you can set up a redirect:</p>
<ol>
<li>
<p><strong>Create a new survey</strong></p>
<ul>
<li>Create a new survey in your account</li>
<li>Add a "Description" question type</li>
<li>Write your closure message (e.g., "Thank you for your interest. This survey closed on [date]. For questions, contact [email].")</li>
</ul>
</li>
<li>
<p><strong>Save your original survey link</strong></p>
<ul>
<li>Go to your original survey's settings</li>
<li>Copy the current "Survey Link" value</li>
<li>Replace it with a random text</li>
</ul>
</li>
<li>
<p><strong>Set up the redirect</strong></p>
<ul>
<li>Enable web surveys on your <em>new survey</em></li>
<li>Paste your original survey link into the new survey's "Survey Link" field</li>
<li>Save the changes</li>
</ul>
</li>
</ol>
<p>Now when someone visits your original survey URL, they will see your custom closure message because a different survey will be opened.</p>]]>
            </summary>
                                    <updated>2026-03-29T09:58:15+00:00</updated>
        </entry>
            <entry>
            <title><![CDATA[How Do I Export Multiple Surveys as One Excel Spreadsheet?]]></title>
            <link rel="alternate" href="https://www.papersurvey.io/help/responses/article/exporting-multiple-surveys-as-one-excel-spreadsheet" />
            <id>https://www.papersurvey.io/83</id>
            <author>
                <name><![CDATA[PaperSurvey.io]]></name>
            </author>
            <summary type="html">
                <![CDATA[<p>When you need to compare results across surveys or build a unified dataset, exporting each survey separately and merging them manually can be tedious. PaperSurvey lets you combine data from multiple surveys into a single Excel file, automatically aligning responses based on matching column headers.</p>
<p>The system creates a unified spreadsheet with all responses plus a reference sheet for validating how your data was aligned.</p>
<p><img src="/images/blog/export-settings-page.png" alt="Multi-survey export tool" /></p>
<h2>How the Export Works</h2>
<h3>Data alignment</h3>
<p>PaperSurvey groups responses by matching <strong>Export Column Headers</strong> or <strong>Question Labels</strong>. For columns to merge correctly, the headers must be identical across all selected surveys. Any differences in wording will result in separate columns.</p>
<h3>Answer matching for multiple-choice questions</h3>
<p>Single-choice and multiple-choice answers match by <strong>numeric values</strong> rather than label text. This means different option labels with the same underlying values will align properly, ensuring consistent data representation.</p>
<h3>Reference sheet validation</h3>
<p>Every export includes a <strong>Reference</strong> sheet that maps option labels to their numeric values. You can use this sheet to verify alignment and adjust any recoded values if needed.</p>
<h2>Step-by-Step Instructions</h2>
<h3>1. Access the export tool</h3>
<p>Navigate to your account settings at <a href="https://www.papersurvey.io/app/settings/tools">https://www.papersurvey.io/app/settings/tools</a>, find the <strong>"Export Data For Multiple Surveys"</strong> section, and click <strong>"Export"</strong>.</p>
<h3>2. Select surveys to combine</h3>
<p>Choose all the surveys you want to include. You can also select whole folders to include every survey inside them. Make sure they share similar question structures for the best results.</p>
<h3>3. Verify data consistency</h3>
<p>Before exporting, confirm that:</p>
<ul>
<li>Column headers match exactly across surveys</li>
<li>Numeric values for multiple-choice options are consistent</li>
<li>Any questions that might not align properly have been reviewed</li>
</ul>
<h3>4. Generate the export</h3>
<p>Click <strong>"Export"</strong> to create your consolidated file. The system will process and merge all selected surveys, and the download starts automatically when complete.</p>
<h3>5. Review and adjust if needed</h3>
<p>Open the Excel file and check the Reference sheet to verify that option mappings are correct. Edit the "Recoded Values" column if adjustments are needed.</p>
<h2>Common Use Cases</h2>
<h3>Research studies</h3>
<p>Combine surveys from different time periods or locations, multiple research phases, or various participant groups into a single dataset.</p>
<h3>Customer feedback analysis</h3>
<p>Aggregate responses from multiple product launches, different customer segments, or seasonal campaigns.</p>
<h3>Educational assessments</h3>
<p>Consolidate data from multiple classes or courses, different academic terms, or various assessment types.</p>
<h2>Getting the Best Results</h2>
<ul>
<li><strong>Plan ahead</strong>: Design surveys with consistent question labels from the start</li>
<li><strong>Use standard values</strong>: Keep numeric codes consistent across surveys</li>
<li><strong>Document changes</strong>: Note any recoding in the Reference sheet</li>
<li><strong>Test first</strong>: Try exporting a small sample before working with full datasets</li>
</ul>
<h2>What to Do if Columns Don't Match</h2>
<p>If your surveys have different question labels, export them individually first, then standardize column headers in Excel before combining. Remember that exact matching is required for automatic alignment, so even small differences in wording will create separate columns.</p>
<h2>Next Steps</h2>
<p>After exporting, you can analyze the combined data in Excel or statistical software, create pivot tables for cross-survey comparisons, and generate unified reports from all responses.</p>
<p>For additional help with data analysis or export issues, contact our support team through the in-app chat.</p>]]>
            </summary>
                                    <updated>2026-07-18T08:45:27+00:00</updated>
        </entry>
            <entry>
            <title><![CDATA[How to Add Page Numbers to Your Survey]]></title>
            <link rel="alternate" href="https://www.papersurvey.io/help/form-design/article/how-to-add-page-numbers" />
            <id>https://www.papersurvey.io/84</id>
            <author>
                <name><![CDATA[PaperSurvey.io]]></name>
            </author>
            <summary type="html">
                <![CDATA[<p>For multi-page surveys, page numbers help respondents track their progress and make it easier for your team to keep printed pages in order. PaperSurvey provides shortcodes that dynamically insert page numbers into the footer area of each page.</p>
<h2>Page number shortcodes</h2>
<p><img src="/images/blog/settings-paper-survey.png" alt="Footer fields in Paper Survey settings" /></p>
<p>Add the following shortcodes in the footer area of your survey to display page numbers:</p>
<ul>
<li><code>[currentpage]</code> displays the current page number</li>
<li><code>[lastpage]</code> displays the total number of pages</li>
</ul>
<p>For example, entering <code>Page [currentpage] of [lastpage]</code> in the footer will produce text like "Page 1 of 5" on the first page, "Page 2 of 5" on the second, and so on.</p>
<h2>Displaying text on a specific page</h2>
<p>If you want certain text to appear only on a particular page, use the <code>[page=PAGE]My text[/page]</code> shortcode. Replace <code>PAGE</code> with the desired page number and <code>My text</code> with the content you want to display. This is useful for placing page-specific instructions or notes in the footer area.</p>
<p>To get started, open <strong>Survey Settings</strong> and enter your shortcodes in the <strong>Left</strong>, <strong>Center</strong>, or <strong>Right</strong> fields of the <strong>Footer</strong> section under Paper Survey. The Center field is available on plans that include branding customization, since text there replaces the footer logo. Preview your survey to confirm the page numbers render correctly before printing.</p>]]>
            </summary>
                                    <updated>2026-07-17T12:49:14+00:00</updated>
        </entry>
            <entry>
            <title><![CDATA[How to Add a Logo to Paper Surveys]]></title>
            <link rel="alternate" href="https://www.papersurvey.io/help/form-design/article/how-to-upload-logo" />
            <id>https://www.papersurvey.io/85</id>
            <author>
                <name><![CDATA[PaperSurvey.io]]></name>
            </author>
            <summary type="html">
                <![CDATA[<p>Adding your company logo gives surveys a professional, branded appearance that builds respondent trust. PaperSurvey offers two methods for placing a logo, depending on where you want it to appear and how much control you need over positioning. Both methods require an Enterprise or Enterprise Plus plan; Academic plans for universities also include them.</p>
<h2>Method 1: Footer logo (appears on every page)</h2>
<p><img src="/images/blog/settings-paper-survey.png" alt="Paper Survey settings showing logo section" /></p>
<p>This approach automatically places your logo at the center of the footer on each survey page:</p>
<ol>
<li>Open your survey in the form builder</li>
<li>Go to <strong>Survey Settings</strong></li>
<li>Find the <strong>Logo</strong> section under Paper Survey</li>
<li>Click the upload box and select your logo image (PNG, JPG, or GIF)</li>
</ol>
<p>The logo uploads immediately and will appear consistently on every page of the survey. If you have text in the <strong>Center</strong> footer field, remove it first, since the footer center holds either a logo or text, not both.</p>
<h2>Method 2: Custom logo placement</h2>
<p>For more control over logo position and size, use the Image Manager:</p>
<ol>
<li>Go to the <a href="https://www.papersurvey.io/app/images">Image Manager</a></li>
<li>Upload your logo file</li>
<li>Copy the generated shortcode (e.g., <code>[img]your-logo[/img]</code>)</li>
<li>Paste the shortcode anywhere in your survey:<ul>
<li>In the survey header for prominent branding</li>
<li>Within specific questions</li>
<li>In instruction sections</li>
</ul>
</li>
</ol>
<h3>Sizing your logo</h3>
<p>Use these shortcode options to control logo size:</p>
<ul>
<li><code>[img width=half]your-logo[/img]</code> for half page width</li>
<li><code>[img width=5 height=2]your-logo[/img]</code> for specific dimensions (in cm)</li>
<li><code>[img width=third center]your-logo[/img]</code> for a centered logo at one-third width</li>
</ul>
<p>For detailed instructions on working with images, see our guide on <a href="/help/form-design/article/how-to-add-images-in-survey-forms">adding images to survey forms</a>.</p>]]>
            </summary>
                                    <updated>2026-07-17T12:49:14+00:00</updated>
        </entry>
            <entry>
            <title><![CDATA[How to Filter Survey Responses]]></title>
            <link rel="alternate" href="https://www.papersurvey.io/help/responses/article/filtering-survey-responses" />
            <id>https://www.papersurvey.io/86</id>
            <author>
                <name><![CDATA[PaperSurvey.io]]></name>
            </author>
            <summary type="html">
                <![CDATA[<p>Finding specific responses in a large dataset can be time-consuming without the right tools. PaperSurvey provides powerful filtering options that let you narrow down responses by status, content, dates, and metadata, so you can focus on the data that matters most.</p>
<p>Whether you need to isolate incomplete submissions, review a particular batch, or identify duplicates, the filtering system gives you the control to work efficiently.</p>
<p><img src="/images/blog/responses-filter-bar.png" alt="Responses filter toolbar" /></p>
<h2>Quick Filter Options</h2>
<h3>Filter by response status</h3>
<p>The response table includes several quick filters for common scenarios:</p>
<ul>
<li><strong>No Response</strong>: Shows entries where participants did not answer specific questions</li>
<li><strong>Invalid</strong>: Displays responses marked as invalid during verification</li>
<li><strong>Duplicate answers</strong>: Finds entries with identical responses to the same question</li>
<li><strong>Hide empty</strong>: Hides blank entries created in advance for prefilled forms</li>
</ul>
<h3>Filter by metadata</h3>
<p>You can also filter responses using various metadata fields:</p>
<ul>
<li><strong>Identifier</strong>: Search by unique response ID or find duplicates</li>
<li><strong>Uploaded by</strong>: Filter by team member who uploaded the document</li>
<li><strong>Batch generated by</strong>: Filter by team member who generated the print batch</li>
<li><strong>Collection Method</strong>: Choose between Web Survey or Paper Survey responses</li>
<li><strong>Batch</strong>: Filter by specific print batch</li>
<li><strong>Tag</strong>: View responses with specific tags</li>
<li><strong>Version</strong>: Filter by survey version or language variant</li>
</ul>
<h2>Date Range Filtering</h2>
<p>PaperSurvey offers two date filtering modes to suit different needs.</p>
<h3>Uploaded date</h3>
<p>Shows responses uploaded within your selected date range. This is the default and most commonly used filter.</p>
<h3>Printed date</h3>
<p>Available only for surveys with unique page marking. Filters responses by when the print batch was generated.</p>
<p>To apply date filters, select the date mode (Uploaded or Printed), choose your date range using the calendar picker, and use preset options like "Today", "Last 7 days", or "This Month" for quick selection.</p>
<h2>Advanced Search and Filtering</h2>
<h3>Search within responses</h3>
<p>Each question column includes a search box where you can type keywords to find specific text responses, use the dropdown to select from multiple-choice options, or click special filter buttons for no response, invalid, or duplicate entries.</p>
<h3>Column-specific features</h3>
<p>For <strong>text questions</strong>, you have access to a search box for finding specific words or phrases, a "No Response" button to find unanswered questions, an "Invalid" button for verification issues, and "Duplicate answers" to identify repeated responses.</p>
<p>For <strong>multiple-choice questions</strong>, a dropdown list shows all available options. You can multi-select to view multiple options at once, choose "Any of the above" to see all answered entries, or select "Not responded" to find blank responses.</p>
<h2>Working with Filtered Results</h2>
<h3>Exporting filtered data</h3>
<p>When you apply filters, the export function respects your current view. Only filtered responses are included in exports, sort order is preserved, and all active filters are applied.</p>
<h3>Bulk actions on filtered results</h3>
<p>After filtering, you can select all visible responses for bulk operations, apply tags to filtered groups, delete specific filtered responses, or merge entries that meet your filter criteria.</p>
<h2>Combining Multiple Filters</h2>
<p>Filters work together to narrow your results. For example, you might apply a date range to focus on a time period, add a tag filter to see specific categories, filter by question responses for detailed analysis, and then search identifiers to find specific entries.</p>
<p>All active filters display at the top of the response table. Click the filter icon to modify or clear individual filters.</p>
<h2>Common Use Cases</h2>
<h3>Quality control</h3>
<p>Filter by "Invalid" responses across all questions, review and correct data entry errors, then re-verify after corrections.</p>
<h3>Duplicate detection</h3>
<p>Use "Duplicate answers" on key identifier questions, filter by duplicate identifiers, and merge or remove the duplicate entries.</p>
<h3>Incomplete response analysis</h3>
<p>Filter by "No Response" on required questions, identify patterns in missing data, and follow up with participants if needed.</p>
<h3>Batch verification</h3>
<p>Filter by a specific batch along with upload date and user to verify all responses from one upload session.</p>]]>
            </summary>
                                    <updated>2026-07-18T08:45:27+00:00</updated>
        </entry>
            <entry>
            <title><![CDATA[SAML SSO Configuration]]></title>
            <link rel="alternate" href="https://www.papersurvey.io/help/account-settings/article/saml-sso-configuration" />
            <id>https://www.papersurvey.io/87</id>
            <author>
                <name><![CDATA[PaperSurvey.io]]></name>
            </author>
            <summary type="html">
                <![CDATA[<p>Single Sign-On (SSO) allows your team members to securely access PaperSurvey using your organization's identity provider, such as Azure AD, Google Workspace, Okta, or OneLogin. By centralizing authentication, you can enforce corporate security policies while giving users a seamless login experience.</p>
<h2>Requirements</h2>
<p>To use SAML SSO, your team must meet the following requirements:</p>
<ul>
<li><strong>Enterprise Plus Plan</strong> subscription with yearly billing</li>
<li><strong>Corporate email domain</strong>: The team owner must use a verified corporate email address (free email providers like Gmail, Yahoo, Outlook, and iCloud are not supported)</li>
<li><strong>Identity Provider</strong> that supports the SAML 2.0 standard</li>
</ul>
<h2>How to configure SAML SSO</h2>
<h3>1. Access SSO settings</h3>
<p><img src="/images/blog/team-settings-full.png" alt="SSO section in team settings" /></p>
<p>Navigate to <strong>Settings &gt; My Team &gt; Single Sign-On (SSO)</strong> in your PaperSurvey account. You must be a team administrator to access these settings.</p>
<p>When you first access the SSO settings page, PaperSurvey automatically generates a unique identifier (UUID) and creates an initial SSO configuration for your team. This UUID is immediately available and used to create your Entity ID and Metadata URL.</p>
<h3>2. Get Service Provider information</h3>
<p>Before configuring your Identity Provider, copy the <strong>Metadata URL</strong> displayed in the <strong>Service Provider (SP) Information</strong> section of the SSO settings page.</p>
<p>The URL will look like: <code>https://papersurvey.io/sso/saml/abc-123-def-456/metadata</code></p>
<p><strong>Important:</strong> Copy the actual URL shown in PaperSurvey, not this example.</p>
<p>Most Identity Providers can automatically import all necessary configuration (Entity ID, ACS URL, Logout URL, etc.) from this metadata URL.</p>
<p>If your IdP requires manual entry, the individual values are also displayed in the same section:</p>
<ul>
<li>Entity ID</li>
<li>Reply URL (Assertion Consumer Service URL)</li>
<li>Sign on URL</li>
<li>Logout URL</li>
</ul>
<h3>3. Configure your Identity Provider</h3>
<p>You'll need to create a SAML application in your IdP and provide the ACS URL and Entity ID from step 2.</p>
<p><strong>Common Identity Providers:</strong></p>
<ul>
<li>Azure AD (Microsoft Entra ID)</li>
<li>Google Workspace</li>
<li>Okta</li>
<li>OneLogin</li>
<li>Auth0</li>
</ul>
<p>Refer to your IdP's documentation for specific configuration steps.</p>
<h3>4. Import Identity Provider metadata into PaperSurvey</h3>
<p>You have three options to configure your IdP:</p>
<p><strong>Option A: Metadata URL</strong> (Recommended)</p>
<ul>
<li>Enter your IdP's metadata URL</li>
<li>Click "Parse Metadata from URL"</li>
<li>PaperSurvey will automatically extract all required settings</li>
</ul>
<p><strong>Option B: Metadata XML</strong></p>
<ul>
<li>Copy your IdP's metadata XML</li>
<li>Paste it into the metadata XML field</li>
<li>Click "Parse Metadata XML"</li>
</ul>
<p><strong>Option C: Manual Entry</strong></p>
<ul>
<li>Manually enter Entity ID, SSO URL, SLO URL, and X.509 Certificate</li>
<li>This option is useful for custom configurations</li>
</ul>
<h3>5. Enable SSO features</h3>
<p>Configure the following settings based on your needs:</p>
<h4>Enforce SSO</h4>
<p>When enabled, password login will be disabled for users with your email domain. Users must authenticate via your identity provider. Passkey sign-in and password resets are also blocked for these users.</p>
<h4>Just-in-Time (JIT) Provisioning</h4>
<p><strong>Enable Automatic Account Creation</strong></p>
<ul>
<li><strong>Enabled</strong>: New users logging in via SSO will automatically get accounts created</li>
<li><strong>Disabled</strong>: Only existing users can log in via SSO. New users must be manually invited first.</li>
</ul>
<p>When JIT provisioning is enabled, you can configure:</p>
<p><strong>Default Role for New SSO Users</strong></p>
<ul>
<li><strong>Manager</strong>: Full access to manage team, surveys, and settings</li>
<li><strong>Standard User</strong>: Can create and edit surveys, view responses</li>
<li><strong>Operator</strong>: Can scan and process responses, limited editing</li>
<li><strong>Viewer (Limited Access)</strong>: Read-only access to view surveys and responses</li>
</ul>
<p>New SSO users will be automatically added to your team with the selected role.</p>
<p>You can use the "View as" links in the default role field to test each role's permissions before making your decision.</p>
<h4>Team Assignment via SAML Attributes (Optional)</h4>
<p>If you have child teams, you can automatically assign users to specific teams based on SAML attributes from your Identity Provider.</p>
<p><strong>Enable Team Assignment</strong></p>
<ul>
<li>Toggle this on to enable automatic team assignment based on SAML attributes</li>
<li>Requires JIT provisioning to be enabled</li>
</ul>
<p><strong>Configuration Steps:</strong></p>
<ol>
<li><strong>SAML Attribute Name</strong>: Specify the attribute name from your IdP (e.g., <code>department</code>, <code>groups</code>, <code>memberOf</code>)</li>
<li><strong>Attribute Value to Team Mapping</strong>: Map specific attribute values to child teams<ul>
<li>Example: Map <code>department = "Engineering"</code> to your Engineering team</li>
<li>Example: Map <code>groups = "Sales Team"</code> to your Sales team</li>
</ul>
</li>
<li><strong>Also Assign to Main Team</strong> (Optional): When enabled, users will be added to both the main team and their assigned child teams</li>
<li><strong>Fallback Team</strong> (Optional): If a user's SAML attribute doesn't match any mapping, assign them to this default team instead</li>
</ol>
<p><strong>Example Configuration:</strong></p>
<ul>
<li>SAML Attribute: <code>department</code></li>
<li>Mappings:<ul>
<li><code>Engineering</code> &gt; Engineering Team</li>
<li><code>Sales</code> &gt; Sales Team</li>
<li><code>Marketing</code> &gt; Marketing Team</li>
</ul>
</li>
<li>Fallback Team: General Team</li>
<li>Result: A user with <code>department = "Engineering"</code> will be automatically added to the Engineering Team. A user with <code>department = "HR"</code> (not mapped) will be added to the General Team.</li>
</ul>
<p><strong>Important Notes:</strong></p>
<ul>
<li>Team assignment only works if the user's SAML attribute values match your configured mappings</li>
<li>If no mappings match and no fallback team is configured, the user will only be added to the main team (if "Also Assign to Main Team" is enabled)</li>
<li>You can view and modify team assignments later in Settings &gt; My Team &gt; Users</li>
</ul>
<h2>SSO login flow</h2>
<p>Once configured, users with your email domain will:</p>
<ol>
<li>Go to PaperSurvey login page</li>
<li>Enter their email address</li>
<li>Be redirected to your identity provider</li>
<li>Authenticate with their corporate credentials</li>
<li>Be redirected back to PaperSurvey and logged in automatically</li>
</ol>
<p>If JIT provisioning is enabled and they are a new user, an account will be created automatically with the configured role.</p>
<h2>Parent and child teams</h2>
<p>If your organization has multiple teams in PaperSurvey:</p>
<ul>
<li>SSO is configured <strong>only on the main/parent team</strong></li>
<li>All child teams <strong>automatically inherit</strong> the parent team's SSO settings</li>
<li>By default, SSO users are added to the parent team with the configured default role</li>
<li>With <strong>Team Assignment via SAML Attributes</strong> enabled, users can be automatically assigned to specific child teams based on their IdP attributes</li>
<li>Users can then access all child teams based on their team membership</li>
</ul>
<h2>Testing your SSO configuration</h2>
<ol>
<li><strong>Use an Incognito/Private Window</strong> to test the fresh user experience</li>
<li><strong>Test with an Assigned User</strong> who has access in your IdP</li>
<li><strong>Verify Each Step:</strong><ul>
<li>Enter email at PaperSurvey login</li>
<li>Verify redirect to IdP</li>
<li>Authenticate at IdP</li>
<li>Verify redirect back to PaperSurvey</li>
<li>Confirm successful login</li>
</ul>
</li>
<li><strong>Test Different Scenarios:</strong><ul>
<li>New user (if JIT enabled)</li>
<li>Existing user</li>
<li>User with wrong domain (should fail correctly)</li>
</ul>
</li>
</ol>
<h2>Security best practices</h2>
<ul>
<li>Monitor certificate expiration dates and update before they expire</li>
<li>Only assign necessary users in your IdP</li>
<li>Set an appropriate default role (usually "Standard User")</li>
<li>Enable "Enforce SSO" only after thorough testing with all users</li>
<li>Review your team's audit logs regularly in <strong>Settings &gt; Audit Logs</strong></li>
<li>Ensure team owner email is verified before enabling SSO</li>
</ul>
<h2>Frequently asked questions</h2>
<p><strong>Q: Can I have multiple identity providers?</strong>
A: No, PaperSurvey supports one identity provider per team.</p>
<p><strong>Q: What happens to existing users when I enable SSO?</strong>
A: Existing users can continue using password login unless you enable "Enforce SSO". With JIT provisioning enabled, their accounts will be automatically linked to SSO on first SSO login.</p>
<p><strong>Q: Can I disable SSO after enabling it?</strong>
A: Yes, you can disable SSO anytime in the settings. Users will revert to password-based login.</p>
<p><strong>Q: What if my IdP certificate expires?</strong>
A: Users won't be able to log in until you update the certificate. Update metadata in PaperSurvey SSO settings as soon as your IdP rotates certificates.</p>
<p><strong>Q: Why can't I use Gmail or other free email providers?</strong>
A: SSO requires corporate email domains for security. Free email providers don't provide the organizational control needed for enterprise SSO.</p>
<p><strong>Q: How do I migrate all users to SSO?</strong>
A: Enable SSO with JIT provisioning first. Test with a few users. Once confirmed working, enable "Enforce SSO" to require all users to use SSO.</p>
<p><strong>Q: What happens if we reach our member limit?</strong>
A: New SSO users won't be able to log in if the member limit is reached. Contact support or upgrade your subscription to increase the limit.</p>
<p><strong>Q: Does SSO work with child teams?</strong>
A: Yes. SSO is configured on the parent team and automatically applies to all child teams. Users are added to the parent team and can access child teams based on their team membership. With Team Assignment enabled, you can also automatically assign users to specific child teams based on SAML attributes.</p>
<p><strong>Q: Can I configure different SSO settings for child teams?</strong>
A: No, SSO settings are inherited from the parent team. This ensures consistent authentication across your organization.</p>
<p><strong>Q: How does Team Assignment via SAML Attributes work?</strong>
A: When enabled, PaperSurvey reads a specified SAML attribute (like <code>department</code> or <code>groups</code>) from your IdP and automatically assigns users to matching child teams. For example, users with <code>department = "Engineering"</code> can be automatically added to your Engineering team.</p>
<p><strong>Q: What happens if a user's SAML attribute doesn't match any team mappings?</strong>
A: You have three options:</p>
<ol>
<li>Configure a <strong>fallback team</strong> to catch unmapped users</li>
<li>Enable <strong>"Also Assign to Main Team"</strong> so users are at least added to the main team</li>
<li>Leave both disabled, which will result in an error and prevent login until you add the proper mapping</li>
</ol>
<p><strong>Q: Can I test different roles before assigning them to new SSO users?</strong>
A: Yes. When configuring the default role, use the "View as" links to test each role's permissions and see exactly what new SSO users will experience.</p>
<h2>Support</h2>
<p>For assistance with SSO configuration or subscription upgrades, contact <a href="mailto:support@papersurvey.io">support@papersurvey.io</a>.</p>]]>
            </summary>
                                    <updated>2026-07-17T12:49:14+00:00</updated>
        </entry>
            <entry>
            <title><![CDATA[Changing Your Password]]></title>
            <link rel="alternate" href="https://www.papersurvey.io/help/account-settings/article/changing-your-password" />
            <id>https://www.papersurvey.io/88</id>
            <author>
                <name><![CDATA[PaperSurvey.io]]></name>
            </author>
            <summary type="html">
                <![CDATA[<p>You can change your PaperSurvey password at any time from your account settings.</p>
<h2>How to change your password</h2>
<p><img src="/images/blog/account-security-settings.png" alt="Security settings with password, passkeys, and 2FA" /></p>
<ol>
<li>Go to <strong>Settings</strong> and open the <strong>Security</strong> page</li>
<li>Find the <strong>Update Password</strong> section</li>
<li>Enter your current password</li>
<li>Enter your new password</li>
<li>Confirm the new password</li>
<li>Click <strong>Update</strong></li>
</ol>
<p>For your protection, changing your password signs you out of any other devices where you are logged in.</p>
<h2>Password requirements</h2>
<p>Choose a strong password that is:</p>
<ul>
<li>At least 8 characters long</li>
<li>Not easily guessable</li>
<li>Not reused from another service</li>
</ul>
<p>New passwords are also checked against known data breaches. If a password has appeared in a breach, it will be rejected and you will need to choose a different one. See <a href="/help/security/article/why-was-my-password-rejected">Why was my password rejected?</a> for details. A short sentence that is easy for you to remember works well.</p>
<h2>Forgot your password?</h2>
<p>If you cannot remember your current password, use the <strong>Forgot Password</strong> link on the login page. You will receive an email with a link to reset your password.</p>
<p>The reset link expires after 60 minutes, so use it promptly after receiving the email. If the link has expired, request a new one.</p>
<h2>Using passkeys instead</h2>
<p>If you prefer not to manage passwords, consider setting up a passkey for passwordless login. See <a href="/help/account-settings/article/managing-passkeys">Managing Passkeys</a> for details. If you have disabled password login in favor of passkeys, the Update Password section is hidden from the Security page.</p>]]>
            </summary>
                                    <updated>2026-07-17T12:49:14+00:00</updated>
        </entry>
            <entry>
            <title><![CDATA[Creating and Switching Teams]]></title>
            <link rel="alternate" href="https://www.papersurvey.io/help/account-settings/article/creating-and-switching-teams" />
            <id>https://www.papersurvey.io/89</id>
            <author>
                <name><![CDATA[PaperSurvey.io]]></name>
            </author>
            <summary type="html">
                <![CDATA[<p>Teams in PaperSurvey let you organize surveys, members, and data into separate workspaces. You might use different teams for different departments, clients, or projects.</p>
<h2>Creating a new team</h2>
<p><img src="/images/blog/team-settings-full.png" alt="Team settings with New Team button" /></p>
<ol>
<li>Go to <strong>Settings</strong> and open your <strong>Team</strong> page</li>
<li>Click <strong>New Team</strong></li>
<li>Enter a name for your team</li>
<li>Click <strong>Create</strong></li>
</ol>
<p>You are the owner of any team you create. The new team appears in the team selector in the top navigation, where you can switch to it. Only the team owner can create additional teams, and the number of teams you can have depends on your subscription plan.</p>
<h2>Switching between teams</h2>
<p>If you belong to multiple teams, you can switch between them:</p>
<ol>
<li>Click on your current team name in the top navigation</li>
<li>A dropdown will show all teams you belong to</li>
<li>Click the team you want to switch to</li>
</ol>
<p>Your surveys, responses, and settings are separate for each team. Switching teams changes which data you see and work with.</p>
<h2>How teams keep data separate</h2>
<p>Each team has its own:</p>
<ul>
<li>Surveys and survey responses</li>
<li>Team members and role assignments</li>
<li>Monthly usage quotas (page uploads and handwriting recognition fields)</li>
<li>Security settings (such as 2FA enforcement)</li>
<li>Integration configurations</li>
</ul>
<p>A team's plan and limits come from the team owner's subscription. Data is never shared between teams unless you explicitly export and import it.</p>
<h2>When to use multiple teams</h2>
<ul>
<li><strong>Separate organizations</strong> - If you manage surveys for different companies or clients</li>
<li><strong>Department isolation</strong> - Keep marketing surveys separate from HR surveys</li>
<li><strong>Testing</strong> - Create a test team to experiment without affecting production data</li>
</ul>
<h2>Leaving a team</h2>
<p>If you no longer need access to a team, you can leave it. Open the <strong>Team</strong> page in Settings and click <strong>Leave Team</strong> next to your own name. Team owners cannot leave a team they own.</p>]]>
            </summary>
                                    <updated>2026-07-17T12:49:14+00:00</updated>
        </entry>
            <entry>
            <title><![CDATA[Is there a maximum number of surveys I can create?]]></title>
            <link rel="alternate" href="https://www.papersurvey.io/help/account-settings/article/is-there-maximum-number-of-surveys-i-can-create-under-one-account" />
            <id>https://www.papersurvey.io/90</id>
            <author>
                <name><![CDATA[PaperSurvey.io]]></name>
            </author>
            <summary type="html">
                <![CDATA[<p>No, PaperSurvey doesn't limit the number of surveys you can create. You can design and manage unlimited surveys under a single account, regardless of your subscription plan.</p>
<h2>Other limits to consider</h2>
<p>While survey creation is unlimited, be aware of these plan-based limits:</p>
<ul>
<li><strong>Page limits</strong> - Monthly page upload quotas vary by subscription (e.g. 5,000 pages per month on the Enterprise plan)</li>
<li><strong>Field limits</strong> - Handwritten text recognition is capped by a separate monthly field quota that varies by subscription (e.g. 3,000 fields per month on the Standard plan and 9,000 fields per month on the Enterprise plan)</li>
</ul>
<p>You can track your current page and field usage in your subscription settings.</p>]]>
            </summary>
                                    <updated>2026-07-17T12:49:14+00:00</updated>
        </entry>
            <entry>
            <title><![CDATA[Managing Passkeys]]></title>
            <link rel="alternate" href="https://www.papersurvey.io/help/account-settings/article/managing-passkeys" />
            <id>https://www.papersurvey.io/91</id>
            <author>
                <name><![CDATA[PaperSurvey.io]]></name>
            </author>
            <summary type="html">
                <![CDATA[<p>Passkeys provide a secure, passwordless way to sign in to PaperSurvey. Instead of typing a password, you authenticate using your device's biometric sensor (fingerprint or face recognition), a security key, or your device PIN.</p>
<h2>What are passkeys?</h2>
<p>Passkeys are a modern authentication standard (FIDO2/WebAuthn) supported by most browsers and devices. They are more secure than passwords because they cannot be phished or reused across sites.</p>
<h2>Registering a passkey</h2>
<p><img src="/images/blog/account-security-settings.png" alt="Passkeys section in security settings" /></p>
<ol>
<li>Sign in to your PaperSurvey account with your existing password</li>
<li>Go to <strong>Settings &gt; Security</strong></li>
<li>Find the <strong>Passkeys</strong> section</li>
<li>Click <strong>Add Passkey</strong> and confirm your password</li>
<li>Give the passkey an optional name (e.g., "MacBook Pro" or "YubiKey") so you can identify it later, then click <strong>Register</strong></li>
<li>Follow your browser's prompt to register using fingerprint, face recognition, or a security key</li>
</ol>
<p>You can register multiple passkeys for different devices, and you can rename a passkey at any time from the same list.</p>
<h2>Signing in with a passkey</h2>
<ol>
<li>Go to the PaperSurvey login page</li>
<li>Under <strong>Or continue with</strong>, click <strong>Passkey</strong></li>
<li>Follow your browser's prompt to authenticate</li>
</ol>
<p>No password is needed. The entire sign-in process takes just a few seconds. Your browser may also suggest your passkey automatically when you click into the email field.</p>
<h2>Passkeys and 2FA</h2>
<p>Passkeys automatically satisfy two-factor authentication requirements. If your team enforces 2FA, registering a passkey counts as meeting that requirement without needing a separate authenticator app.</p>
<p>We recommend setting up a traditional 2FA method (authenticator app) as a backup even if you use passkeys as your primary sign-in method. This ensures you can still access your account if you lose access to all your passkey devices.</p>
<h2>Removing a passkey</h2>
<ol>
<li>Go to <strong>Settings &gt; Security</strong></li>
<li>Find the passkey you want to remove in the <strong>Passkeys</strong> section</li>
<li>Click the delete (trash) icon and confirm with your password</li>
</ol>
<p>Make sure you have at least one other sign-in method (another passkey or your password) before removing a passkey. If you have disabled password login, you cannot delete your last remaining passkey.</p>
<h2>Disabling password login</h2>
<p>Once you have at least one passkey registered, a <strong>Disable password login</strong> switch appears in the <strong>Passkeys</strong> section. Turning it on means your password can no longer be used to sign in, so only your passkeys will work. You can turn password login back on at any time from the same place.</p>
<h2>Supported devices and browsers</h2>
<p>Passkeys work on most modern devices:</p>
<ul>
<li><strong>macOS</strong> - Safari, Chrome, Firefox (Touch ID or external security key)</li>
<li><strong>Windows</strong> - Chrome, Edge (Windows Hello or external security key)</li>
<li><strong>iOS / Android</strong> - Mobile browsers with biometric authentication</li>
<li><strong>Security keys</strong> - USB or NFC keys that support FIDO2</li>
</ul>]]>
            </summary>
                                    <updated>2026-07-17T12:49:14+00:00</updated>
        </entry>
            <entry>
            <title><![CDATA[Managing Team Members and Roles]]></title>
            <link rel="alternate" href="https://www.papersurvey.io/help/account-settings/article/managing-team-members-and-roles" />
            <id>https://www.papersurvey.io/92</id>
            <author>
                <name><![CDATA[PaperSurvey.io]]></name>
            </author>
            <summary type="html">
                <![CDATA[<p>Team owners and managers can manage who has access to the team and what they can do by assigning roles.</p>
<h2>Inviting new members</h2>
<p><img src="/images/blog/team-members-list.png" alt="Team members list with roles" /></p>
<ol>
<li>Go to <strong>Team Settings</strong></li>
<li>In the <strong>Users</strong> section, click <strong>Invite User</strong></li>
<li>Select a role for them (Manager, Standard User, Operator, or Limited Access)</li>
<li>Enter the person's email address</li>
<li>Click <strong>Invite</strong></li>
</ol>
<p>The invited person will receive an email with a link to join your team. If they do not already have a PaperSurvey account, they will be prompted to create one. The number of members you can invite depends on your subscription plan, and pending invitations count toward that limit.</p>
<p>For more details, see <a href="/help/account-settings/article/inviting-users-to-your-account">Inviting Users to Your Account</a>.</p>
<h2>Changing a member's role</h2>
<ol>
<li>Go to <strong>Team Settings</strong></li>
<li>Find the member in the team list</li>
<li>Click the role dropdown next to their name</li>
<li>Select the new role</li>
</ol>
<p>Role changes take effect immediately. You cannot change your own role, and the owner's role cannot be changed. See <a href="/help/account-settings/article/understanding-user-roles-and-permissions">Understanding User Roles and Permissions</a> for a description of each role.</p>
<h2>Removing a member</h2>
<ol>
<li>Go to <strong>Team Settings</strong></li>
<li>Find the member you want to remove</li>
<li>Click <strong>Revoke access</strong></li>
<li>Confirm the removal</li>
</ol>
<p>Removed members lose access to all surveys and data in the team immediately. Their previous work (uploaded scans, verified responses) remains in the system. Members other than the owner can also leave a team themselves using the <strong>Leave Team</strong> button next to their own name.</p>
<h2>Pending invitations</h2>
<p>You can view and manage pending invitations in the <strong>Pending Invites</strong> section of Team Settings. If an invitation has not been accepted, you can cancel it at any time, and a <strong>Resend</strong> option appears one day after it was sent. Invitations expire two weeks after they are sent.</p>]]>
            </summary>
                                    <updated>2026-07-17T12:49:14+00:00</updated>
        </entry>
            <entry>
            <title><![CDATA[Setting Up Two-Factor Authentication (2FA)]]></title>
            <link rel="alternate" href="https://www.papersurvey.io/help/account-settings/article/setting-up-two-factor-authentication" />
            <id>https://www.papersurvey.io/93</id>
            <author>
                <name><![CDATA[PaperSurvey.io]]></name>
            </author>
            <summary type="html">
                <![CDATA[<p>Two-factor authentication (2FA) adds an extra layer of security to your PaperSurvey account. When enabled, you need both your password and a verification code from your phone to sign in.</p>
<h2>Enabling 2FA</h2>
<p><img src="/images/blog/account-security-settings.png" alt="Two-Factor Authentication section" /></p>
<ol>
<li>Go to <strong>Settings &gt; Security</strong></li>
<li>Find the <strong>Two Factor Authentication</strong> section</li>
<li>Click <strong>Enable</strong> and confirm your password</li>
<li>Scan the QR code with an authenticator app on your phone (such as Google Authenticator, Authy, or 1Password). If you cannot scan it, type the setup key shown below the QR code into your app instead</li>
<li>Enter the verification code displayed in the app and click <strong>Confirm</strong> to finish setup</li>
</ol>
<h2>Recovery codes</h2>
<p>After enabling 2FA, you will be shown a set of recovery codes. These are single-use codes that let you sign in if you lose access to your authenticator app.</p>
<p><strong>Store these codes securely.</strong> Save them in a password manager or print them and keep them in a safe place. Each recovery code can only be used once.</p>
<p>You can view your codes again at any time by clicking <strong>Show recovery codes</strong> on the Security page (you will be asked to confirm your password). If you run out of recovery codes, click <strong>Regenerate</strong> in the recovery codes window to create a new set.</p>
<h2>Signing in with 2FA</h2>
<p>After entering your email and password, you will be prompted for a verification code. Open your authenticator app and enter the current 6-digit code.</p>
<p>If you cannot access your authenticator app, use one of your recovery codes instead.</p>
<h2>Disabling 2FA</h2>
<ol>
<li>Go to <strong>Settings &gt; Security</strong></li>
<li>Find the <strong>Two Factor Authentication</strong> section</li>
<li>Click <strong>Disable</strong></li>
<li>Confirm with your current password</li>
</ol>
<h2>Team-enforced 2FA</h2>
<p>Team owners and managers can require all team members to enable 2FA. If your team has this setting turned on, you will be prompted to set up 2FA before you can access the account. See <a href="/help/account-settings/article/team-security-settings">Team Security Settings</a> for details.</p>
<h2>Passkeys as an alternative</h2>
<p>If you prefer passwordless login, you can set up passkeys instead. Passkeys satisfy 2FA requirements automatically. See <a href="/help/account-settings/article/managing-passkeys">Managing Passkeys</a> for more information.</p>]]>
            </summary>
                                    <updated>2026-07-17T12:49:14+00:00</updated>
        </entry>
            <entry>
            <title><![CDATA[Team Security Settings]]></title>
            <link rel="alternate" href="https://www.papersurvey.io/help/account-settings/article/team-security-settings" />
            <id>https://www.papersurvey.io/94</id>
            <author>
                <name><![CDATA[PaperSurvey.io]]></name>
            </author>
            <summary type="html">
                <![CDATA[<p>Team owners and managers can enforce security policies that apply to all members of the team. These settings help protect sensitive survey data, especially in organizations that handle personal or confidential information.</p>
<h2>Enforcing two-factor authentication</h2>
<p><img src="/images/blog/team-security-2fa.png" alt="Security settings with 2FA enforcement toggle" /></p>
<p>You can require all team members to enable 2FA before they can access surveys and data.</p>
<ol>
<li>Go to <strong>Team Settings</strong></li>
<li>Find the <strong>Security Settings</strong> section</li>
<li>Toggle <strong>Enforce 2FA</strong> to ON and click <strong>Update</strong></li>
</ol>
<p>You must have two-factor authentication enabled on your own account before you can turn this setting on.</p>
<p>When this setting is enabled:</p>
<ul>
<li>Existing members without 2FA will be prompted to set it up on their next login</li>
<li>New members must enable 2FA before they can access the team</li>
<li>Members who use passkeys automatically satisfy this requirement</li>
</ul>
<h2>What counts as 2FA</h2>
<p>The following methods satisfy the 2FA requirement:</p>
<ul>
<li><strong>Authenticator app</strong> - Google Authenticator, Authy, 1Password, or similar TOTP apps</li>
<li><strong>Passkeys</strong> - Biometric or security key authentication automatically counts as 2FA</li>
</ul>
<h2>Reviewing member compliance</h2>
<p>In Team Settings, you can see which members have 2FA enabled and which do not. Members with 2FA enabled show a green shield icon next to their name in the Users list. This helps you follow up with team members who have not yet set up their authentication.</p>
<h2>SAML Single Sign-On (SSO)</h2>
<p>For organizations that use identity providers like Okta, Azure AD, or Google Workspace, PaperSurvey supports SAML-based single sign-on. See <a href="/help/account-settings/article/saml-sso-configuration">SAML SSO Configuration</a> for setup instructions.</p>]]>
            </summary>
                                    <updated>2026-07-17T12:49:14+00:00</updated>
        </entry>
            <entry>
            <title><![CDATA[Understanding User Roles and Permissions]]></title>
            <link rel="alternate" href="https://www.papersurvey.io/help/account-settings/article/understanding-user-roles-and-permissions" />
            <id>https://www.papersurvey.io/95</id>
            <author>
                <name><![CDATA[PaperSurvey.io]]></name>
            </author>
            <summary type="html">
                <![CDATA[<p>PaperSurvey uses role-based access control to manage what each team member can do. When you invite someone to your team, you assign them a role that determines their level of access.</p>
<p><img src="/images/blog/team-members-list.png" alt="Team members with roles" /></p>
<h2>Available roles</h2>
<h3>Owner</h3>
<p>Full access to everything. Owners can manage billing, team settings, and all surveys. Each team has one owner, and only the owner can access billing.</p>
<p><strong>Can do:</strong> Everything, including managing subscription, inviting and removing members, changing team settings, and deleting surveys.</p>
<h3>Manager</h3>
<p>Similar to Owner but without billing access. Can invite and remove team members, manage all surveys and settings, and view activity logs.</p>
<p><strong>Can do:</strong> Create surveys, edit questions, upload scans, review responses, export data, create analysis views, invite and manage team members.</p>
<p><strong>Cannot do:</strong> Manage billing and subscription.</p>
<h3>Standard User</h3>
<p>Can create, edit, and manage surveys, but cannot change team or billing settings.</p>
<p><strong>Can do:</strong> Create surveys, edit questions, upload scans, review responses, export data, create analysis views.</p>
<p><strong>Cannot do:</strong> Manage team members, change billing, adjust team-level settings.</p>
<h3>Operator</h3>
<p>Can upload scans and verify responses, but cannot modify survey designs.</p>
<p><strong>Can do:</strong> Generate copies to print, upload scans, verify and review responses, export data.</p>
<p><strong>Cannot do:</strong> Create or edit surveys, manage team members, change settings. Operators can delete only the files they uploaded themselves.</p>
<h3>Limited Access</h3>
<p>Read-only access. Can see survey results but cannot make changes.</p>
<p><strong>Can do:</strong> View responses, view analysis dashboards, export data.</p>
<p><strong>Cannot do:</strong> Create or edit surveys, upload scans, verify responses, manage settings.</p>
<h2>Choosing the right role</h2>
<table>
<thead>
<tr>
<th>Role</th>
<th>Create surveys</th>
<th>Upload &amp; verify</th>
<th>View &amp; export</th>
<th>Manage team</th>
</tr>
</thead>
<tbody>
<tr>
<td>Owner</td>
<td>Yes</td>
<td>Yes</td>
<td>Yes</td>
<td>Yes</td>
</tr>
<tr>
<td>Manager</td>
<td>Yes</td>
<td>Yes</td>
<td>Yes</td>
<td>Yes (not billing)</td>
</tr>
<tr>
<td>Standard User</td>
<td>Yes</td>
<td>Yes</td>
<td>Yes</td>
<td>No</td>
</tr>
<tr>
<td>Operator</td>
<td>No</td>
<td>Yes</td>
<td>Yes</td>
<td>No</td>
</tr>
<tr>
<td>Limited Access</td>
<td>No</td>
<td>No</td>
<td>Yes</td>
<td>No</td>
</tr>
</tbody>
</table>
<p>If you are unsure which role fits, the invite dialog includes "view as" links that let you preview the application exactly as each role sees it.</p>
<h2>Changing a member's role</h2>
<p>Team owners and managers can change any other member's role at any time:</p>
<ol>
<li>Go to <strong>Team Settings</strong></li>
<li>Find the team member in the list</li>
<li>Click the role dropdown</li>
<li>Select the new role</li>
</ol>
<p>The change takes effect immediately. You cannot change your own role, and the owner's role cannot be changed.</p>
<h2>Related articles</h2>
<ul>
<li><a href="/help/account-settings/article/inviting-users-to-your-account">Inviting Users to Your Account</a> for adding new team members</li>
<li><a href="/help/account-settings/article/managing-team-members-and-roles">Managing Team Members and Roles</a> for team management</li>
</ul>]]>
            </summary>
                                    <updated>2026-07-17T12:49:14+00:00</updated>
        </entry>
            <entry>
            <title><![CDATA[Available Chart Types]]></title>
            <link rel="alternate" href="https://www.papersurvey.io/help/analysis-reports/article/available-chart-types" />
            <id>https://www.papersurvey.io/96</id>
            <author>
                <name><![CDATA[PaperSurvey.io]]></name>
            </author>
            <summary type="html">
                <![CDATA[<p>PaperSurvey analysis dashboards offer a variety of chart types to help you visualize survey results. The right chart depends on the type of question and what you want to communicate.</p>
<h2>Bar chart</h2>
<p>Displays response counts or percentages as vertical bars. Works well for comparing values across categories.</p>
<p><img src="/images/blog/chart-type-bar.png" alt="Bar chart example" /></p>
<p><strong>Best for:</strong> Single choice questions, multiple choice questions, comparing response frequencies.</p>
<h2>Horizontal bar chart</h2>
<p>Same data as a bar chart, displayed with horizontal bars. Useful when option labels are long.</p>
<p><img src="/images/blog/chart-type-horizontal-bar.png" alt="Horizontal bar chart example" /></p>
<p><strong>Best for:</strong> Questions with many options, long label text, ranked preferences.</p>
<h2>Pie chart</h2>
<p>Shows each option as a proportional slice of a circle. Most effective with a small number of options.</p>
<p><img src="/images/blog/chart-type-pie.png" alt="Pie chart example" /></p>
<p><strong>Best for:</strong> Single choice questions with 2 to 6 options, showing proportions at a glance.</p>
<h2>Donut chart</h2>
<p>A pie chart with a hollow center. It shows the same proportional data with a lighter visual style.</p>
<p><strong>Best for:</strong> Single choice questions with a small number of options, dashboards where you prefer a more modern look.</p>
<h2>Likert bar</h2>
<p>A horizontal diverging bar that splits responses around the midpoint of a scale (e.g., Strongly Disagree to Strongly Agree), with negative answers extending to the left and positive answers to the right. It appears as the Diverging option in the chart type switcher.</p>
<p><img src="/images/blog/chart-type-likert.png" alt="Likert bar chart example" /></p>
<p><strong>Best for:</strong> Agreement scales, satisfaction ratings, Likert-type questions.</p>
<h2>Stacked distribution</h2>
<p>Shows the response distribution as a horizontal bar stacked from 0 to 100%. When related questions share the same scale, their bars appear together so you can compare distributions side by side.</p>
<p><img src="/images/blog/chart-type-stacked-bar.png" alt="Stacked distribution chart example" /></p>
<p><strong>Best for:</strong> Comparing multiple related questions, showing how distributions differ across groups.</p>
<h2>Cross-tabulation</h2>
<p>A matrix that shows the relationship between two questions. Each cell displays the count or percentage of respondents who selected a particular combination of answers.</p>
<p><img src="/images/blog/chart-type-crosstab.png" alt="Cross-tabulation chart example" /></p>
<p><strong>Best for:</strong> Exploring relationships between variables, demographic breakdowns, comparing subgroups.</p>
<h2>Over-time chart</h2>
<p>Plots response data along a timeline based on when responses were submitted. Shows trends and patterns over time.</p>
<p><img src="/images/blog/chart-type-trend.png" alt="Over-time chart example" /></p>
<p><strong>Best for:</strong> Tracking changes over days, weeks, or months. Identifying response volume patterns.</p>
<h2>NPS chart</h2>
<p>Displays Net Promoter Score results with the score breakdown and overall NPS value.</p>
<p><img src="/images/blog/chart-type-nps.png" alt="NPS chart example" /></p>
<p><strong>Best for:</strong> Net Promoter Score questions, measuring customer loyalty or employee advocacy.</p>
<h2>Sentiment analysis</h2>
<p>Displays the sentiment breakdown (positive, neutral, negative) for open-ended text responses. Available when Sentiment analysis is enabled on a Short Text or Long Text question. Sentiment and topic detection runs when scanned paper responses are processed; web survey responses are not analysed.</p>
<p><img src="/images/blog/chart-type-sentiment.png" alt="Sentiment analysis chart example" /></p>
<p><strong>Best for:</strong> Understanding the overall tone of free-text feedback.</p>
<h2>Topics chart</h2>
<p>Shows the most frequently mentioned topics extracted from open-ended responses. Available when Topic analysis is enabled on a Short Text or Long Text question.</p>
<p><img src="/images/blog/chart-type-topics.png" alt="Topics chart example" /></p>
<p><strong>Best for:</strong> Identifying common themes in text feedback without reading every response.</p>
<h2>Sentiment by topic</h2>
<p>Shows the sentiment breakdown for each detected topic, making it easy to see which topics are discussed positively or negatively. Available when both Sentiment and Topic analysis are enabled on a Short Text or Long Text question.</p>
<p><img src="/images/blog/chart-type-sentiment-by-topic.png" alt="Sentiment by topic chart example" /></p>
<p><strong>Best for:</strong> Understanding which themes drive positive or negative feedback.</p>
<h2>Sentiment over time</h2>
<p>Tracks how sentiment changes over time, displayed as a stacked bar chart with positive, neutral, and negative segments.</p>
<p><img src="/images/blog/chart-type-sentiment-over-time.png" alt="Sentiment over time chart example" /></p>
<p><strong>Best for:</strong> Monitoring shifts in feedback tone across different time periods.</p>
<h2>Word cloud</h2>
<p>Visualizes the most frequent words from open-ended responses, with word size indicating frequency.</p>
<p><img src="/images/blog/chart-type-wordcloud.png" alt="Word cloud example" /></p>
<p><strong>Best for:</strong> Getting a quick visual overview of the language used in text responses.</p>
<h2>Geographic map</h2>
<p>Plots postcode or zip code data on a map, showing the geographic distribution of responses.</p>
<p><img src="/images/blog/chart-type-map.png" alt="Geographic map example" /></p>
<p><strong>Best for:</strong> Postcode and zip code questions, understanding regional response patterns.</p>
<h2>Key phrases chart</h2>
<p>Highlights the most common phrases used in text responses.</p>
<p><img src="/images/blog/chart-type-key-phrases.png" alt="Key phrases chart example" /></p>
<p><strong>Best for:</strong> Discovering specific language and terms respondents use frequently.</p>
<h2>Test and exam analysis charts</h2>
<p>When grading is enabled on a survey, additional chart types become available to analyze test and exam performance.</p>
<h3>Test results overview</h3>
<p>Shows summary statistics (average score, median, high, low, pass/fail counts) and a list of frequently missed questions. Appears automatically at the top of the Results tab for graded surveys.</p>
<h3>Score distribution</h3>
<p>A histogram showing how scores are distributed across all respondents. When a pass threshold is set, bars are colored green (pass) or red (fail).</p>
<h3>Item difficulty</h3>
<p>A horizontal bar chart showing the percentage of respondents who answered each question correctly, color-coded by difficulty zone (green for easy, yellow for moderate, red for difficult). Includes a discrimination index per question.</p>
<h3>Score over time</h3>
<p>A trend chart showing how average scores change over time, with respondent counts per period.</p>
<p>For more details, see <a href="/help/analysis-reports/article/quiz-analysis-charts">Test and Exam Analysis Charts</a>.</p>
<h2>Choosing the right chart</h2>
<table>
<thead>
<tr>
<th>Question type</th>
<th>Recommended chart</th>
</tr>
</thead>
<tbody>
<tr>
<td>Single choice</td>
<td>Bar, pie, donut, or horizontal bar</td>
</tr>
<tr>
<td>Multiple choice</td>
<td>Bar or horizontal bar</td>
</tr>
<tr>
<td>Rating scale / Likert</td>
<td>Likert bar or stacked distribution</td>
</tr>
<tr>
<td>NPS (0-10 scale)</td>
<td>NPS chart</td>
</tr>
<tr>
<td>Two questions compared</td>
<td>Cross-tabulation</td>
</tr>
<tr>
<td>Trends over time</td>
<td>Over-time chart</td>
</tr>
<tr>
<td>Open-ended text</td>
<td>Sentiment, topics, word cloud, or key phrases</td>
</tr>
<tr>
<td>Postcode / zip code</td>
<td>Geographic map or bar chart</td>
</tr>
<tr>
<td>Quiz / exam questions</td>
<td>Quiz overview, item difficulty, score distribution</td>
</tr>
</tbody>
</table>
<p>Each widget can be changed to a different chart type at any time, so feel free to experiment until you find the visualization that best communicates your findings.</p>]]>
            </summary>
                                    <updated>2026-07-17T12:49:14+00:00</updated>
        </entry>
            <entry>
            <title><![CDATA[Creating an Analysis Dashboard]]></title>
            <link rel="alternate" href="https://www.papersurvey.io/help/analysis-reports/article/creating-an-analysis-dashboard" />
            <id>https://www.papersurvey.io/97</id>
            <author>
                <name><![CDATA[PaperSurvey.io]]></name>
            </author>
            <summary type="html">
                <![CDATA[<p>Analysis dashboards let you visualize survey responses with charts, summaries, and cross-tabulations. You can build multiple dashboards per survey to focus on different aspects of your data.</p>
<p><img src="/images/blog/analysis-dashboard.png" alt="Analysis dashboard overview" /></p>
<h2>Creating a new dashboard</h2>
<p><img src="/images/blog/analysis-tabs.png" alt="Analysis tabs" /></p>
<ol>
<li>Open your survey and go to the <strong>Analysis</strong> tab</li>
<li>Click <strong>New View</strong></li>
<li>Give your dashboard a name, pick an icon, and choose whether to start blank or from a template such as Smart Report</li>
</ol>
<p>Templates prefill the view with a ready-made set of widgets based on your survey's questions. Depending on the questions in your survey, templates like All Questions, CX Dashboard, Statistical Deep-Dive, and Assessment Report are also available. Each view appears as its own tab at the top of the Analysis section, next to the built-in Results and Compare Responses tabs.</p>
<h2>Adding widgets</h2>
<p><img src="/images/blog/analysis-add-widget.png" alt="Add widget toolbar" /></p>
<p>Click <strong>Add</strong> in the dashboard toolbar to open the block library and add a visualization to your dashboard. Each widget displays data from one or more questions in your survey. You can also send any chart from the Results tab to a view by opening the chart's actions menu and choosing <strong>Save to View</strong>.</p>
<p>Available widget types include:</p>
<ul>
<li><strong>Bar chart</strong> - Compare response counts across options</li>
<li><strong>Horizontal bar chart</strong> - Same as bar chart, laid out horizontally</li>
<li><strong>Pie chart</strong> - Show proportions of each response option</li>
<li><strong>Likert bar</strong> - Visualize agreement scales and rating distributions</li>
<li><strong>Stacked distribution</strong> - Compare distributions across groups</li>
<li><strong>Cross-tabulation</strong> - Analyze relationships between two questions</li>
<li><strong>Over-time chart</strong> - Track response patterns over a date range</li>
<li><strong>Statistics widgets</strong> - Averages, NPS, CSAT, standard deviation, response plan progress, and other summary numbers</li>
<li><strong>Headings and text</strong> - Organize your dashboard into sections</li>
</ul>
<p>For a full list, see <a href="/help/analysis-reports/article/available-chart-types">Available Chart Types</a>.</p>
<h2>Configuring widgets</h2>
<p>Click <strong>Edit</strong> in the dashboard toolbar, then click a widget to open the inspector panel beside the dashboard. From there you can configure it by:</p>
<ul>
<li><strong>Selecting the question</strong> to visualize</li>
<li><strong>Choosing the chart type</strong> from the available options</li>
<li><strong>Applying filters</strong> to show only specific subsets of data (using the Filtered Chart or Comparison widgets)</li>
<li><strong>Adjusting display options</strong> such as value labels, label format, and sort order</li>
<li><strong>Changing the widget's width</strong> with the Block size control</li>
</ul>
<h2>Rearranging your dashboard</h2>
<p>In edit mode, drag widgets by their handle to reorder them on the dashboard. You can also move a selected widget with the up and down arrow keys. Build layouts that tell a clear story from your data, starting with high-level summaries and drilling down into details.</p>
<h2>Managing multiple views</h2>
<p>You can create as many analysis views as you need. This is useful when different stakeholders want to see different aspects of the data. Each view is independent and can be shared separately.</p>
<p>To switch between views, click the view's tab at the top of the Analysis section.</p>
<h2>Next steps</h2>
<ul>
<li><a href="/help/analysis-reports/article/sharing-analysis-views">Sharing Analysis Views</a> to share dashboards with others</li>
<li><a href="/help/analysis-reports/article/exporting-charts-as-powerpoint">Exporting Charts as PowerPoint</a> to download your dashboards</li>
<li><a href="/help/analysis-reports/article/filtering-data-in-analysis">Filtering Data in Analysis</a> to narrow your results</li>
</ul>]]>
            </summary>
                                    <updated>2026-08-06T14:13:09+00:00</updated>
        </entry>
            <entry>
            <title><![CDATA[Exporting Charts as PowerPoint]]></title>
            <link rel="alternate" href="https://www.papersurvey.io/help/analysis-reports/article/exporting-charts-as-powerpoint" />
            <id>https://www.papersurvey.io/98</id>
            <author>
                <name><![CDATA[PaperSurvey.io]]></name>
            </author>
            <summary type="html">
                <![CDATA[<p>You can download your analysis dashboards as PowerPoint files, making it easy to include survey results in presentations and reports.</p>
<h2>Exporting as PowerPoint (PPTX)</h2>
<p><img src="/images/blog/analysis-export-button.png" alt="Export button" /></p>
<ol>
<li>Open the analysis view you want to export</li>
<li>Click the menu button in the toolbar and select <strong>Export</strong></li>
<li>Choose whether to export the whole view or pick individual widgets to include</li>
<li>Click <strong>Export</strong> and the file will be generated and downloaded to your computer</li>
</ol>
<p>Each widget on your dashboard becomes a slide in the PowerPoint file, and number widgets such as averages, counts, and scores are combined onto a single summary slide. Charts are exported as native PowerPoint charts, so you can restyle or edit them after export. Maps and word clouds are included as images. The presentation starts with a title slide showing the view name, survey title, and any active filters.</p>
<h2>Export options</h2>
<ul>
<li><strong>Export as PDF</strong> - Download the report as a PDF file instead of a PowerPoint (.pptx) file</li>
<li><strong>Print-friendly (grayscale)</strong> - Uses distinct gray shades and adds borders and data tables, optimized for black-and-white printing</li>
</ul>
<h2>Customizing exports</h2>
<p>Before exporting, you can adjust your dashboard to control what appears in the export:</p>
<ul>
<li><strong>Add or remove widgets</strong> to include only the charts you need</li>
<li><strong>Reorder widgets</strong> by dragging them on the dashboard, as the export follows the same order</li>
<li><strong>Apply filters</strong> to narrow the data before exporting</li>
<li><strong>Rename your view</strong> to set the title that appears in the export</li>
</ul>
<p>The export captures the current state of your dashboard, including any active filters.</p>
<h2>Exporting the Results tab</h2>
<p>The Results tab has its own <strong>Export</strong> button. You can export one slide per question using the currently displayed chart types, or select multiple chart types per question to export each as a separate slide. The same PDF and print-friendly grayscale options are available.</p>]]>
            </summary>
                                    <updated>2026-07-17T12:49:14+00:00</updated>
        </entry>
            <entry>
            <title><![CDATA[Filtering Data in Analysis]]></title>
            <link rel="alternate" href="https://www.papersurvey.io/help/analysis-reports/article/filtering-data-in-analysis" />
            <id>https://www.papersurvey.io/99</id>
            <author>
                <name><![CDATA[PaperSurvey.io]]></name>
            </author>
            <summary type="html">
                <![CDATA[<p>Filters let you narrow the data displayed on your analysis dashboard to specific subsets of responses. This is useful for comparing groups, focusing on a time period, or isolating particular segments.</p>
<h2>Applying a filter</h2>
<p><img src="/images/blog/analysis-filter-bar.png" alt="Filter toolbar" /></p>
<ol>
<li>Open your analysis view</li>
<li>Click the <strong>Filter by response...</strong> dropdown in the toolbar</li>
<li>Select the question or property you want to filter by</li>
<li>Choose the values to include (e.g., only "Satisfied" and "Very Satisfied" responses)</li>
</ol>
<p>All widgets on the dashboard update immediately to reflect only the filtered responses. There is no separate apply step.</p>
<p>Besides questions, you can filter by Tag, Version, Batch, Collection Method, Identifier, and the team member who uploaded the responses or generated the print batch. For open-ended questions, you can type or pick from the most common answers.</p>
<h2>Multiple filters</h2>
<p>You can apply filters on multiple questions at the same time. Once one filter is active, an <strong>and when...</strong> dropdown appears for adding the next. When multiple filters are active, only responses that match all filter criteria are displayed.</p>
<p>For example, you could filter to show only responses from people who selected "Female" on a gender question AND "25-34" on an age question.</p>
<h2>Removing filters</h2>
<p>To remove a single filter, clear its question selection in the toolbar. To remove everything at once, click <strong>Clear filters</strong>. Removing all filters restores the full dataset.</p>
<h2>Date-based filtering</h2>
<p>Use the date range picker to focus on responses uploaded during a specific time period. Presets such as Today, Last 7 days, and Last Month make common ranges quick to select. Surveys printed with unique page marking can also switch the date filter from the upload date to the date the print batch was generated.</p>
<h2>Filters and exports</h2>
<p>Active filters carry through to exports. When you export a dashboard as PDF or PowerPoint, only the filtered data is included. This makes it easy to generate targeted reports for different audiences.</p>
<h2>Common use cases</h2>
<ul>
<li><strong>Compare demographics</strong> - Filter by age, gender, or location to see how different groups responded</li>
<li><strong>Time-based trends</strong> - Focus on a specific week or month to track changes</li>
<li><strong>Separate paper and web responses</strong> - Filter by Collection Method to view each channel on its own</li>
<li><strong>Segment by source</strong> - If using prefill data, filter by source identifiers to compare collection points</li>
</ul>]]>
            </summary>
                                    <updated>2026-07-17T12:49:14+00:00</updated>
        </entry>
            <entry>
            <title><![CDATA[Sharing Analysis Views]]></title>
            <link rel="alternate" href="https://www.papersurvey.io/help/analysis-reports/article/sharing-analysis-views" />
            <id>https://www.papersurvey.io/100</id>
            <author>
                <name><![CDATA[PaperSurvey.io]]></name>
            </author>
            <summary type="html">
                <![CDATA[<p>You can share analysis dashboards with anyone, even if they do not have a PaperSurvey account. Shared views are read-only and display only the charts you have added to the dashboard.</p>
<h2>Generating a share link</h2>
<p><img src="/images/blog/analysis-share-button.png" alt="Share menu" /></p>
<ol>
<li>Open the analysis view you want to share</li>
<li>Click the menu button and select <strong>Share</strong> from the dropdown</li>
<li>Turn on the <strong>Public sharing</strong> switch</li>
<li>Copy the generated link</li>
</ol>
<p>Anyone with the link can view the dashboard. No login is required.</p>
<h2>What is included in shared views</h2>
<p>Shared analysis views display only aggregate statistics from your dashboard, such as charts, averages, and counts. For privacy, widgets that could expose individual response data (such as response tables and open-ended response lists) are automatically excluded, even if they are part of the dashboard.</p>
<h2>Managing shared access</h2>
<p>You can disable sharing at any time by turning the <strong>Public sharing</strong> switch off. This immediately revokes access for anyone using the link. If you re-enable sharing, the same link becomes active again. To invalidate a link permanently, use the <strong>Regenerate Link</strong> button, which creates a new link and stops the old one from working.</p>
<h2>Sharing with team members</h2>
<p>Team members with access to the survey can view all analysis dashboards directly within PaperSurvey. The share link feature is primarily designed for sharing with external stakeholders who do not have an account.</p>]]>
            </summary>
                                    <updated>2026-07-17T12:49:14+00:00</updated>
        </entry>
            <entry>
            <title><![CDATA[Customizing Export Columns]]></title>
            <link rel="alternate" href="https://www.papersurvey.io/help/exporting-data/article/customizing-export-columns" />
            <id>https://www.papersurvey.io/101</id>
            <author>
                <name><![CDATA[PaperSurvey.io]]></name>
            </author>
            <summary type="html">
                <![CDATA[<p>When exporting survey data, you can control which columns are included, their order, and their names. This saves time by producing exports that are ready to use without additional editing.</p>
<h2>Enabling column customization</h2>
<p><img src="/images/blog/export-settings-page.png" alt="Export settings" /></p>
<p>To customize which columns appear in your export, you first need to enable the feature:</p>
<ol>
<li>Open your survey and go to the <strong>Responses</strong> tab</li>
<li>Click the <strong>Export</strong> button</li>
<li>Enable the <strong>Customize column order and names</strong> toggle</li>
<li>The column configuration panel will appear</li>
</ol>
<p>Column customization is available for the Excel, CSV, SPSS, SAS, and Stata file types.</p>
<h2>Selecting columns</h2>
<p>Once customization is enabled, you can choose which questions and metadata fields to include:</p>
<ol>
<li>Review the available columns and selected columns</li>
<li>Move columns between the "Available Columns" and "To be exported" lists</li>
<li>Click <strong>Download</strong></li>
</ol>
<p>Only the selected columns will appear in the downloaded file.</p>
<h2>Reordering columns</h2>
<p>With column customization enabled, drag and drop columns to change their order. The exported file will follow the order you set, so you can arrange columns to match your analysis workflow or reporting template.</p>
<h2>Renaming columns</h2>
<p>You can set custom column headers that will appear in the exported file instead of the default question titles. To rename a column, click its name in the "To be exported" list and type the new name. This is useful when:</p>
<ul>
<li>Question titles are too long for spreadsheet columns</li>
<li>You need specific column names to match an existing data model</li>
<li>You want abbreviated headers for easier data manipulation</li>
</ul>
<p>You can also set a permanent Column Header for each question via Additional Settings on the Setup page, which applies to all export formats.</p>
<h2>Saving column presets</h2>
<p>Your column configuration is saved per survey, so you do not need to reconfigure it each time you export. If you regularly export with the same settings, your preferences will be remembered.</p>
<h2>Default columns</h2>
<p>By default, exports include all questions in the survey along with standard metadata fields such as the entry ID, page count, upload date, a link to the response, notes, source filenames, print batch, and tags. Surveys with web surveys enabled also include a collection method column (paper or web), and graded quiz surveys include a total score column.</p>
<p>If any responses carry structured <code>KEY:VALUE</code> tags, such as <code>Venue:Main Hall</code> or <code>School:Lincoln High</code>, the export automatically adds one column per key (Venue, School, and so on) holding the value for each response. These columns can be reordered and renamed like any other column. See <a href="/help/responses/article/tag-survey-responses">Tag Survey Responses</a> for details and examples.</p>]]>
            </summary>
                                    <updated>2026-08-05T07:27:34+00:00</updated>
        </entry>
            <entry>
            <title><![CDATA[Exporting Data from Multiple Surveys]]></title>
            <link rel="alternate" href="https://www.papersurvey.io/help/exporting-data/article/exporting-data-from-multiple-surveys" />
            <id>https://www.papersurvey.io/102</id>
            <author>
                <name><![CDATA[PaperSurvey.io]]></name>
            </author>
            <summary type="html">
                <![CDATA[<p>If you collect responses across multiple surveys, you can export their data together into a single spreadsheet. This is useful for comparing results over time or across different groups.</p>
<h2>How to export multiple surveys</h2>
<p><img src="/images/blog/export-settings-page.png" alt="Multi-survey export" /></p>
<ol>
<li>Go to <strong>Settings</strong> and click <strong>Exports</strong> in the sidebar</li>
<li>Scroll to the <strong>Export Data For Multiple Surveys</strong> section</li>
<li>Click <strong>Export</strong></li>
<li>Select the surveys or folders you want to include</li>
<li>Choose the <strong>Cell Values</strong> format, either Actual Answer (option labels) or Recoded Values (numeric codes)</li>
<li>Click <strong>Download</strong></li>
</ol>
<p>The data will be exported as a single Excel spreadsheet. The resulting file will contain rows from all selected surveys. A column indicating the source survey is included so you can distinguish which responses came from which survey.</p>
<h2>When to use multi-survey export</h2>
<ul>
<li><strong>Pre and post surveys</strong> - Compare responses before and after an intervention</li>
<li><strong>Recurring surveys</strong> - Combine monthly or quarterly survey data for trend analysis</li>
<li><strong>Regional surveys</strong> - Merge responses from surveys distributed at different locations</li>
<li><strong>Version comparisons</strong> - Compare responses between different versions of a survey</li>
</ul>
<h2>Column alignment</h2>
<p>When exporting multiple surveys, columns are matched by each question's Column Header (set via Additional Settings on the Setup page) or, if none is set, by the question label. The names must match exactly for responses from different surveys to appear in the same column. Questions that exist in only one survey will have blank cells for entries from the other surveys.</p>
<p>For close-ended questions, answer options are matched based on their recoded numeric value. The exported file includes a Reference sheet listing each option, its numeric value, and the survey it came from, so review it to confirm the options were matched correctly. If they were not, adjust the Recoded Values for the affected questions on the Setup page and export again. A Summary sheet with combined response counts for close-ended questions is also included.</p>
<h2>Related articles</h2>
<ul>
<li><a href="/help/printing/article/pre-post-surveys">Pre and Post Surveys</a> for running before-and-after survey studies</li>
<li><a href="/help/exporting-data/article/exporting-survey-data">Exporting Survey Data</a> for single-survey export options</li>
</ul>]]>
            </summary>
                                    <updated>2026-07-17T12:49:14+00:00</updated>
        </entry>
            <entry>
            <title><![CDATA[Exporting Survey Data]]></title>
            <link rel="alternate" href="https://www.papersurvey.io/help/exporting-data/article/exporting-survey-data" />
            <id>https://www.papersurvey.io/103</id>
            <author>
                <name><![CDATA[PaperSurvey.io]]></name>
            </author>
            <summary type="html">
                <![CDATA[<p>PaperSurvey lets you export your survey responses in multiple formats for use in spreadsheet applications, statistical software, or other tools.</p>
<h2>Available export formats</h2>
<table>
<thead>
<tr>
<th>Format</th>
<th>File type</th>
<th>Best for</th>
</tr>
</thead>
<tbody>
<tr>
<td>Excel</td>
<td>.xlsx</td>
<td>General data analysis, sharing with colleagues</td>
</tr>
<tr>
<td>CSV</td>
<td>.csv</td>
<td>Importing into databases, custom tools, or any software</td>
</tr>
<tr>
<td>SPSS</td>
<td>.sav</td>
<td>Statistical analysis in SPSS or similar software</td>
</tr>
<tr>
<td>R</td>
<td>.zip (SPSS data file plus an R import script)</td>
<td>Statistical analysis in R</td>
</tr>
<tr>
<td>SAS</td>
<td>.zip (CSV data plus a SAS import script)</td>
<td>Statistical analysis in SAS</td>
</tr>
<tr>
<td>Stata</td>
<td>.zip (CSV data plus a Stata do-file)</td>
<td>Statistical analysis in Stata</td>
</tr>
<tr>
<td>Presentation</td>
<td>.pptx</td>
<td>Sharing charts and results as PowerPoint slides</td>
</tr>
</tbody>
</table>
<p>Data exports are available on paid plans.</p>
<h2>How to export</h2>
<p><img src="/images/blog/export-settings-page.png" alt="Export settings page" /></p>
<ol>
<li>Open your survey</li>
<li>Go to the <strong>Responses</strong> tab</li>
<li>Click the <strong>Export</strong> button in the top toolbar</li>
<li>Select your preferred file type</li>
<li>Click <strong>Download</strong></li>
</ol>
<p>The file will be generated and downloaded to your computer. For large surveys with many responses, the export may take a few moments to prepare. While the export is being generated, you can click <strong>Send to my email</strong> to receive the file by email instead of waiting for the download.</p>
<p>If you choose the Presentation format, you will be taken to the Results page where you can select which questions and chart types to include in the slides.</p>
<h2>Choosing cell values</h2>
<p>For the spreadsheet and statistical formats, a <strong>Cell Values</strong> setting controls how close-ended answers appear in each cell:</p>
<ul>
<li><strong>Actual Answer</strong> exports the selected option label (for example, Strongly Agree)</li>
<li><strong>Recoded Values</strong> exports the numeric code (for example, 5); you can change the codes via Recode Values for each question on the Setup page</li>
<li><strong>Text Coded Values</strong> exports short text codes, useful for database field names and GIS systems</li>
<li><strong>Quiz points</strong> shows the points earned for correctly answered questions (available for graded surveys)</li>
<li><strong>Text response Images</strong> includes images of the scanned open-ended responses; this export takes longer and is sent to your email once it is ready</li>
</ul>
<h2>What is included</h2>
<p>Each export contains:</p>
<ul>
<li>One row per survey entry</li>
<li>Columns for each question in the survey</li>
<li>Response values for each entry</li>
<li>Metadata such as submission date and entry identifier</li>
<li>One column per key when responses carry structured <code>KEY:VALUE</code> tags such as <code>Venue:Main Hall</code> (see <a href="/help/responses/article/tag-survey-responses">Tag Survey Responses</a>)</li>
</ul>
<h2>Filtered exports</h2>
<p>If you have active filters applied in the Responses tab, the export will include only the filtered entries. Remove all filters before exporting if you want the complete dataset.</p>
<h2>Scheduling regular exports</h2>
<p>For ongoing data collection, you can set up integrations to automatically send new responses to external services. See the <a href="/help/integrations">Integrations</a> section for options including Google Sheets, email notifications, and webhooks.</p>
<h2>Related articles</h2>
<ul>
<li><a href="/help/exporting-data/article/customizing-export-columns">Customizing Export Columns</a> to control which columns appear in your export</li>
<li><a href="/help/exporting-data/article/exporting-data-from-multiple-surveys">Exporting Data from Multiple Surveys</a> to combine responses across surveys</li>
</ul>]]>
            </summary>
                                    <updated>2026-08-05T07:27:34+00:00</updated>
        </entry>
            <entry>
            <title><![CDATA[Changing How Many Options to Display in a Row]]></title>
            <link rel="alternate" href="https://www.papersurvey.io/help/form-design/article/changing-number-of-options-to-display" />
            <id>https://www.papersurvey.io/104</id>
            <author>
                <name><![CDATA[PaperSurvey.io]]></name>
            </author>
            <summary type="html">
                <![CDATA[<p>By default, PaperSurvey arranges answer options vertically, one per line. You can change this to display multiple options per row, saving space on your survey form.</p>
<h2>Adjusting options per row</h2>
<p><img src="/images/blog/editor-options-per-row.png" alt="Question settings showing display options per row" /></p>
<ol>
<li>Click on the question you want to modify in the survey editor</li>
<li>Find the <strong>Display</strong> dropdown in the question settings</li>
<li>Choose how many options to show in each line, from 1 up to 15</li>
<li>Alternatively, choose <strong>Display: Inline</strong> to flow the options one after another across the page (note that help text is not shown for inline questions)</li>
</ol>
<h2>When to use multiple options per row</h2>
<p><strong>Two or three per row</strong> works well when:</p>
<ul>
<li>Options are short (e.g., "Yes", "No", "Maybe")</li>
<li>You want to save vertical space on the page</li>
<li>You have a long list of simple choices</li>
</ul>
<p><strong>One per row</strong> (the default) is better when:</p>
<ul>
<li>Options have longer text</li>
<li>You need space for checkboxes to be clearly separated</li>
<li>Respondents might confuse which checkbox belongs to which option</li>
</ul>
<h2>Impact on recognition</h2>
<p>The number of options per row does not affect recognition accuracy. PaperSurvey handles all layouts correctly. However, make sure options do not feel too crowded, as this can lead to respondents accidentally marking the wrong checkbox.</p>
<h2>Preview your changes</h2>
<p>After adjusting the layout, use the <strong>Preview</strong> button to see how the question will look when printed. This helps you verify that the options are readable and well-spaced.</p>]]>
            </summary>
                                    <updated>2026-07-17T12:49:14+00:00</updated>
        </entry>
            <entry>
            <title><![CDATA[How to Insert a QR Code]]></title>
            <link rel="alternate" href="https://www.papersurvey.io/help/form-design/article/how-to-insert-qr-code" />
            <id>https://www.papersurvey.io/105</id>
            <author>
                <name><![CDATA[PaperSurvey.io]]></name>
            </author>
            <summary type="html">
                <![CDATA[<p>PaperSurvey uses QR codes on printed surveys to identify pages and link them to the correct survey. These QR codes are added automatically and should not be removed.</p>
<h2>Automatic QR codes</h2>
<p>Every printed survey includes at least one QR code at the bottom-right corner of each page. This QR code contains information that PaperSurvey uses to:</p>
<ul>
<li>Identify which survey the page belongs to</li>
<li>Match the page to the correct entry</li>
<li>Link multi-page surveys together</li>
</ul>
<p>If you have <strong>Unique page marking</strong> enabled, a second QR code appears at the bottom-left corner of each page to uniquely identify individual copies.</p>
<h2>Linking to your web survey</h2>
<p>If web surveys are enabled, you do not need an external generator to point respondents to the online version. Type the <code>[websurvey_qrcode]</code> shortcode into any text on your survey, such as a heading, description block, or footer, and PaperSurvey prints a QR code that links to your web survey (or your custom domain, if one is configured). The code is 15 mm tall by default; add a height parameter to resize it, for example <code>[websurvey_qrcode height=20mm]</code>. The <code>[link]</code> shortcode prints the web survey address as text instead.</p>
<h2>Adding your own QR codes</h2>
<p>If you want to add a QR code that links to another website or resource, you can:</p>
<ol>
<li>Generate a QR code using any free QR code generator online</li>
<li>Save it as an image (PNG or JPEG)</li>
<li>Upload it in the <strong>Image Manager</strong> and place it in your survey using the generated <code>[img]</code> shortcode</li>
</ol>
<p>Place your custom QR code in a heading or description block. Make sure it does not overlap with the automatic PaperSurvey QR codes at the bottom of the page. The Image Manager is available on plans that include image uploads.</p>
<h2>Important notes</h2>
<ul>
<li><strong>Do not remove</strong> the automatic QR codes. They are required for survey processing.</li>
<li><strong>Do not cover</strong> the corner markers on the page. PaperSurvey uses these for alignment.</li>
<li>Custom QR codes are treated as images and are not processed by PaperSurvey's recognition engine.</li>
</ul>]]>
            </summary>
                                    <updated>2026-07-17T12:49:14+00:00</updated>
        </entry>
            <entry>
            <title><![CDATA[Importing Questions from Another Survey]]></title>
            <link rel="alternate" href="https://www.papersurvey.io/help/form-design/article/importing-questions-from-another-survey" />
            <id>https://www.papersurvey.io/106</id>
            <author>
                <name><![CDATA[PaperSurvey.io]]></name>
            </author>
            <summary type="html">
                <![CDATA[<p>PaperSurvey offers two ways to bring questions into a survey: adding questions from another existing survey, or importing from external files.</p>
<h2>Adding questions from another survey</h2>
<p><img src="/images/blog/editor-import-questions.png" alt="Add from Survey button in editor sidebar" /></p>
<ol>
<li>Open the survey where you want to add questions</li>
<li>In the survey editor sidebar, click <strong>Add from Survey</strong></li>
<li>Select the source survey from the list of your existing surveys</li>
<li>Tick the questions you want to add, or use <strong>Select All</strong></li>
<li>Click <strong>Import</strong></li>
</ol>
<p>The selected questions will be added to your current survey. You can then rearrange, edit, or modify them as needed.</p>
<h2>Importing from external files</h2>
<p>You can also set up a survey from an existing questionnaire. PaperSurvey uses AI to parse the content and extract questions automatically.</p>
<ol>
<li>Open the editor of a survey that has no questions yet</li>
<li>Click <strong>Setup from Text, Word or PDF</strong></li>
<li>Upload a PDF, Word (DOCX), or plain text file up to 10MB, or paste your questions as text</li>
<li>Click <strong>Import</strong>, then review the extracted questions, as some manual adjustments are typically needed</li>
</ol>
<p>You can add extra sources in other languages in the same dialog to fill in translations for a multi-language survey. File imports are limited to 15 per day (3 per day during the trial).</p>
<h2>What gets imported</h2>
<p>When you add questions, the following are copied:</p>
<ul>
<li>Question text and type</li>
<li>Answer options and labels</li>
<li>Question settings (such as required, help text, and layout options)</li>
</ul>
<p>Responses from the source survey are <strong>not</strong> imported. Only the question structure is copied.</p>
<h2>Duplicating an entire survey</h2>
<p>If you want to reuse all questions from a survey, it may be faster to duplicate the entire survey instead of importing individual questions. See <a href="/help/form-design/article/survey-duplication">Survey Duplication</a> for details.</p>
<h2>Using templates</h2>
<p>PaperSurvey also offers pre-built survey templates that you can use as a starting point. Templates cover common use cases like customer satisfaction, employee feedback, and event evaluations.</p>]]>
            </summary>
                                    <updated>2026-07-17T12:49:14+00:00</updated>
        </entry>
            <entry>
            <title><![CDATA[Setting Up Grading and Answer Keys]]></title>
            <link rel="alternate" href="https://www.papersurvey.io/help/form-design/article/setting-up-grading-and-answer-keys" />
            <id>https://www.papersurvey.io/107</id>
            <author>
                <name><![CDATA[PaperSurvey.io]]></name>
            </author>
            <summary type="html">
                <![CDATA[<p>PaperSurvey can automatically grade responses by comparing them against an answer key you define. This is useful for quizzes, tests, assessments, and any survey where there are correct answers.</p>
<h2>Setting up an answer key</h2>
<p><img src="/images/blog/settings-grading.png" alt="Grading settings in survey configuration" /></p>
<ol>
<li>Open <strong>Survey Settings</strong> and turn on <strong>Activate test grading</strong> in the Grading section</li>
<li>Back in the editor, click the tools icon next to the question you want to grade and choose <strong>Answer Key</strong></li>
<li>Tick the correct option(s) and set how many points a correct answer is worth (1 point by default)</li>
<li>Optionally, select specific incorrect options and set negative points to deduct for choosing them</li>
<li>Repeat for all graded questions</li>
</ol>
<p>In the Grading section of Survey Settings you can also set an optional <strong>Pass threshold</strong> percentage. When set, a Pass/Fail status is shown in results, in exports, and to respondents after they submit a web survey.</p>
<h2>How grading works</h2>
<p>When responses are processed (either from scanned paper or web submissions), PaperSurvey compares each response against your answer key and calculates a score.</p>
<ul>
<li>Each correctly answered question earns the points you assigned to it (1 by default)</li>
<li>Incorrect answers can optionally deduct points if you configured deductions</li>
<li>The total score is calculated automatically</li>
<li>Results are available in the responses tab and in exports</li>
<li>If you update an answer key later, scores for all existing responses are recalculated</li>
</ul>
<h2>Supported question types</h2>
<p>Grading works with:</p>
<ul>
<li><strong>Single choice</strong> - One correct option</li>
<li><strong>Multiple choice</strong> - One or more correct options</li>
<li><strong>Grid questions</strong> - Each row of a single or multiple choice grid has its own answer key</li>
</ul>
<p>Text-based questions (short text, long text) and number fields are not auto-graded, as they require subjective evaluation or manual review.</p>
<h2>Viewing grades</h2>
<p>After processing, you can see grades in several places:</p>
<ul>
<li><strong>Responses tab</strong> - Each entry shows its score</li>
<li><strong>Exports</strong> - Score columns are included in Excel, CSV, and SPSS exports</li>
<li><strong>Analysis</strong> - Create charts to visualize score distributions</li>
</ul>
<h2>Use cases</h2>
<ul>
<li><strong>Classroom tests</strong> - Print and distribute exams, scan responses, and get instant grades</li>
<li><strong>Training assessments</strong> - Evaluate employee knowledge before and after training</li>
<li><strong>Certification exams</strong> - Score standardized assessments at scale</li>
<li><strong>Quizzes and competitions</strong> - Grade quiz answers automatically</li>
</ul>]]>
            </summary>
                                    <updated>2026-07-17T12:49:14+00:00</updated>
        </entry>
            <entry>
            <title><![CDATA[Using Emojis in Paper Surveys]]></title>
            <link rel="alternate" href="https://www.papersurvey.io/help/form-design/article/using-emoji-in-paper-survey" />
            <id>https://www.papersurvey.io/108</id>
            <author>
                <name><![CDATA[PaperSurvey.io]]></name>
            </author>
            <summary type="html">
                <![CDATA[<p>Emojis are not supported in PaperSurvey. The PDF rendering engine does not include emoji fonts, so emoji characters will not appear correctly when printed.</p>
<h2>Built-in face icons</h2>
<p>For smiley-face rating scales, PaperSurvey has built-in face icons that print correctly. Type <code>[smile]</code>, <code>[neutral]</code>, or <code>[sad]</code> into any question text or option label, or insert them from the formatting toolbar's more options menu. On the printed paper survey they render as drawn face icons, and on the web survey they appear as the matching emoji.</p>
<p>On paper surveys you can also use a graded five-step scale, from <code>[smile=1]</code> (most negative) through <code>[smile=5]</code> (most positive), which is useful for labeling the points of a rating scale.</p>
<h2>Other symbols</h2>
<p>For any other emoji or icon, save it as an image file and upload it into your survey using the <a href="/help/form-design/article/how-to-add-images-in-survey-forms">image feature</a>. This gives you full control over how it appears in print and works reliably across all printers.</p>]]>
            </summary>
                                    <updated>2026-07-18T07:29:35+00:00</updated>
        </entry>
            <entry>
            <title><![CDATA[Using Folders to Organize Surveys]]></title>
            <link rel="alternate" href="https://www.papersurvey.io/help/form-design/article/using-folders-to-organize-surveys" />
            <id>https://www.papersurvey.io/109</id>
            <author>
                <name><![CDATA[PaperSurvey.io]]></name>
            </author>
            <summary type="html">
                <![CDATA[<p>As you create more surveys, folders help you keep everything organized. You can group surveys by project, department, date, or any system that works for you.</p>
<h2>Creating a folder</h2>
<ol>
<li>Go to your survey dashboard</li>
<li>Click <strong>New Folder</strong></li>
<li>Enter a name for the folder</li>
<li>Click <strong>Save</strong></li>
</ol>
<p>The folder will appear on your dashboard alongside your surveys. Folders can be nested: open a folder and click <strong>New Folder</strong> again to create a subfolder inside it. A breadcrumb trail at the top of the folder shows where you are.</p>
<h2>Moving surveys into folders</h2>
<p>To move one or more surveys into a folder:</p>
<ol>
<li>Select the survey(s) on your dashboard using the checkboxes</li>
<li>Click <strong>Bulk actions</strong> and choose <strong>Move to folder</strong></li>
<li>Choose the target folder</li>
</ol>
<p>You can also change a single survey's folder from its <strong>Survey Settings</strong> page, using the <strong>Folder</strong> field in the General section. Surveys can be moved between folders at any time.</p>
<h2>Renaming a folder</h2>
<p>Open the folder and click the settings icon next to its name in the breadcrumb, then enter the new name. Renaming a folder does not affect the surveys inside it.</p>
<h2>Archiving surveys</h2>
<p>For completed projects, move finished surveys into an "Archive" folder to reduce clutter on your main dashboard. Archived surveys remain fully accessible. You can view responses, export data, and reactivate them at any time.</p>
<h2>Deleting a folder</h2>
<p>Open the folder and click the delete icon next to its name in the breadcrumb. Deleting a folder does not delete the surveys inside it. The surveys are moved back to the root level of your dashboard.</p>]]>
            </summary>
                                    <updated>2026-07-18T07:29:35+00:00</updated>
        </entry>
            <entry>
            <title><![CDATA[Quick Start Guide]]></title>
            <link rel="alternate" href="https://www.papersurvey.io/help/getting-started/article/quick-start-guide" />
            <id>https://www.papersurvey.io/110</id>
            <author>
                <name><![CDATA[PaperSurvey.io]]></name>
            </author>
            <summary type="html">
                <![CDATA[<p>Welcome to PaperSurvey. This guide walks you through the basics so you can create a survey, collect responses, and view your results.</p>
<h2>1. Create your survey</h2>
<p>From the dashboard, click <strong>Create Survey</strong> and give it a name. You will be taken to the survey editor where you can start adding questions.</p>
<p><img src="/images/blog/editor-question-panel.png" alt="Survey editor with questions" /></p>
<p>PaperSurvey supports many question types including single choice, multiple choice, grids, text fields, numbers, and more. Reorder questions with the move arrows next to each question, and use headings and dividers to organize sections.</p>
<p>For a full list of available question types, see <a href="/help/form-design/article/question-types-and-examples">Question Types Available in PaperSurvey</a>.</p>
<h2>2. Choose your collection method</h2>
<p>PaperSurvey supports two ways to collect responses:</p>
<p><strong>Paper surveys</strong> - Print your survey, distribute it to respondents, then scan or photograph the completed forms. PaperSurvey reads the responses automatically using OCR.</p>
<p><strong>Web surveys</strong> - Enable web surveys in your survey settings to generate a shareable link. Respondents complete the survey online from any device.</p>
<p>You can use both methods at the same time. Paper and web responses are combined into a single dataset.</p>
<h2>3. Collect responses</h2>
<p><strong>For paper surveys:</strong></p>
<ol>
<li>Go to the <strong>Print</strong> tab, create a version, and download your survey as a PDF</li>
<li>Print the PDF and distribute to respondents</li>
<li>Collect completed surveys and scan them (or take photos)</li>
<li>Upload the scans to PaperSurvey from the <strong>Upload</strong> tab</li>
</ol>
<p><strong>For web surveys:</strong></p>
<ol>
<li>Open your survey settings and enable the <strong>Activate</strong> toggle in the Web Surveys section</li>
<li>Copy the survey link and share it with respondents</li>
<li>Responses are collected automatically as people submit the form</li>
</ol>
<h2>4. Review your data</h2>
<p>After uploading scanned surveys, PaperSurvey processes them automatically. You may be asked to verify certain responses where handwriting was unclear. These appear in the <strong>Verify</strong> tab of your survey.</p>
<p><img src="/images/blog/responses-overview.png" alt="Responses tab" /></p>
<p>All responses (paper and web) appear in the <strong>Responses</strong> tab, where you can:</p>
<ul>
<li>Browse individual entries</li>
<li>Filter and search responses</li>
<li>Tag entries for organization</li>
<li>Export data to Excel, CSV, or SPSS</li>
</ul>
<h2>5. Analyze your results</h2>
<p>Go to <strong>Analysis</strong> to create dashboards with charts, cross-tabulations, and summaries. You can share these dashboards with colleagues or export them as PDF or PowerPoint presentations.</p>
<h2>Next steps</h2>
<ul>
<li><a href="/help/getting-started/article/your-first-paper-survey">Your First Paper Survey</a> for a detailed paper survey walkthrough</li>
<li><a href="/help/getting-started/article/your-first-web-survey">Your First Web Survey</a> for a web-only walkthrough</li>
<li><a href="/help/form-design/article/question-types-and-examples">Question Types</a> to explore all available question formats</li>
</ul>]]>
            </summary>
                                    <updated>2026-07-17T12:49:14+00:00</updated>
        </entry>
            <entry>
            <title><![CDATA[Your First Paper Survey]]></title>
            <link rel="alternate" href="https://www.papersurvey.io/help/getting-started/article/your-first-paper-survey" />
            <id>https://www.papersurvey.io/111</id>
            <author>
                <name><![CDATA[PaperSurvey.io]]></name>
            </author>
            <summary type="html">
                <![CDATA[<p>This guide walks you through the complete process of creating a paper survey, printing it, collecting responses, and viewing your results.</p>
<h2>Step 1: Design your survey</h2>
<ol>
<li>Click <strong>Create Survey</strong> on your dashboard</li>
<li>Enter a name for your survey</li>
<li>Add questions in the editor using the <strong>Add new question</strong> button, or the plus button that appears between questions, then pick a type for each question from its dropdown</li>
</ol>
<p>Start simple. A good first survey might include:</p>
<ul>
<li>A <strong>single choice</strong> question (e.g., "How satisfied are you?")</li>
<li>A <strong>multiple choice</strong> question (e.g., "Which features do you use?")</li>
<li>A <strong>short text</strong> question (e.g., "Any additional comments?")</li>
</ul>
<p>You can preview your survey at any time by clicking <strong>Preview</strong> in the top toolbar.</p>
<h2>Step 2: Print your survey</h2>
<p><img src="/images/blog/print-download-pdf.png" alt="Print tab with version and download" /></p>
<ol>
<li>Go to the <strong>Print</strong> tab in the survey editor</li>
<li>Click <strong>Create a version for printing</strong></li>
<li>Once the version is generated, click <strong>Print</strong> next to it, then <strong>Download</strong> in the dialog that opens (you can also have the PDF sent to your email)</li>
<li>Print the PDF on standard A4 or Letter paper</li>
</ol>
<p>For best results:</p>
<ul>
<li>Print in black and white (color is optional)</li>
<li>Use standard white paper</li>
<li>Do not scale or resize the PDF when printing</li>
<li>Make sure the four corner markers are clearly visible</li>
</ul>
<p>See <a href="/help/printing/article/do-i-need-to-print-surveys-in-color">Do I Need to Print Surveys in Color?</a> for more details.</p>
<h2>Step 3: Distribute and collect</h2>
<p>Hand out printed surveys to your respondents. They can fill in the survey using a pen. Once completed, collect all the forms.</p>
<h2>Step 4: Scan your surveys</h2>
<p>Scan the completed surveys using a flatbed scanner, document scanner, or even a smartphone camera. Save the scans as PDF, JPEG, PNG, HEIF, or TIFF files.</p>
<p>For scanning recommendations, see <a href="/help/scanning/article/recommended-settings-for-scanner">Recommended Scanner Settings</a>.</p>
<h2>Step 5: Upload to PaperSurvey</h2>
<p><img src="/images/blog/upload-drag-drop.png" alt="Upload tab with drag and drop area" /></p>
<ol>
<li>Open your survey and go to the <strong>Upload</strong> tab</li>
<li>Drag and drop your scanned files, or click to browse</li>
<li>PaperSurvey will begin processing your uploads automatically</li>
</ol>
<p>Processing typically takes a few seconds per page. You will see a progress indicator as pages are read.</p>
<h2>Step 6: Verify responses</h2>
<p>After processing, PaperSurvey may flag some fields for verification. This happens when handwriting is unclear or a mark is ambiguous.</p>
<ol>
<li>Go to the <strong>Verify</strong> tab (a counter on the tab shows how many fields need attention)</li>
<li>Compare each detected answer with its scanned image snippet</li>
<li>Confirm or correct each flagged field</li>
</ol>
<p>You can also open the <strong>Review</strong> tab to look through complete responses alongside the scanned pages.</p>
<h2>Step 7: View and export your data</h2>
<p>Once verification is complete, your data is ready. You can:</p>
<ul>
<li><strong>Browse responses</strong> in the Responses tab</li>
<li><strong>Create charts</strong> in the Analysis tab</li>
<li><strong>Export data</strong> as Excel, CSV, or SPSS files using the <strong>Export</strong> option in the Responses tab</li>
</ul>
<p>Congratulations, you have completed your first paper survey from start to finish.</p>]]>
            </summary>
                                    <updated>2026-07-17T12:49:14+00:00</updated>
        </entry>
            <entry>
            <title><![CDATA[Your First Web Survey]]></title>
            <link rel="alternate" href="https://www.papersurvey.io/help/getting-started/article/your-first-web-survey" />
            <id>https://www.papersurvey.io/112</id>
            <author>
                <name><![CDATA[PaperSurvey.io]]></name>
            </author>
            <summary type="html">
                <![CDATA[<p>PaperSurvey is not just for paper forms. You can also collect responses online through web surveys. This guide walks you through creating and sharing your first web survey.</p>
<h2>Step 1: Design your survey</h2>
<ol>
<li>Click <strong>Create Survey</strong> on your dashboard</li>
<li>Enter a name for your survey</li>
<li>Add questions using the editor</li>
</ol>
<p>All question types work in both paper and web formats, so you can design your survey once and use it for either collection method.</p>
<h2>Step 2: Enable web surveys</h2>
<p><img src="/images/blog/settings-web-surveys.png" alt="Web Surveys settings" /></p>
<ol>
<li>Open the <strong>Settings</strong> tab in your survey</li>
<li>Find the <strong>Web Surveys</strong> section and enable the <strong>Activate</strong> toggle</li>
<li>Save your changes</li>
</ol>
<p>If the Activate toggle is disabled, verify your email address first. Web surveys require a verified account email.</p>
<p>A unique survey link will be generated automatically (e.g., <code>papersurvey.io/s/abc123</code>).</p>
<h2>Step 3: Customize your web survey (optional)</h2>
<p>Before sharing, you may want to adjust a few settings:</p>
<ul>
<li><strong>Survey link</strong> - Change the survey link ending to something memorable (e.g., <code>customer-feedback-2026</code>)</li>
<li><strong>Appearance</strong> - Show or hide the header and adjust the branding and header colors to match your organization</li>
<li><strong>Completion Message</strong> - Customize the message shown after submission</li>
<li><strong>Save progress to browser</strong> - If a respondent closes the page without submitting, their answers are preserved when they return on the same device</li>
</ul>
<p>To add introductory text before the first question, place a Heading or Description block at the top of your survey in the editor.</p>
<p>For a full guide on these options, see <a href="/help/web-surveys/article/how-to-create-web-survey">How to Create a Web Survey</a>.</p>
<h2>Step 4: Share your survey</h2>
<p>Copy the survey link and share it with respondents through:</p>
<ul>
<li><strong>Email</strong> - Paste the link into an email invitation</li>
<li><strong>Social media</strong> - Post the link on your channels</li>
<li><strong>QR code</strong> - Use the QR link shown in the Web Surveys settings to share a scannable code on printed materials</li>
<li><strong>Website embed</strong> - Embed the survey directly on a webpage</li>
</ul>
<h2>Step 5: Monitor responses</h2>
<p>As respondents submit the survey, their responses appear in real time in the <strong>Responses</strong> tab. There is no scanning or verification step needed for web responses, so data is available immediately.</p>
<h2>Step 6: Close the survey (optional)</h2>
<p>When you have collected enough responses, you can close the survey to stop accepting new submissions. Go to survey settings and change the survey status to <strong>Closed</strong>.</p>
<p>See <a href="/help/web-surveys/article/close-web-survey">How to Close a Web Survey</a> for more options.</p>
<h2>Step 7: Analyze and export</h2>
<p>View your results in the <strong>Analysis</strong> tab, or export the data from the <strong>Export</strong> menu. Web survey responses are stored in the same format as paper responses, so you can combine both collection methods seamlessly.</p>]]>
            </summary>
                                    <updated>2026-07-17T12:49:14+00:00</updated>
        </entry>
            <entry>
            <title><![CDATA[How to Use Webhooks]]></title>
            <link rel="alternate" href="https://www.papersurvey.io/help/integrations/article/how-to-use-webhooks" />
            <id>https://www.papersurvey.io/113</id>
            <author>
                <name><![CDATA[PaperSurvey.io]]></name>
            </author>
            <summary type="html">
                <![CDATA[<p>Webhooks let you receive automatic notifications whenever a new survey response is submitted. PaperSurvey sends an HTTP POST request to a URL you specify, containing the response data. This lets you connect PaperSurvey to your own systems without polling the API.</p>
<h2>Setting up a webhook</h2>
<p><img src="/images/blog/settings-developer-api.png" alt="Developer settings with webhooks" /></p>
<ol>
<li>Go to your <a href="/app/settings/developer">Developer Settings</a></li>
<li>Scroll to the <strong>Webhooks</strong> section</li>
<li>Click <strong>Add New Webhook</strong></li>
<li>Enter the URL where you want to receive notifications, and optionally select a specific survey. If you leave the survey field empty, the webhook fires for every survey on your team.</li>
<li>Click <strong>Add</strong></li>
</ol>
<p>PaperSurvey will send a POST request to this URL each time a new response is submitted, processed, or updated. To avoid overwhelming your server, deliveries are throttled per response: at most one webhook is sent every 3 minutes for the same response. If several changes happen to one response within that window, the next webhook includes all of them.</p>
<h2>What data is sent</h2>
<p>Each webhook request includes a JSON payload with:</p>
<ul>
<li>The survey identifier</li>
<li>The entry data (responses to each question)</li>
<li>Metadata such as submission timestamp and entry type (paper or web)</li>
</ul>
<h2>Testing your webhook</h2>
<p>After setting up a webhook, submit a test response to your survey (either via the web form or by uploading a scan). Check your receiving endpoint to confirm the data arrived correctly.</p>
<p>The actions menu next to each webhook also helps during development: <strong>Test</strong> sends your most recent entry to the URL, <strong>Sample body</strong> shows the exact JSON payload your webhook will receive, and <strong>View log</strong> shows the delivery history with status codes and response times. If you collected data before setting up the webhook, the <strong>Sync</strong> action sends all historical entries to the URL.</p>
<p>You can use services like <a href="https://webhook.site">webhook.site</a> to inspect incoming webhook payloads during development.</p>
<h2>Retry behavior</h2>
<p>If your endpoint is unreachable or returns an error (non-2xx status code), PaperSurvey will retry the webhook delivery with increasing delays, up to a maximum of 10 attempts. If your endpoint repeatedly responds with 404 or 403, the webhook is deactivated automatically; once your endpoint is fixed, you can reactivate it from the webhooks list. If you want to stop receiving events entirely, respond with a 410 status code and the webhook will be deleted.</p>
<h2>Security considerations</h2>
<ul>
<li>Use HTTPS endpoints to protect data in transit</li>
<li>Verify the signature to ensure requests come from PaperSurvey. Every delivery includes an <code>X-PaperSurvey-Signature</code> header (<code>sha256=</code> followed by an HMAC-SHA256 digest) and an <code>X-PaperSurvey-Timestamp</code> header. Compute an HMAC-SHA256 over the string <code>{timestamp}.{raw request body}</code> using your webhook's signing secret and compare it to the signature. Each webhook has its own signing secret, which you can view or rotate via the <strong>Signing</strong> action in the webhooks list.</li>
<li>Avoid exposing sensitive internal systems directly; use a middleware or API gateway if needed</li>
</ul>
<h2>Common use cases</h2>
<ul>
<li><strong>CRM updates</strong> - Automatically create or update records when a survey is completed</li>
<li><strong>Email alerts</strong> - Trigger email notifications to specific people based on response content</li>
<li><strong>Database sync</strong> - Write survey responses directly to your internal database</li>
<li><strong>Dashboard updates</strong> - Push new data to a real-time reporting dashboard</li>
</ul>
<h2>Related articles</h2>
<ul>
<li><a href="/help/integrations/article/does-papersurvey-offer-api">Does PaperSurvey Offer an API?</a> for direct API access</li>
<li><a href="/help/integrations/article/papersurvey-zapier-integration">Zapier Integration</a> for no-code automation</li>
</ul>]]>
            </summary>
                                    <updated>2026-07-18T07:29:35+00:00</updated>
        </entry>
            <entry>
            <title><![CDATA[PaperSurvey Zapier Integration]]></title>
            <link rel="alternate" href="https://www.papersurvey.io/help/integrations/article/papersurvey-zapier-integration" />
            <id>https://www.papersurvey.io/114</id>
            <author>
                <name><![CDATA[PaperSurvey.io]]></name>
            </author>
            <summary type="html">
                <![CDATA[<p>Zapier lets you connect PaperSurvey to thousands of other applications without writing any code. When a new survey response is submitted, Zapier can automatically trigger actions in other apps you use.</p>
<h2>How it works</h2>
<p>Zapier uses "Zaps" to connect two or more apps. A Zap has a trigger (something that starts the workflow) and one or more actions (things that happen as a result).</p>
<p>With PaperSurvey as the trigger, you can set up Zaps like:</p>
<ul>
<li>New response in PaperSurvey → Add row to Google Sheets</li>
<li>New response in PaperSurvey → Send Slack notification</li>
<li>New response in PaperSurvey → Create record in Airtable</li>
<li>New response in PaperSurvey → Send email via Gmail</li>
</ul>
<h2>Setting up the Zapier integration</h2>
<ol>
<li>Sign in to your <a href="https://zapier.com">Zapier</a> account (create one if you do not have one)</li>
<li>Click <strong>Create Zap</strong></li>
<li>Search for <strong>PaperSurvey</strong> as the trigger app</li>
<li>Select the trigger event (e.g., "New Response")</li>
<li>Connect your PaperSurvey account when prompted</li>
<li>Select the survey you want to monitor</li>
<li>Choose your action app and configure what should happen</li>
<li>Test the Zap and turn it on</li>
</ol>
<h2>Available triggers</h2>
<ul>
<li><strong>New Response</strong> - Fires when a new survey response is submitted (web) or processed (paper)</li>
</ul>
<p>To conserve your Zap tasks, events are throttled per response: at most one event is sent every 3 minutes for the same response, and multiple quick changes to one response are combined into a single event.</p>
<h2>Available actions</h2>
<p>Zaps can also send files into PaperSurvey. Use the upload action to submit a scanned document (PDF or image) for processing, for example whenever a new scan appears in a cloud storage folder.</p>
<h2>Connecting your PaperSurvey account</h2>
<p>When Zapier asks you to connect your PaperSurvey account, you will need to authorize the connection. This gives Zapier permission to read your survey responses. Your Zapier connections are listed in the Webhooks section of your PaperSurvey Developer settings, where you can view their delivery logs or remove them at any time.</p>
<h2>Popular Zap recipes</h2>
<table>
<thead>
<tr>
<th>When this happens...</th>
<th>Do this...</th>
</tr>
</thead>
<tbody>
<tr>
<td>New survey response</td>
<td>Add a row to Google Sheets</td>
</tr>
<tr>
<td>New survey response</td>
<td>Send a Slack message to a channel</td>
</tr>
<tr>
<td>New survey response</td>
<td>Create a task in Trello or Asana</td>
</tr>
<tr>
<td>New survey response</td>
<td>Send a summary email</td>
</tr>
<tr>
<td>New survey response</td>
<td>Add a contact to Mailchimp</td>
</tr>
</tbody>
</table>
<h2>Related articles</h2>
<ul>
<li><a href="/help/integrations/article/papersurvey-google-sheets-integration">Google Sheets Integration</a> for direct Google Sheets sync</li>
<li><a href="/help/integrations/article/how-to-use-webhooks">How to Use Webhooks</a> for custom HTTP integrations</li>
</ul>]]>
            </summary>
                                    <updated>2026-07-18T07:29:35+00:00</updated>
        </entry>
            <entry>
            <title><![CDATA[Dynamic Web Survey Forms with Prefill]]></title>
            <link rel="alternate" href="https://www.papersurvey.io/help/prefill-data/article/customized-web-survey-links" />
            <id>https://www.papersurvey.io/115</id>
            <author>
                <name><![CDATA[PaperSurvey.io]]></name>
            </author>
            <summary type="html">
                <![CDATA[<p>Dynamic text lets one survey speak to each respondent personally. You write a placeholder once, and every generated copy, printed or web, replaces it with that row's value from your prefill list. This article covers the placeholder syntax and its layout rules; for the full workflow see the <a href="/help/prefill-data/article/how-to-prefill-survey-data-in-form">complete Prefill Forms guide</a>.</p>
<h2>How placeholders work</h2>
<p>Wrap a column name in double curly braces anywhere in a question, heading, or description:</p>
<p><code>Thanks for visiting _{{location}}_ on _{{date}}_. Would you mind answering a few questions?</code></p>
<p>Combined with this list uploaded to <a href="/app/prefill">Prefill Forms</a>:</p>
<table>
<thead>
<tr>
<th>ID</th>
<th>location</th>
<th>date</th>
</tr>
</thead>
<tbody>
<tr>
<td>123</td>
<td>XYZ Restaurant</td>
<td>2026-01-10</td>
</tr>
<tr>
<td>124</td>
<td>ABC Exhibition</td>
<td>2026-02-01</td>
</tr>
</tbody>
</table>
<p>Each generated copy carries its own wording:</p>
<ul>
<li>"Thanks for visiting XYZ Restaurant on 2026-01-10. Would you mind answering..."</li>
<li>"Thanks for visiting ABC Exhibition on 2026-02-01. Would you mind answering..."</li>
</ul>
<p><img src="/images/blog/dynamic-text.png" alt="Placeholders replaced per copy" /></p>
<p>The placeholder uses the column's name as typed. Spaces just inside the braces are fine (<code>{{ location }}</code> works), and matching tolerates formatting differences in the name itself.</p>
<h2>Keep the layout stable on paper</h2>
<p>On printed surveys, replaced text that runs longer or shorter than the placeholder shifts everything after it, and a layout that moves between copies hurts recognition. Wrap dynamic text in a height box so every copy occupies exactly the same space:</p>
<p><code>[height=2cm]Thanks for visiting {{location}} on {{date}}.[/height]</code></p>
<p>In tight layouts, constrain the width as well: <code>[width=10cm][height=2cm]{{variable}}[/height][/width]</code>. Sizes accept centimeters (cm) or inches (in). Web forms reflow naturally, so this only matters for paper.</p>
<h2>Placeholders on web links</h2>
<p>Personal web links replace placeholders the same way the printed copies do. One extra convenience: if your survey text contains the survey's plain web address, each generated copy swaps it for that row's personal link, so "complete this online at ..." always points the respondent at their own pre-filled form. See <a href="/help/prefill-data/article/generating-prefill-links-in-bulk">Generating Prefill Links in Bulk</a> for expiration dates and submission rules.</p>
<h2>Beyond wording</h2>
<p>Dynamic text is one of three ways a column can reach the survey. A column can also fill a matching question's answer field directly, or ride along invisibly as a Prefill Data question for filtering and exports. All three, plus printing, identifiers, and return tracking, are covered in the <a href="/help/prefill-data/article/how-to-prefill-survey-data-in-form">complete guide</a>.</p>]]>
            </summary>
                                    <updated>2026-07-17T12:49:14+00:00</updated>
        </entry>
            <entry>
            <title><![CDATA[Generating Prefill Links in Bulk]]></title>
            <link rel="alternate" href="https://www.papersurvey.io/help/prefill-data/article/generating-prefill-links-in-bulk" />
            <id>https://www.papersurvey.io/116</id>
            <author>
                <name><![CDATA[PaperSurvey.io]]></name>
            </author>
            <summary type="html">
                <![CDATA[<p>Prefill Forms can turn every row of a spreadsheet into a personal web survey link. Each link opens your web survey with that row's data already applied: matched answer fields pre-filled, <code>{{placeholders}}</code> in the text replaced, and any Prefill Data values attached invisibly to the response. If you are new to Prefill Forms, start with the <a href="/help/prefill-data/article/how-to-prefill-survey-data-in-form">complete guide</a>.</p>
<h2>Before you start</h2>
<ul>
<li><strong>Enable web surveys</strong> for the survey in its settings.</li>
<li><strong>Unique Page Marking must be active</strong> for the survey, since each link is tied to a uniquely identified copy.</li>
<li>Upload your spreadsheet to <a href="/app/prefill">Prefill Forms</a> if you have not already: one row per link, column headers named after the survey fields they should fill.</li>
</ul>
<h2>Generating the links</h2>
<ol>
<li>Open your prefill list and select the rows you want links for.</li>
<li>Open the menu next to the Print button and choose <strong>Generate links to web survey</strong>.</li>
<li>Pick the survey to pre-fill and, optionally, an <strong>expiration date</strong> after which the links stop accepting responses.</li>
<li>Press <strong>Get Links</strong>. A spreadsheet downloads with one personal URL per selected row, alongside the row's data, ready to drop into a mail merge.</li>
</ol>
<p><img src="/images/blog/prefill-forms-web-links.png" alt="Generate links dialog" /></p>
<h2>Controlling how links behave</h2>
<p>Two survey settings decide what the links allow:</p>
<ul>
<li><strong>Prefill links only.</strong> Only the generated links can submit the survey. Anyone visiting the plain survey address is turned away, which keeps uninvited responses out of a closed panel.</li>
<li><strong>Allow multiple submissions.</strong> By default each link accepts one submission. Enable this when the same link should be usable repeatedly, for example a site-level link filled in weekly.</li>
</ul>
<h2>Distributing the links</h2>
<p>The downloaded spreadsheet works anywhere URLs work: individual emails, a mail merge with the respondent's name from the same row, QR codes on printed invitations, or SMS. Because the paper copies and the web links come from the same list, responses from both channels land in one dataset with identical attached data.</p>
<h2>Related articles</h2>
<ul>
<li><a href="/help/prefill-data/article/how-to-prefill-survey-data-in-form">Prefill Forms: the complete guide</a></li>
<li><a href="/help/prefill-data/article/customized-web-survey-links">Dynamic Web Survey Forms with Prefill</a></li>
</ul>]]>
            </summary>
                                    <updated>2026-07-17T12:49:14+00:00</updated>
        </entry>
            <entry>
            <title><![CDATA[What Identifiers Can I Use?]]></title>
            <link rel="alternate" href="https://www.papersurvey.io/help/printing/article/what-identifiers-i-can-use" />
            <id>https://www.papersurvey.io/117</id>
            <author>
                <name><![CDATA[PaperSurvey.io]]></name>
            </author>
            <summary type="html">
                <![CDATA[<p>PaperSurvey supports different types of identifiers to help you track and organize survey copies and responses.</p>
<h2>Automatic identifiers</h2>
<p>By default, PaperSurvey assigns a unique identifier to each entry automatically. You do not need to configure anything for basic tracking.</p>
<h2>Custom identifiers with Prefill Forms</h2>
<p>When using the Prefill Forms feature to generate survey copies, you can assign your own identifiers:</p>
<ul>
<li><strong>Leave the identifier field blank</strong> and PaperSurvey will generate one automatically</li>
<li><strong>Provide a unique value</strong> from your spreadsheet to match responses with your existing records (e.g., student ID, employee number, case reference)</li>
</ul>
<p>Custom identifiers must be unique for each copy and can be up to 32 characters long. If you are generating multiple copies per row, automatic identifiers will be used instead.</p>
<h2>Identifier prefixes</h2>
<p>When generating copies with automatic identifiers, you can set an identifier prefix to tell different print runs apart. For example, with the prefix "ABC_", copies are numbered ABC_1, ABC_2, ABC_3, and the next batch with the same prefix continues from ABC_4. Prefixes can contain letters, numbers, underscores, and dashes.</p>
<h2>Public ID</h2>
<p>Each entry receives a public ID that is visible in the responses list. This is a human-readable identifier that makes it easy to reference specific responses. Printed paper copies are numbered sequentially (e.g., 1, 2, 3, or with your chosen prefix, such as ABC_1), web submissions receive identifiers like WEB_1, and manually entered responses like MANUAL_1.</p>
<h2>Using identifiers to match data</h2>
<p>If you have an external database or spreadsheet, custom identifiers let you match PaperSurvey responses back to your records. For example:</p>
<ol>
<li>Export your list of participant IDs to a spreadsheet</li>
<li>Upload the spreadsheet to Prefill Forms</li>
<li>Map the ID column as the identifier</li>
<li>After processing, export responses and join on the identifier column</li>
</ol>
<h2>Related articles</h2>
<ul>
<li><a href="/help/printing/article/unique-paper-survey-identifiers">Unique Paper Survey Identifiers</a> for more on unique page marking</li>
<li><a href="/help/prefill-data/article/how-to-prefill-survey-data-in-form">How to Prefill Survey Data</a> for the Prefill Forms feature</li>
</ul>]]>
            </summary>
                                    <updated>2026-07-18T07:29:35+00:00</updated>
        </entry>
            <entry>
            <title><![CDATA[Can People Use Any Color Pen to Fill Out a Survey?]]></title>
            <link rel="alternate" href="https://www.papersurvey.io/help/recognition/article/can-people-use-any-color-pen-to-fill-survey" />
            <id>https://www.papersurvey.io/118</id>
            <author>
                <name><![CDATA[PaperSurvey.io]]></name>
            </author>
            <summary type="html">
                <![CDATA[<p>Yes, respondents can use most pen colors to fill out paper surveys. PaperSurvey's recognition engine is designed to detect marks regardless of ink color.</p>
<h2>Recommended colors</h2>
<p><strong>Black</strong> and <strong>blue</strong> ink produce the best results. These colors provide strong contrast against white paper, making marks easy to detect. Scans are processed in grayscale, so what matters is how dark a mark appears, not its color.</p>
<h2>Colors to avoid</h2>
<p><strong>Light colors</strong> such as yellow or light green may not be detected reliably, especially at lower scan resolutions. If respondents have a choice, darker colors are always better.</p>
<p><strong>Red</strong> ink can work but may produce weaker contrast depending on your scanner settings, particularly if scanning in grayscale. If you expect respondents to use red ink, consider scanning in color mode.</p>
<h2>Best results</h2>
<p>For the best recognition accuracy, we recommend using a black or blue pen.</p>
<h2>Faint or thin marks</h2>
<p>Whatever pen is used, instruct participants to make solid, dark marks and to check, cross, or fill in the whole checkbox area. Thin lines or light checkmarks may not be visible to the scanner.</p>]]>
            </summary>
                                    <updated>2026-07-18T07:29:35+00:00</updated>
        </entry>
            <entry>
            <title><![CDATA[Using the Trash Bin]]></title>
            <link rel="alternate" href="https://www.papersurvey.io/help/responses/article/using-the-trash-bin" />
            <id>https://www.papersurvey.io/119</id>
            <author>
                <name><![CDATA[PaperSurvey.io]]></name>
            </author>
            <summary type="html">
                <![CDATA[<p>When you delete a survey in PaperSurvey, it is moved to the trash bin rather than being permanently removed. This gives you a safety net to recover surveys that were deleted by mistake.</p>
<h2>Deleting a survey</h2>
<p>To delete a survey:</p>
<ol>
<li>Find the survey on your dashboard</li>
<li>Open the survey menu (three dots or right-click)</li>
<li>Select <strong>Delete</strong></li>
<li>Confirm the deletion</li>
</ol>
<p>The survey will be moved to the trash bin and will no longer appear on your dashboard.</p>
<h2>Accessing the trash bin</h2>
<p><img src="/images/blog/settings-trash-bin.png" alt="Trash Bin in settings" /></p>
<p>You can find the trash bin in your account settings. It contains all recently deleted surveys.</p>
<h2>Recovering a deleted survey</h2>
<ol>
<li>Open the trash bin</li>
<li>Find the survey you want to recover</li>
<li>Click <strong>Restore</strong></li>
</ol>
<p>The survey will be moved back to your dashboard with all its responses, settings, and analysis views intact.</p>
<h2>Permanent deletion</h2>
<p>Surveys stay in the trash bin for 90 days and are then removed permanently. If you want to permanently delete a survey immediately:</p>
<ol>
<li>Open the trash bin</li>
<li>Find the survey</li>
<li>Select <strong>Remove immediately</strong></li>
</ol>
<p>Permanent deletion cannot be undone. All survey data, responses, and associated files will be removed.</p>
<h2>What gets deleted</h2>
<p>When a survey is permanently deleted:</p>
<ul>
<li>The survey design and questions</li>
<li>All responses and entries</li>
<li>Uploaded scans and images</li>
<li>Analysis views and charts</li>
<li>Export configurations</li>
</ul>
<p>Team settings, account data, and other surveys are not affected.</p>]]>
            </summary>
                                    <updated>2026-07-18T08:45:27+00:00</updated>
        </entry>
            <entry>
            <title><![CDATA[Minimum Image Quality for Scans]]></title>
            <link rel="alternate" href="https://www.papersurvey.io/help/scanning/article/minimum-image-quality-for-scan" />
            <id>https://www.papersurvey.io/120</id>
            <author>
                <name><![CDATA[PaperSurvey.io]]></name>
            </author>
            <summary type="html">
                <![CDATA[<p>PaperSurvey can process a wide range of image qualities, but better quality scans produce more accurate results with fewer fields flagged for manual review.</p>
<h2>Minimum requirements</h2>
<p>There is no strict minimum resolution that will be rejected. However, very low-quality images will result in more fields being flagged for verification, which means more manual review work for you.</p>
<h2>Recommended resolution</h2>
<p><strong>300 DPI</strong> is the recommended scanning resolution. This produces clear, accurate results for both checkmarks and handwritten text.</p>
<table>
<thead>
<tr>
<th>Resolution</th>
<th>Result</th>
</tr>
</thead>
<tbody>
<tr>
<td>300 DPI</td>
<td>Best results, minimal review needed</td>
</tr>
<tr>
<td>200 DPI</td>
<td>Acceptable, some fields may need review</td>
</tr>
<tr>
<td>150 DPI or below</td>
<td>Higher chance of recognition errors</td>
</tr>
<tr>
<td>Above 300 DPI</td>
<td>No added benefit, larger file size</td>
</tr>
</tbody>
</table>
<h2>What affects quality</h2>
<p>Beyond resolution, these factors impact recognition accuracy:</p>
<ul>
<li><strong>Print quality</strong> - Surveys printed on a good laser printer produce clearer marks than inkjet prints</li>
<li><strong>Photocopies</strong> - Photocopied surveys lose some detail but are still readable. See <a href="/help/printing/article/can-paper-surveys-be-photocopied">Can Paper Surveys Be Photocopied?</a></li>
<li><strong>Pen choice</strong> - Black or blue pen produces the most consistent marks</li>
<li><strong>Page condition</strong> - Wrinkled, folded, or stained pages may cause issues</li>
<li><strong>Scanner cleanliness</strong> - Dust or smudges on the scanner glass appear on every page</li>
</ul>
<h2>Smartphone photos</h2>
<p>Photos taken with a smartphone camera can also be processed, though they typically have lower quality than flatbed scans. For best results with phone photos, ensure good lighting and hold the camera directly above the page.</p>
<h2>When quality is too low</h2>
<p>If PaperSurvey cannot read a page at all, it will be flagged for your review. You can then manually enter the responses or re-scan the page at a higher quality.</p>]]>
            </summary>
                                    <updated>2026-03-31T10:06:46+00:00</updated>
        </entry>
            <entry>
            <title><![CDATA[Recommended Settings for Your Scanner]]></title>
            <link rel="alternate" href="https://www.papersurvey.io/help/scanning/article/recommended-settings-for-scanner" />
            <id>https://www.papersurvey.io/121</id>
            <author>
                <name><![CDATA[PaperSurvey.io]]></name>
            </author>
            <summary type="html">
                <![CDATA[<p>Using the right scanner settings helps PaperSurvey read your surveys accurately and quickly. Here are the recommended settings for the best results.</p>
<h2>Recommended settings</h2>
<table>
<thead>
<tr>
<th>Setting</th>
<th>Recommendation</th>
</tr>
</thead>
<tbody>
<tr>
<td>Resolution (DPI)</td>
<td>300 DPI</td>
</tr>
<tr>
<td>Color mode</td>
<td>Grayscale or black and white</td>
</tr>
<tr>
<td>File format</td>
<td>PDF (multi-page) or JPEG/PNG (single page)</td>
</tr>
<tr>
<td>Paper size</td>
<td>Match your survey size (A4 or Letter)</td>
</tr>
</tbody>
</table>
<h2>Resolution (DPI)</h2>
<p><strong>300 DPI</strong> is the recommended resolution. This provides a good balance between image quality and file size.</p>
<ul>
<li>Scanning below 200 DPI may result in more fields flagged for manual review</li>
<li>Scanning above 300 DPI (e.g., 600 DPI) does not improve recognition accuracy and produces larger files that take longer to upload</li>
</ul>
<h2>Color mode</h2>
<p><strong>Grayscale</strong> is the best option for most surveys. It preserves enough detail for accurate recognition while keeping file sizes manageable.</p>
<p><strong>Black and white</strong> (1-bit) works well for surveys with only checkmarks and printed text, but may lose detail on handwritten text.</p>
<p><strong>Color</strong> scanning works fine but produces larger files without improving recognition accuracy.</p>
<h2>File format</h2>
<p><strong>PDF</strong> is ideal when scanning multiple pages, as you can combine all pages into a single file. Most document scanners support multi-page PDF output.</p>
<p><strong>JPEG</strong> and <strong>PNG</strong> work well for single-page scans. JPEG files are smaller, while PNG preserves exact detail.</p>
<p>For a full list of accepted formats, see <a href="/help/recognition/article/supported-scanning-formats">Supported Scanning Formats</a>.</p>]]>
            </summary>
                                    <updated>2026-03-29T04:30:48+00:00</updated>
        </entry>
            <entry>
            <title><![CDATA[How User Data Is Protected]]></title>
            <link rel="alternate" href="https://www.papersurvey.io/help/security/article/how-user-data-is-protected" />
            <id>https://www.papersurvey.io/122</id>
            <author>
                <name><![CDATA[PaperSurvey.io]]></name>
            </author>
            <summary type="html">
                <![CDATA[<p>PaperSurvey is committed to keeping your survey data secure. This article explains the measures in place to protect your information.</p>
<h2>Data encryption</h2>
<p>All data is encrypted both in transit and at rest:</p>
<ul>
<li><strong>In transit</strong> - All connections use HTTPS/TLS encryption, ensuring data is protected as it moves between your browser and our servers</li>
<li><strong>At rest</strong> - Stored data is encrypted using industry-standard encryption methods</li>
</ul>
<h2>Access controls</h2>
<p>Your data is protected by multiple layers of access control:</p>
<ul>
<li><strong>Authentication</strong> - Password-based login with optional two-factor authentication and passkey support</li>
<li><strong>Role-based access</strong> - Team members are assigned roles that limit what they can view and modify</li>
<li><strong>Team isolation</strong> - Each team's data is completely separate from other teams</li>
</ul>
<h2>GDPR compliance</h2>
<p>PaperSurvey is fully GDPR compliant. For details on our GDPR practices, see <a href="/help/security/article/is-paper-survey-GDPR-compliant">Is PaperSurvey GDPR Compliant?</a>.</p>
<p>Key points:</p>
<ul>
<li>You can export and delete respondent data at any time</li>
<li>Data processing agreements are available upon request</li>
<li>Respondent anonymity can be maintained through survey design choices</li>
</ul>
<h2>Respondent privacy</h2>
<p>Survey responses can be collected anonymously. PaperSurvey does not require respondents to identify themselves unless your survey explicitly asks for identifying information.</p>
<p>For more on respondent identification, see <a href="/help/security/article/can-survey-respondents-be-identified">Can Survey Respondents Be Identified?</a> and <a href="/help/security/article/how-participant-identities-are-protected">How Participant Identities Are Protected</a>.</p>
<h2>Account security features</h2>
<ul>
<li><strong>Two-factor authentication</strong> - Add an extra layer of security to your login. See <a href="/help/account-settings/article/setting-up-two-factor-authentication">Setting Up 2FA</a></li>
<li><strong>Passkeys</strong> - Use passwordless authentication with biometrics or security keys. See <a href="/help/account-settings/article/managing-passkeys">Managing Passkeys</a></li>
<li><strong>SAML SSO</strong> - Integrate with your organization's identity provider. See <a href="/help/account-settings/article/saml-sso-configuration">SAML SSO Configuration</a></li>
<li><strong>Team-enforced 2FA</strong> - Require all team members to use two-factor authentication. See <a href="/help/account-settings/article/team-security-settings">Team Security Settings</a></li>
</ul>
<h2>Data retention</h2>
<p>Your survey data is retained as long as your account is active. If you cancel your subscription, data is preserved for a reasonable period to allow reactivation. You can export your data at any time.</p>]]>
            </summary>
                                    <updated>2026-03-29T04:30:48+00:00</updated>
        </entry>
            <entry>
            <title><![CDATA[Can I Suspend My Account and Recover Surveys Later?]]></title>
            <link rel="alternate" href="https://www.papersurvey.io/help/subscription/article/can-suspend-account-and-recover-surveys" />
            <id>https://www.papersurvey.io/123</id>
            <author>
                <name><![CDATA[PaperSurvey.io]]></name>
            </author>
            <summary type="html">
                <![CDATA[<p>Yes, your surveys and data are preserved even if you cancel your subscription. You can return and reactivate your account to access everything again.</p>
<h2>What happens when you cancel</h2>
<p>When you cancel your subscription:</p>
<ul>
<li>Your account remains accessible until the end of your current billing period</li>
<li>After the billing period ends, you lose access to paid features</li>
<li>Your surveys, responses, and data are <strong>not deleted</strong></li>
<li>Your account and login credentials remain active</li>
</ul>
<h2>Recovering your data</h2>
<p>To regain access to your surveys after a period of inactivity:</p>
<ol>
<li>Sign in to your PaperSurvey account</li>
<li>Reactivate your subscription from the billing page</li>
<li>All your surveys, responses, and settings will be available immediately</li>
</ol>
<p>There is no need to contact support. Your data is preserved automatically.</p>
<h2>How long is data kept?</h2>
<p>Your data is retained for a reasonable period after cancellation. If you plan to be inactive for an extended time, we recommend exporting your data as a backup before cancelling.</p>
<h2>Downgrading vs cancelling</h2>
<p>If you want to reduce costs but keep some access, consider downgrading to a lower plan instead of cancelling entirely. You can upgrade or downgrade at any time from your billing settings.</p>
<p>See <a href="/help/subscription/article/cancel-or-upgrade-account">Cancel or Upgrade Account</a> for details on changing your plan.</p>]]>
            </summary>
                                    <updated>2026-03-29T04:30:48+00:00</updated>
        </entry>
            <entry>
            <title><![CDATA[Using QR Codes for Survey Distribution]]></title>
            <link rel="alternate" href="https://www.papersurvey.io/help/web-surveys/article/using-qr-codes-for-survey-distribution" />
            <id>https://www.papersurvey.io/124</id>
            <author>
                <name><![CDATA[PaperSurvey.io]]></name>
            </author>
            <summary type="html">
                <![CDATA[<p>QR codes are a convenient way to share your web survey with respondents. People scan the QR code with their smartphone camera and are taken directly to your survey, with no need to type a URL.</p>
<h2>Generating a QR code</h2>
<p><img src="/images/blog/settings-web-surveys.png" alt="Web Surveys settings with QR code link" /></p>
<ol>
<li>Open your survey and enable <strong>Web Surveys</strong> if not already active</li>
<li>Copy your survey link</li>
<li>Use any free QR code generator (search for "QR code generator" online) to create a QR code from your survey URL</li>
</ol>
<p>You can also generate a QR code within PaperSurvey. In your survey's Web Surveys settings there is a QR code link (ending in <code>/qr/</code> followed by your survey slug) that opens the QR code image, which you can then save.</p>
<h2>Where to use QR codes</h2>
<p>QR codes work well in situations where people have their phones nearby:</p>
<ul>
<li><strong>Printed flyers and posters</strong> - Place in waiting rooms, notice boards, or event venues</li>
<li><strong>Business cards</strong> - Include a feedback survey QR code on your business card</li>
<li><strong>Product packaging</strong> - Collect customer feedback at the point of use</li>
<li><strong>Event materials</strong> - Add to programs, badges, or table displays</li>
<li><strong>Receipts</strong> - Print on receipts for post-purchase feedback</li>
<li><strong>Presentations</strong> - Display on screen during meetings or conferences</li>
</ul>
<h2>Best practices</h2>
<ul>
<li><strong>Make it large enough</strong> - QR codes should be at least 2cm x 2cm (about 1 inch) for reliable scanning</li>
<li><strong>Test before printing</strong> - Scan the QR code yourself to confirm it leads to the correct survey</li>
<li><strong>Add a call to action</strong> - Include text near the QR code like "Scan to share your feedback" so people know what it does</li>
<li><strong>Use a short URL</strong> - PaperSurvey's survey links are already short, which produces simpler QR codes</li>
<li><strong>Ensure contrast</strong> - Print QR codes in dark colors on a light background for best scanning results</li>
</ul>
<h2>Combining QR codes with paper surveys</h2>
<p>You can include a QR code on your printed paper survey as well. This gives respondents the option to complete the survey on their phone instead of filling in the paper form. See <a href="/help/form-design/article/how-to-insert-qr-code">How to Insert a QR Code</a> for details on adding QR codes to your survey design.</p>
<h2>Tracking QR code responses</h2>
<p>Responses submitted through a QR code link are recorded as web survey responses. They appear in the same Responses tab alongside paper responses and can be filtered by collection method.</p>]]>
            </summary>
                                    <updated>2026-07-18T08:45:27+00:00</updated>
        </entry>
            <entry>
            <title><![CDATA[Test and Exam Analysis Charts]]></title>
            <link rel="alternate" href="https://www.papersurvey.io/help/analysis-reports/article/quiz-analysis-charts" />
            <id>https://www.papersurvey.io/125</id>
            <author>
                <name><![CDATA[PaperSurvey.io]]></name>
            </author>
            <summary type="html">
                <![CDATA[<p>When grading is enabled on a survey and answer keys are set, PaperSurvey automatically shows test-specific analysis charts. These charts help you understand overall performance, identify difficult questions, and see how scores are distributed across respondents.</p>
<h2>Test Results Overview</h2>
<p>When you open the Results tab for a graded survey, a Test Results card appears at the top of the page. The overview shows summary statistics and a list of frequently missed questions.</p>
<p><img src="/images/blog/chart-type-quiz-overview.png" alt="Test results overview" /></p>
<p><strong>What it shows:</strong></p>
<ul>
<li>Average score as a percentage, with color coding (green for strong, yellow for moderate, red for weak performance)</li>
<li>Median, high, and low scores, plus the maximum possible score</li>
<li>Number of respondents</li>
<li>Pass and fail counts (when a pass threshold is configured)</li>
<li>The five most frequently missed questions, with progress bars showing the percentage of respondents who answered correctly</li>
</ul>
<h2>Score Distribution</h2>
<p>The Score Distribution view shows a histogram of total scores across all respondents. Each bar represents a score value, and the height shows how many respondents achieved that score.</p>
<p><img src="/images/blog/chart-type-score-distribution.png" alt="Score distribution chart" /></p>
<p><strong>Best for:</strong> Understanding the overall spread of performance. A bell-shaped curve suggests a well-designed test. A skew toward high scores suggests the test was too easy, while a skew toward low scores suggests it was too difficult. When a pass threshold is set, bars are colored green (pass) or red (fail) with a reference line at the threshold.</p>
<h2>Item Difficulty</h2>
<p>The Item Difficulty view shows a horizontal bar for each graded question, sorted from hardest to easiest. Bars are color-coded by difficulty zone.</p>
<p><img src="/images/blog/chart-type-item-difficulty.png" alt="Item difficulty chart" /></p>
<p><strong>Color coding:</strong></p>
<ul>
<li>Green bars indicate easy questions (more than 70% of respondents answered correctly)</li>
<li>Yellow bars indicate moderate difficulty (30% to 70% correct)</li>
<li>Red bars indicate difficult questions (fewer than 30% correct)</li>
</ul>
<p>Reference lines at 30% and 70% help you quickly identify questions in each zone. A side table shows the exact percentage, count, difficulty level, and discrimination index for each question. Hover over column headers for explanations.</p>
<p><strong>Discrimination index</strong> measures how well a question differentiates between high-scoring and low-scoring respondents. A value above 0.3 means the question is a good differentiator. Below 0.15 suggests the question may need revision.</p>
<h2>Score Over Time</h2>
<p>The Score Over Time view shows how average test scores change across time periods (daily, weekly, or monthly). A line tracks the average score, while bars show the number of respondents per period.</p>
<p><strong>Best for:</strong> Monitoring performance trends when a test is administered over an extended period. When a pass threshold is set, the bars split into green (passed) and red (failed) counts, and a reference line shows the threshold.</p>
<h2>Correct and Incorrect Highlighting</h2>
<p>For individual question charts (bar, horizontal bar, pie), answer options are automatically color-coded when an answer key is set.</p>
<p><img src="/images/blog/chart-type-quiz-highlighting.png" alt="Correct/incorrect highlighting" /></p>
<ul>
<li>Green indicates the correct answer, with a checkmark in the response table</li>
<li>Red indicates an incorrect answer (if marked in the answer key)</li>
<li>Other options use the standard chart color</li>
</ul>
<p>This highlighting also appears in the Summary view (stacked distribution and diverging bar charts), where the correct answer segment is shown in green across all questions.</p>
<h2>Pass Threshold</h2>
<p>You can set a pass threshold as a percentage (e.g., 70%) in Settings under the Grading section. When configured:</p>
<ul>
<li>The Test Results overview shows pass and fail counts</li>
<li>The Score Distribution chart colors bars green (pass) or red (fail)</li>
<li>The Responses table shows a Pass/Fail column</li>
<li>CSV and Excel exports include a Pass/Fail column</li>
<li>Respondents see their pass or fail status after submitting a web survey</li>
</ul>
<h2>Setting Up Grading</h2>
<p>To enable test analysis charts:</p>
<ol>
<li>Open your survey and go to Settings</li>
<li>Turn on "Activate test grading" in the Grading section</li>
<li>Optionally set a pass threshold percentage</li>
<li>For each question you want to grade, click the question menu and select "Answer Key"</li>
<li>Mark the correct answer and set the point value</li>
<li>Once responses are collected, the Test Results card will appear automatically on the Results tab</li>
</ol>
<h2>Saving Test Charts to a Dashboard</h2>
<p>You can save test analysis charts as widgets on your analysis dashboard. The widget types available for graded surveys are Test Summary, Score Distribution, Item Difficulty, and Reliability. These widgets update automatically as new responses come in.</p>]]>
            </summary>
                                    <updated>2026-07-17T12:49:14+00:00</updated>
        </entry>
            <entry>
            <title><![CDATA[Skip Logic: Show, Hide, or End the Survey Based on Earlier Answers]]></title>
            <link rel="alternate" href="https://www.papersurvey.io/help/form-design/article/skip-logic-conditional-questions" />
            <id>https://www.papersurvey.io/126</id>
            <author>
                <name><![CDATA[PaperSurvey.io]]></name>
            </author>
            <summary type="html">
                <![CDATA[<p>Skip Logic lets you show a question only when an earlier answer matches a condition you set. Use it to ask follow-up questions only when they apply, hide whole sections that aren't relevant, or branch respondents through different paths of your survey.</p>
<p>For example, you can ask "How long have you lived here?" only after the respondent answered "Yes" or "Not sure" to "Do you live in the area?". Respondents who answered "No" never see the follow-up.</p>
<p>A related capability, <strong>End Survey</strong>, lets a particular answer stop the survey immediately, sending the respondent straight to the thank-you screen. See <a href="#ending-the-survey-early">Ending the survey early</a> below.</p>
<h2>Where Skip Logic appears</h2>
<p>Skip Logic works on both the online (web) survey and the printed paper survey, but in slightly different ways:</p>
<ul>
<li><strong>On the web survey</strong>: Conditional questions stay completely hidden until the rules match. Respondents never see them when the condition is false. Required validation is also skipped, so a hidden question never blocks the form from being submitted.</li>
<li><strong>On the paper survey</strong>: Every question always prints because we can't dynamically hide ink on a page. Instead, PaperSurvey adds two helpful guides automatically: a small "Only answer if..." reminder above the conditional question, and a "→ skip to Q5" hint under each answer of the earlier question that should bypass the follow-up.</li>
</ul>
<h2>Setting up Skip Logic</h2>
<p>Skip Logic is configured per question, in the <strong>Additional Settings</strong> dialog.</p>
<img src="/images/blog/skip-logic-editor.png" alt="Skip Logic editor showing a single 'is one of' rule against Q2 with Option 2 selected" style="width:60%"/>
<ol>
<li>Open the survey in the form builder.</li>
<li>Click the tools icon next to the question that should be conditional and choose <strong>Additional settings</strong>.</li>
<li>Find the <strong>Skip Logic</strong> section.</li>
<li>Click <strong>+ Add condition</strong> to add your first rule.</li>
<li>Pick the earlier question, the operator, and (if needed) the answer values that should reveal this question.</li>
<li>Save.</li>
</ol>
<h2>Conditions you can use</h2>
<p>Each condition compares an earlier question's answer to a value. PaperSurvey supports four operators:</p>
<ul>
<li><strong>is one of</strong> — show this question if the earlier answer is any of the values you pick. Most common for "Yes/No/Not sure" follow-ups.</li>
<li><strong>is not one of</strong> — show this question unless the earlier answer is one of the listed values. Useful when one specific answer should hide the follow-up.</li>
<li><strong>was answered</strong> — show this question only if the earlier question received any answer.</li>
<li><strong>was not answered</strong> — show this question only when the earlier question was left blank.</li>
</ul>
<p>The "earlier question" must be a single-choice or multiple-choice question that appears before the conditional question in the survey.</p>
<h2>Combining multiple conditions</h2>
<p>You can add up to five conditions on the same question. When you have two or more, choose how they combine:</p>
<ul>
<li><strong>All</strong> (AND) — every condition must be true. Use when several criteria must apply at once, e.g. "Q3 is Yes AND Q5 is Adult."</li>
<li><strong>Any</strong> (OR) — at least one condition must be true. Use when the question applies in several different cases.</li>
</ul>
<p>If you need more complex logic than this, consider splitting the question into two conditional copies, each with its own simpler rule set.</p>
<h2>Ending the survey early</h2>
<p>Sometimes a particular answer means the survey should stop. The classic case is a consent question where "I disagree" should send the respondent straight to the thank-you screen without asking anything else. Another common case is a screener that excludes respondents who don't meet eligibility criteria.</p>
<p>For these, use <strong>End Survey</strong> instead of (or alongside) Skip Logic.</p>
<h3>Setting it up</h3>
<ol>
<li>Open the question's <strong>Additional settings</strong>.</li>
<li>In the <strong>Skip Logic</strong> section, find <strong>End survey on answer</strong> and pick the answers that should immediately end the survey.</li>
<li>Save.</li>
</ol>
<p>End Survey is available on <strong>single-choice and multiple-choice questions</strong>. The terminal answers are stored alongside any Skip Logic rules on the same question, so a single question can both be conditional (Skip Logic) and act as a terminator (End Survey).</p>
<h3>How it behaves on the web survey</h3>
<p>The moment the respondent ticks a terminal answer, the form <strong>auto-submits silently</strong> and they land on the thank-you screen. They don't have to click Submit, and they're not asked the remaining questions. Any answers they may have already entered on later questions are not validated or stored, so your data only contains responses up to and including the terminal answer.</p>
<p>This matches the convention used by Qualtrics and REDCap, and is the recommended pattern for consent: a respondent who has just declined consent should not be asked to perform one more action to "send" their decline.</p>
<h3>How it behaves on the printed paper survey</h3>
<p>Next to the terminal answer, PaperSurvey prints a <em>"→ end of survey"</em> arrow in the same position used by regular Skip Logic for <em>"→ skip to Q5"</em>. The arrow renders <strong>regardless of whether automatic question numbering is enabled</strong>, because no question number is being referenced.</p>
<p>If the respondent ignores the arrow and keeps ticking answers on later pages, those answers are dropped during OCR import. The stored entry only contains responses up to and including the terminal answer, matching web behaviour exactly.</p>
<h3>When to use End Survey vs Skip Logic</h3>
<ul>
<li>Use <strong>Skip Logic</strong> when later questions should sometimes be skipped but the survey continues.</li>
<li>Use <strong>End Survey</strong> when a particular answer should end the survey entirely.</li>
<li>They compose: you can use both on the same question if needed.</li>
</ul>
<h3>Best practices</h3>
<ul>
<li><strong>Consent questions.</strong> Mark the "decline" answer as the terminator. The silent auto-submit and OCR drop ensure non-consenters' data is not collected, which is what most IRB protocols expect.</li>
<li><strong>Screeners.</strong> Mark the disqualifying answer as the terminator and place the screener question before any data-collecting questions.</li>
<li><strong>The terminator answer itself is always kept.</strong> This is intentional: it lets you report on how many respondents declined consent or were screened out, without storing the rest of their unanswered survey.</li>
</ul>
<h2>What can be conditional</h2>
<p>Skip Logic is available on most question types, including:</p>
<ul>
<li>Single-choice and multiple-choice questions</li>
<li>Open-ended text questions, numbers, dates, NPS and rating scales</li>
<li>Section headings, descriptions, and callout boxes — useful for hiding an entire section by attaching the rule to its heading and the questions under it</li>
<li>Grids and tables (single-choice grids, yes/no tables, etc.)</li>
</ul>
<p>Pure layout elements (page breaks, dividers, vertical spacers, multi-column wrappers, repeaters) do not support Skip Logic because they don't carry meaningful content on their own.</p>
<h2>Skip Logic on the printed paper survey</h2>
<p>When your survey is also distributed on paper, Skip Logic still helps respondents navigate without confusing them with hidden questions.</p>
<h3>Automatic helpers</h3>
<p>If your survey has <strong>automatic question numbering</strong> turned on, two things happen for every question with Skip Logic:</p>
<ol>
<li>A small italic reminder prints <strong>above</strong> the question. For example: <em>"Only answer if Q3 is Yes or Not sure."</em> This reminder is added on input questions only — for section headings, descriptions, and callout boxes, the reminder is omitted (there is nothing for the respondent to "answer" on a heading).</li>
<li>A right-aligned hint <em>"→ skip to Q5"</em> prints next to each answer of the earlier question that bypasses the conditional question. The respondent reads "→ skip to Q5" under "No" and knows to jump past the follow-up.</li>
</ol>
<p><strong>When the skip arrow actually prints.</strong> The arrow is intentionally conservative — it only renders in cases where the routing is unambiguous:</p>
<ul>
<li>The conditional question must be <strong>directly after its parent</strong> in the survey, or every question between them must also depend on the same parent and be hidden by the same answer.</li>
<li>The rule must reference <strong>exactly one parent question</strong>. Multi-condition rules (e.g. "Q3 = Yes AND Q5 = Maybe") never produce an automatic arrow because the right next-step depends on multiple answers.</li>
<li>The parent must be a single-choice or multiple-choice question.</li>
</ul>
<p>If your rule doesn't meet those criteria, the printed reminder <em>"Only answer if..."</em> still appears above the conditional question — the respondent reads it when they get there and decides whether to engage. To get a skip arrow as well, move the conditional question so it sits immediately after its parent, or add <code>[paper]…[/paper]</code> shortcodes in the parent question's option labels to write your own routing instructions.</p>
<p>The editor surfaces a notice when your configured rule won't produce an arrow, so you'll see this called out before you generate the PDF.</p>
<h3>Question numbering is required</h3>
<p>If your survey doesn't use automatic question numbering, the printed reminder cannot say <em>"Q3"</em> — there are no question numbers to refer to. In that case PaperSurvey skips the automatic helpers and asks you to either:</p>
<ol>
<li>Turn on automatic question numbering in your survey settings, or</li>
<li>Write your own paper instruction inside the question name (see below).</li>
</ol>
<h3>Writing your own paper instruction</h3>
<p>Sometimes the automatic wording doesn't read well, or you want a paper-only sentence that's worded differently from the one online. Both <code>[paper]…[/paper]</code> and <code>[web]…[/web]</code> shortcodes let you target text at a specific medium.</p>
<p>Inside any question name, helper text, or option label:</p>
<ul>
<li><code>[paper]…[/paper]</code> — the wrapped text prints <strong>only</strong> on the paper survey. Use this for printed skip directions.</li>
<li><code>[web]…[/web]</code> — the wrapped text shows <strong>only</strong> on the web survey. Useful for clickable hints or web-specific phrasing.</li>
</ul>
<p>Example of a question name that has both an online and a printed instruction:</p>
<pre><code>Do you live in the area? [paper]If No, skip to Q5.[/paper]</code></pre>
<p>On the web survey respondents see <em>"Do you live in the area?"</em>. On the printed paper they see <em>"Do you live in the area? If No, skip to Q5."</em></p>
<p>To suppress the automatic reminder and skip hints for a specific conditional question, open its <strong>Additional settings</strong>, scroll to <strong>Skip Logic</strong>, and check <strong>"Don't add these automatically. I'll write my own paper instruction."</strong> Then add your instruction with <code>[paper]…[/paper]</code> in the question name.</p>
<h2>How responses are stored</h2>
<p>When a question is hidden by Skip Logic on the web survey, no response is stored for it, even if the respondent had answered it earlier and then changed an upstream answer that hides it. This keeps your data clean: you'll only see answers that the respondent was actually asked.</p>
<p>On paper, all Skip-Logic-hidden responses are stored as scanned, including any ink the respondent may have entered against a question they were supposed to skip. PaperSurvey doesn't filter those out, because there's no reliable way to know whether the respondent intentionally crossed the skip instruction or simply ignored it.</p>
<p><strong>End Survey is the exception on paper.</strong> When a terminal answer is detected, every response captured after that question is dropped at import time, on both web and paper, so the two channels stay consistent.</p>
<h2>Tips and best practices</h2>
<ul>
<li><strong>Keep rules simple.</strong> A single condition with one or two values is easier for respondents to follow on paper than a multi-rule AND/OR.</li>
<li><strong>Place the conditional question close to its parent.</strong> A respondent reading a printed survey will follow the "→ skip to Q5" arrow more naturally if the target is a few questions away, not pages later.</li>
<li><strong>Hide entire sections by attaching the rule to a heading.</strong> The heading and every question that follows can be hidden as a group on the web. On paper, the heading itself prints without a reminder; each input question in the section carries its own "Only answer if..." note, and the skip arrows under the parent question's answers carry the routing.</li>
<li><strong>Use <code>[paper]…[/paper]</code> shortcodes for any wording the automatic helper can't capture.</strong> Long sentences, polite phrasing, multi-step routing — these all read better when you write them yourself.</li>
<li><strong>Test your logic on the web preview before printing.</strong> Once you're happy with how the survey behaves online, generate the PDF and walk through the printed routing arrows.</li>
</ul>
<h2>What Skip Logic does not do (yet)</h2>
<ul>
<li>Conditions on numeric ranges (e.g. "show if Q5 is greater than 18") are not supported. Use a single-choice question with age groups for now.</li>
<li>Conditions on free-text answers (e.g. "show if Q5 contains 'student'") are not supported.</li>
<li>Grid sub-questions cannot themselves be parents of a Skip Logic rule.</li>
</ul>
<p>If you need any of these and they would help your survey, let us know at <a href="mailto:support@papersurvey.io">support@papersurvey.io</a>.</p>]]>
            </summary>
                                    <updated>2026-07-17T12:49:14+00:00</updated>
        </entry>
            <entry>
            <title><![CDATA[Why Was My Password Rejected?]]></title>
            <link rel="alternate" href="https://www.papersurvey.io/help/security/article/why-was-my-password-rejected" />
            <id>https://www.papersurvey.io/127</id>
            <author>
                <name><![CDATA[PaperSurvey.io]]></name>
            </author>
            <summary type="html">
                <![CDATA[<p>When you create a PaperSurvey account or change your password, we sometimes ask you to pick a different one. This page explains why that happens and how to choose a password that will be accepted.</p>
<h2>What we check</h2>
<p>Our password rules follow NIST SP 800-63B, the digital identity guideline published by the US National Institute of Standards and Technology. In line with that guideline, a password only needs to meet two conditions:</p>
<ul>
<li>It must be at least 8 characters long. Spaces are fine, and you can use a whole sentence if you like.</li>
<li>It must not appear on public lists of commonly used passwords.</li>
</ul>
<p>That is all. The same guideline advises against requiring uppercase letters, numbers, or special characters, because length protects an account far better than forced symbols. We would rather you pick a longer password you can actually remember.</p>
<h2>Why some passwords are declined</h2>
<p>Over the years, many websites around the world have had security incidents, and large lists of the passwords used there now circulate publicly. Attackers try those lists first whenever they attempt to break into accounts. If a password appears on those lists, it can be guessed in seconds, no matter how personal it feels.</p>
<p>When we decline a password for this reason, it simply means many other people have used the same password before and it is now publicly known.</p>
<h2>Does this mean my account was hacked?</h2>
<p>No. Nothing has happened to your PaperSurvey account or your data. The check looks at the password itself, not at you. It only tells us that the same combination of characters appears on public lists. PaperSurvey has not been breached, and no one is targeting your account. Declining the password is purely a precaution, so that your account never depends on a password attackers already know.</p>
<h2>How the check works</h2>
<p>Your password is never shared with anyone. The check uses only the first few characters of a scrambled fingerprint of your password (called a hash) and compares that tiny fragment against Have I Been Pwned, a well known public safety database used by many major online services. It is impossible to reconstruct your password from the fragment used in the lookup.</p>
<h2>How to pick a strong password</h2>
<ul>
<li>Longer is stronger. A short sentence such as "my dog naps on the blue sofa" is easy to remember and very hard to guess.</li>
<li>Avoid single common words, names, and simple patterns like "12345678".</li>
<li>Use a different password for every website. A password manager makes this effortless and can generate and remember passwords for you.</li>
</ul>
<p>If your password was declined, try a longer and more personal phrase. And if you have used the declined password on other websites, changing it there as well is a good idea.</p>]]>
            </summary>
                                    <updated>2026-07-15T05:30:55+00:00</updated>
        </entry>
            <entry>
            <title><![CDATA[A/B Testing with Paper Surveys: Sample Sizes, Significance and Odds Ratios]]></title>
            <link rel="alternate" href="https://www.papersurvey.io/help/statistical-analysis/article/ab-testing-with-paper-surveys" />
            <id>https://www.papersurvey.io/128</id>
            <author>
                <name><![CDATA[PaperSurvey.io]]></name>
            </author>
            <summary type="html">
                <![CDATA[<p>An A/B test on paper works exactly like one online: two versions of something (a flyer, a cover letter, an incentive), one binary outcome, and a statistical test that tells you whether the difference you see is real. The <strong>Response plan</strong> in a survey's <strong>Settings</strong> sizes a survey for a single percentage across the whole sample, so it will not size the two arms of a test, and statistical power is not computed anywhere in the app. Planning an A/B test therefore still happens before you print, in the free <a href="/pages/ab-test-sample-size-calculator">A/B Test Sample Size Calculator</a>, and the app then runs the significance test on the collected responses automatically. This article walks through the full loop using real figures from a demo PaperSurvey account.</p>
<h2>Plan the sample size before you print</h2>
<p>The most common A/B testing mistake is stopping too early with too few responses. Before printing anything, open the <a href="/pages/ab-test-sample-size-calculator">A/B Test Sample Size Calculator</a> and fill in four inputs:</p>
<ol>
<li><strong>Baseline rate (%)</strong>, the outcome rate you see today, for example the registration rate your current flyer achieves.</li>
<li><strong>Expected rate (%)</strong>, the rate that would make the new version worth adopting.</li>
<li><strong>Confidence level</strong>, usually 95%.</li>
<li><strong>Statistical power</strong>, usually 80%.</li>
</ol>
<p>The result is a <strong>Sample size per group</strong>, the number of completed responses each arm needs before the test can reliably detect that difference. Small lifts need surprisingly large groups, which is exactly why you calculate this before printing rather than after running out of forms.</p>
<h2>Design the survey: one group question, one outcome question</h2>
<p>The survey itself only needs two Single choice questions: one recording which version the respondent received ("Which flyer did you receive?" with options Version A and Version B) and one recording the binary outcome ("Did you register?" with Yes and No). Everything else is optional context.</p>
<p>To track each arm's fieldwork toward the per-group target, print each version's forms as its own batch and open <strong>Prints</strong> in the main navigation. The Generated Prints page lists every batch with a <strong>Copies Requested</strong> column and an <strong>Uploaded</strong> column in the form "X / Y", processed returns out of the copies in that batch. One caveat from the column's own tooltip: if you reprint a batch reusing the same identifiers, the counter can become inaccurate, so keep one batch per print run.</p>
<h2>The demo data</h2>
<p>The screenshots below come from the demo Employee Wellbeing Study, 300 respondents, where "Do you exercise at least twice a week?" plays the role of the group question and "Have you taken a sick day in the last month?" is the binary outcome. This is an observational pairing rather than a randomized experiment, but the arithmetic is identical to a flyer test: two groups, one yes/no outcome, one 2×2 table.</p>
<h2>Read the verdict on Compare Responses</h2>
<ol>
<li>Open the survey's <strong>Analysis</strong> tab and switch to the <strong>Compare Responses</strong> tab.</li>
<li>Under "How do responses differ based on:" pick the group question. The page then cross-tabulates it against every other eligible question automatically.</li>
<li>Switch the toggle at the top right from <strong>Simple</strong> to <strong>Advanced</strong> to see the full statistics.</li>
</ol>
<p>The card for the outcome question shows the cross-tab table, and the page's Chart/Table/Both control can add side-by-side bars. In the demo, 21 of the 168 respondents who exercise took a sick day (12.5%), against 45 of the 132 who do not (34.1%). The stats footer reads χ² = 20.0811, df = 1, p &lt; 0.0001, with the green verdict <strong>Sig. (Fisher)</strong>, Fisher p &lt; 0.0001, V = 0.2587 (Small) and MoE ±5.7%.</p>
<p><img src="/images/blog/help-calc-fisher-2x2.png" alt="2x2 comparison card with Fisher&#039;s exact test verdict" /></p>
<p>Because this is a 2×2 table, PaperSurvey runs Fisher's exact test alongside chi-square and treats it as the primary verdict. Fisher's test is exact at any sample size, which matters for A/B tests where one cell can end up small. The page also reminds you that these comparisons are exploratory, and Cramér's V gives you an effect-size label so a significant but tiny association does not get oversold.</p>
<p>To show your work, click the card's <strong>Workbook</strong> link (labelled <strong>Download workbook</strong> in Simple mode). It downloads an Excel file with the observed and expected frequencies and a step-by-step chi-square sheet built on live =CHISQ.DIST.RT formulas, so a colleague can audit every number.</p>
<h2>Quantify the effect with the Odds Ratio widget</h2>
<p>Significance says the difference is real. The odds ratio says how big it is, in the units most journals and stakeholders expect for binary outcomes.</p>
<ol>
<li>Open an analysis view on the <strong>Analysis</strong> tab and click <strong>Edit</strong>.</li>
<li>Click <strong>Add</strong> and pick <strong>Odds Ratio</strong> from the <strong>Advanced stats</strong> category of the Add blocks drawer.</li>
<li>In the inspector, set the <strong>Exposure question</strong> and its <strong>Positive option</strong> (here the exercise question, positive option Yes), then the <strong>Outcome question</strong> and its <strong>Positive option</strong> (the sick day question, Yes).</li>
</ol>
<p>The app builds the 2×2 contingency table from the actual responses. The card shows three statistics: <strong>Odds ratio</strong> 0.27, <strong>Relative risk</strong> 0.36 and <strong>95% CI</strong> 0.1543 to 0.4942, with the underlying cell counts shown beneath as a small "2×2 counts: a=21 b=147 c=45 d=87 (n=300)" line.</p>
<p><img src="/images/blog/help-calc-odds-ratio.png" alt="Odds Ratio widget showing odds ratio, relative risk and 95% CI" /></p>
<p>Reading it in plain English: the odds of a sick day among exercisers are about a quarter of the odds among non-exercisers, and the relative risk of 0.36 means exercisers were roughly a third as likely to take one (12.5% versus 34.1%). In a flyer test you would set the new version as the exposure and registration as the outcome, so an odds ratio above 1 with a confidence interval that stays above 1 favors the new design. Relative risk is usually the easier number to communicate, while the odds ratio is the standard for reporting.</p>
<p>A few honest limits of the widget:</p>
<ul>
<li>The confidence interval is fixed at 95%. For other levels, export the data and compute externally.</li>
<li>The card shows no p-value. Use the Fisher verdict on Compare Responses for significance on the same pair.</li>
<li>Only respondents who answered both questions are counted, and questions with more than two options are dichotomized as the chosen positive option versus everything else.</li>
<li>The widget only builds its table from responses in the survey. For cell counts from outside sources, or to try what-if counts, the free <a href="/pages/odds-ratio-calculator">Odds Ratio Calculator</a> accepts the four cells a, b, c and d directly and returns the same statistics.</li>
</ul>
<h2>What to watch out for</h2>
<p>The <strong>Comparison Chart</strong> widget can also put two groups side by side, defined by "Group A includes responses where" filters on another question, for example which flyer version the respondent received. It shows raw counts only, with no significance test, so treat it as a visual companion to Compare Responses rather than a verdict. And if you need anything beyond what the app computes, such as post-hoc power or intervals at other confidence levels, the workflow is always the same: collect with PaperSurvey, export from the Responses tab (Excel, CSV, SPSS, R, SAS, Stata), and finish the calculation in the free calculators or your stats package.</p>
<h2>Next steps</h2>
<ul>
<li>Understand the underlying test in <a href="/help/statistical-analysis/article/chi-square-tests-and-cross-tab-significance">Chi-Square, Cramér's V and P-Values</a></li>
<li>Plan fieldwork volumes with <a href="/help/statistical-analysis/article/how-many-survey-responses-do-you-need">How Many Survey Responses Do You Need?</a></li>
<li>Get your data out for deeper analysis with <a href="/help/exporting-data/article/exporting-survey-data">Exporting Survey Data</a></li>
<li>Size your next experiment with the <a href="/pages/ab-test-sample-size-calculator">A/B Test Sample Size Calculator</a> and sanity-check external tables with the <a href="/pages/odds-ratio-calculator">Odds Ratio Calculator</a></li>
</ul>]]>
            </summary>
                                    <updated>2026-08-06T14:13:09+00:00</updated>
        </entry>
            <entry>
            <title><![CDATA[How to Analyze Likert Scale Data: Means, Medians, Modes and Weighted Averages]]></title>
            <link rel="alternate" href="https://www.papersurvey.io/help/statistical-analysis/article/analyzing-likert-scale-data" />
            <id>https://www.papersurvey.io/129</id>
            <author>
                <name><![CDATA[PaperSurvey.io]]></name>
            </author>
            <summary type="html">
                <![CDATA[<p>A Likert battery packs several agreement statements into one grid question, and it raises the oldest debate in survey analysis: should you report the mean, the median or the mode of an ordinal scale? This article walks through the Staff Experience Survey 2027 sample, where 200 employees rated six aspects of their workplace on a Strongly Disagree to Strongly Agree scale and gave an overall job satisfaction rating from 1 to 5, and shows where each number lives in PaperSurvey, how the mean is really a weighted average, and where the free <a href="/pages/likert-scale-calculator">Likert Scale Calculator</a> picks up when you need top-box or net scores.</p>
<h2>Build the battery on the Setup tab</h2>
<p>On the <strong>Setup</strong> tab, a Likert battery is a single-choice grid question: your statements are the rows and the scale points (Strongly Disagree, Disagree, Neutral, Agree, Strongly Agree) are the columns. Each row is stored as its own child question, so analysis widgets can later select an individual statement from the grid on its own.</p>
<p>Every scale point also carries a numeric code, and all numeric statistics in PaperSurvey use these codes. To see or change them, open the question's actions menu and choose <strong>Recode values</strong>. The modal, titled "Recode values" followed by the question name, lists each option with its Numeric Code. Run your codes 1 to 5 rather than 0 to 4: the statistics footer on the Results tab excludes values of zero or below, so a Strongly Disagree coded 0 would silently vanish from the footer mean (the Descriptive Statistics widget, by contrast, does include zero and negative codes).</p>
<h2>Read the distribution on Analysis &gt; Results</h2>
<p>Open <strong>Analysis</strong>, then the <strong>Results</strong> sub-tab. The grid renders as one combined card, titled with the grid question's own name, in a diverging Likert view: disagreement percentages stretch left, agreement stretches right, and each row shows its own response count.</p>
<p><img src="/images/blog/help-calc-likert-battery.png" alt="Diverging Likert chart of the six-statement workplace battery" /></p>
<p>In the sample survey the six statements collected between 175 and 191 responses each, a reminder that every row has its own n. The card's chart-type selector can switch the grid between the diverging view, a 0-100% stacked view and standard bar views. There is also a <strong>Summary</strong> switch in the Results toolbar that combines every close-ended question with data into one survey-wide battery card with the same diverging and stacked modes.</p>
<p>One caveat: the combined battery views do not show a side table, so exact counts live in the hover tooltips there. To read counts and percentages per scale point directly, use a bar view. The overall satisfaction rating shows this best:</p>
<p><img src="/images/blog/help-calc-rating-scale.png" alt="Bar chart and side table for the 1 to 5 job satisfaction rating" /></p>
<p>The side table reads 1: 10 (5.4%), 2: 22 (11.8%), 3: 46 (24.7%), 4: 68 (36.6%), 5: 40 (21.5%), with a footer of Total 186, No response 14, Invalid 0, Mean 3.57, Std Dev 1.11, Median 4.00. Those five counts per scale point are exactly the input the <a href="/pages/likert-scale-calculator">Likert Scale Calculator</a> asks for.</p>
<p>To keep the whole battery visible on a dashboard, open an analysis view, click <strong>Edit</strong>, then <strong>Add</strong>, and pick <strong>Response Distribution</strong> from the Charts category of the Add blocks drawer. It displays several Likert questions or grid rows together and becomes available once the survey has at least two close-ended questions (a whole grid counts as one).</p>
<h2>Mean, median and mode: the ordinal debate</h2>
<p>Statisticians who treat Likert data as strictly ordinal prefer the median and mode; pragmatists report the mean because it is sensitive to every response. PaperSurvey shows all three. In any analysis view, click <strong>Edit</strong>, then <strong>Add</strong>, open the Advanced stats category and add a <strong>Descriptive Statistics</strong> block. A freshly added widget displays its full statistics catalog, including Mean, Median and Mode, and you untick anything you do not need in the <strong>Statistics to show</strong> checkboxes. When the data is multi-modal, the Mode row lists every tied value separated by commas.</p>
<p>Here is the widget on the same survey's 0 to 10 recommendation question:</p>
<p><img src="/images/blog/help-calc-outliers-skew.png" alt="Descriptive Statistics widget showing mean, median and mode disagreeing" /></p>
<p>Mean 7.53, Median 8, Mode 9. The three disagree because the distribution is left-skewed (Skewness -1.26): a tail of low scores drags the mean below the median, which sits below the most common answer. Reporting only the mean would understate how the typical employee actually answered, which is precisely the ordinal-data argument. For a quick check on raw values, for example a column pasted from an export, the free <a href="/pages/mean-median-mode-calculator">Mean, Median and Mode Calculator</a> computes the same three statistics.</p>
<h2>The mean of a scale question is a weighted average</h2>
<p>The footer Mean of 3.57 on the satisfaction rating is not magic. It is each scale point's numeric code weighted by its response count:</p>
<p>(1 × 10 + 2 × 22 + 3 × 46 + 4 × 68 + 5 × 40) / 186 = 664 / 186 = 3.57</p>
<p>You can replicate this in the free <a href="/pages/weighted-average-calculator">Weighted Average Calculator</a> by entering the codes as values and the counts as weights, which is also the way to answer what-if questions like "what would the mean be if the Neutral group split evenly?". The Likert Scale Calculator does the same average from counts, with one assumption to keep in mind: it treats the scale points as consecutive values 1 to k, so it matches PaperSurvey exactly only when your recode codes really are 1, 2, 3, 4, 5.</p>
<h2>Top-box, top-2-box and net scores</h2>
<p>PaperSurvey does not compute top-box, top-2-box or net scores for a battery. The workflow is to read the per-point counts from the side table into the <a href="/pages/likert-scale-calculator">Likert Scale Calculator</a>, which returns the average score, the top-box percentage and the net score in one go. For the satisfaction question, the top-2-box is (68 + 40) / 186 = 58.1% and the net score (top two boxes minus bottom two) is about +41.</p>
<p>For a single question there is an in-app shortcut: the CSAT widget counts responses at or above a threshold, which is exactly a threshold-based top-box. On the sample data it lands on the same figure:</p>
<p><img src="/images/blog/help-calc-csat-widget.png" alt="CSAT widget showing the 4+ top-box percentage" /></p>
<p>58.1%, from 108 of 186 respondents scoring 4 or higher. Because grid rows are selectable individually, you can point a CSAT widget at one battery statement, but scoring all six statements at once is calculator or spreadsheet territory.</p>
<h2>Going further with exports</h2>
<p>For anything beyond these summaries, such as nonparametric tests across groups, export the raw data from the <strong>Responses</strong> tab with the <strong>Export</strong> button. The File type dropdown offers Excel, CSV, SPSS, R, SAS, Stata and Presentation formats. The SPSS file carries the numeric codes with value labels attached, and the Cell Values option "Actual Answer" writes the option labels themselves (for example Strongly Agree) into spreadsheet cells.</p>
<p><img src="/images/blog/help-calc-export.png" alt="Export Data modal with the file type dropdown open" /></p>
<p>One more limit to know: multiple-choice questions have no single numeric code per respondent, so they are excluded from the numeric statistics widgets. Likert analysis in PaperSurvey applies to single-choice questions, rating scales and single-choice grid rows.</p>
<h2>Next steps</h2>
<ul>
<li><a href="/help/statistical-analysis/article/descriptive-statistics-for-survey-data">Descriptive Statistics for Survey Data</a> covers spread, standard error and the special means in the same widget.</li>
<li><a href="/help/analysis-reports/article/creating-an-analysis-dashboard">Creating an Analysis Dashboard</a> shows how to arrange Response Distribution and Descriptive Statistics blocks into a shareable view.</li>
<li><a href="/help/exporting-data/article/exporting-survey-data">Exporting Survey Data</a> explains the SPSS, R and Excel export formats in detail.</li>
<li>Try the free <a href="/pages/likert-scale-calculator">Likert Scale Calculator</a> and <a href="/pages/weighted-average-calculator">Weighted Average Calculator</a> with your own counts.</li>
</ul>]]>
            </summary>
                                    <updated>2026-07-22T12:00:00+00:00</updated>
        </entry>
            <entry>
            <title><![CDATA[Grading Paper Tests Automatically: Scores, Weighted Points and Pass Rates]]></title>
            <link rel="alternate" href="https://www.papersurvey.io/help/statistical-analysis/article/automatic-test-grading-and-pass-rates" />
            <id>https://www.papersurvey.io/130</id>
            <author>
                <name><![CDATA[PaperSurvey.io]]></name>
            </author>
            <summary type="html">
                <![CDATA[<p>Marking a stack of paper tests by hand is slow, and tallying pass rates afterwards is where the arithmetic mistakes creep in. With grading enabled, PaperSurvey scores every scanned or web response against your answer key the moment it is processed, then reports the class average, median, high, low and pass rate for you. This article walks through the Customer Service Training Assessment sample survey, a 12-question test taken by 250 staff, and shows exactly how the app computes what our free <a href="/pages/grade-calculator">Grade Calculator</a> and <a href="/pages/pass-rate-calculator">Pass Rate Calculator</a> do for scores you type in yourself.</p>
<h2>The scenario</h2>
<p>A training team assessed 250 employees after a customer service course. The test has 12 single-choice questions worth 14 points in total: ten routine knowledge questions carry 1 point each and two harder scenario questions carry 2 points each. Anyone scoring at least 70% of the maximum passes. The team wants each person's score, the overall pass rate and a view of which questions caused the failures, without marking a single sheet by hand.</p>
<h2>Step 1: Turn on grading in Settings</h2>
<ol>
<li>Open your survey and go to <strong>Settings</strong>, then pick <strong>Grading</strong> in the side navigation.</li>
<li>Switch on <strong>Activate test grading</strong>.</li>
<li>A <strong>Pass threshold</strong> field appears with a % suffix. Enter 70. The threshold is optional: leave it empty and you still get scores, just no pass or fail verdicts.</li>
</ol>
<h2>Step 2: Build the answer key, points are your weights</h2>
<p>Answer keys live on the <strong>Setup</strong> tab. Open a question's tools menu (the wrench icon next to the question) and choose <strong>Answer Key</strong>.</p>
<p><img src="/images/blog/help-calc-answer-key.png" alt="Answer Key modal with correct answers ticked and the Points field" /></p>
<p>In the modal you tick the correct option under <strong>Correct answers</strong> and set <strong>Points</strong>, the question's weight. This is where the weighting happens: our scenario questions get 2 points, the routine ones get 1, so the maximum possible score becomes 14. There is also an <strong>Incorrect answers</strong> section where you can attach a deduction to specific wrong options. Three rules worth knowing:</p>
<ul>
<li>Deductions only apply to options you explicitly tick as incorrect. A wrong answer you did not list simply scores 0.</li>
<li>There is no partial credit on multiple-choice questions, a response either earns the full points or it does not.</li>
<li>Changing a key later is safe: the modal warns you that scores for all existing responses will be recalculated, and they are.</li>
</ul>
<p>Once a key is saved, the question shows a green graduation-cap badge on the Setup tab with the point value, and hovering it confirms the weight. Answer keys are available on choice questions and on the rows of single-choice and multiple-choice grids (each grid row has its own tools menu and key). Range, NPS, Number and open text questions cannot be graded, and neither can yes/no grid rows.</p>
<p>The Answer Key modal also has a mode toggle at the top. Everything above describes <strong>Right / wrong answers</strong>. For a standardized assessment scale, where every answer is valid but worth a different number of points and the total maps to a severity band, switch to <strong>Points per answer</strong> instead. See <a href="/help/statistical-analysis/article/scoring-assessment-scales-with-severity-bands">Scoring Assessment Scales with Points and Severity Bands</a>.</p>
<h2>What every respondent gets</h2>
<p>As each sheet is scanned and processed, or each web form submitted, the entry's total score is computed as the sum of points from correctly answered questions, minus any deductions. On the <strong>Responses</strong> tab a <strong>Score</strong> column shows the raw score (the bare number, for example 10), and because we set a threshold, a green or red <strong>Pass/Fail</strong> column appears next to it. Web respondents see their result on the thank-you screen as "Your score: 10 / 14 - Pass".</p>
<p>The pass rule is exactly the one the <a href="/pages/pass-rate-calculator">Pass Rate Calculator</a> applies to pasted scores: pass when score &gt;= maximum × threshold / 100. Here that is 14 × 70 / 100 = 9.8, so 10 points passes and 9 fails.</p>
<h2>The class at a glance: the Test Results card</h2>
<p>Open <strong>Analysis</strong>, then the <strong>Results</strong> tab. Once grading is on and at least one response has been processed, a <strong>Test Results</strong> card appears at the top with an <strong>Overview</strong> view.</p>
<p><img src="/images/blog/help-calc-quiz-overview.png" alt="Test Results overview with average score, pass and fail counts and frequently missed questions" /></p>
<p>For our 250 test-takers the Overview shows Average Score 70% in green, Median 10.0, High 14.0, Low 0.0, Max Possible 14, Respondents 250, and the verdicts: <strong>Passed 146 (58.4%)</strong> and Failed 104. That 58.4% is the pass rate, computed as 146 passing scores out of 250, the same division the calculator does. Below the statistics, the <strong>Frequently Missed Questions</strong> list ranks the five hardest items; here the top offender is "Which behaviour builds the most long-term loyalty?" with only 45.6% answering correctly, which tells the trainers exactly which module to revisit.</p>
<h2>See where the pass line falls</h2>
<p>Switch the card to the <strong>Score Distribution</strong> view for a histogram of total scores.</p>
<p><img src="/images/blog/help-calc-score-distribution.png" alt="Score distribution histogram with the pass threshold marked" /></p>
<p>The header repeats Average 70%, Mean 9.9, Median 10.0, High 14.0, Low 0.0, Std Dev 3.15 and Respondents 250. Bars below a score of 10 are red and bars from 10 to 14 are green, split by a marked pass threshold at 9.8 points (70% of 14). A big red cluster just under the line is a signal worth acting on: those people missed passing by one or two points, so a short refresher may convert most of them. The card also offers <strong>Item Difficulty</strong> and <strong>Score Over Time</strong> views, covered in detail in <a href="/help/analysis-reports/article/quiz-analysis-charts">Test and Exam Analysis Charts</a>.</p>
<h2>How this maps to the free calculators</h2>
<ul>
<li>The <a href="/pages/grade-calculator">Grade Calculator</a> turns one score into a percentage, points ÷ total × 100. PaperSurvey does the same per respondent: someone with 10 of 14 points sits at 71.4%, and the card's Average Score is the class-wide version of that percentage.</li>
<li>The <a href="/pages/pass-rate-calculator">Pass Rate Calculator</a> applies score &gt;= max × threshold% to a pasted list of scores. The app applies the identical rule automatically to every processed entry, which is where Passed 146 (58.4%) comes from.</li>
<li>The <a href="/pages/weighted-grade-calculator">Weighted Grade Calculator</a> works differently: it averages separately graded components (say, coursework 40% and exam 60%) from their percentage scores. PaperSurvey does not average component percentages; it weights whole questions through their Points. To make a section count more, give its questions more points, like our 2-point scenario questions. If you need a true component-weighted grade across several tests, export the scores and combine them in that calculator or a spreadsheet.</li>
</ul>
<h2>Export the scores</h2>
<p>On the <strong>Responses</strong> tab, click <strong>Export</strong> to download the graded data as Excel, CSV, SPSS, R, SAS, Stata or a Presentation. The export includes a <strong>Total Score</strong> column, plus a <strong>Pass/Fail</strong> column whenever a threshold is set. For per-question marks, set <strong>Cell Values</strong> to <strong>Quiz points</strong> (this option appears only on graded surveys): correctly answered cells then show the points earned, while wrong answers still show the option label picked.</p>
<p><img src="/images/blog/help-calc-export.png" alt="Export Data modal with the File type dropdown open, shown here on the Employee Wellbeing sample survey" /></p>
<p>One subtlety if your test uses conditional logic: exports compute Pass/Fail against the survey-level maximum (all graded questions), while the Responses tab, thank-you screen and API use a per-respondent maximum that excludes questions hidden from that person by conditions. On a test with no conditional questions, like this one, the two are identical.</p>
<h2>Next steps</h2>
<ul>
<li><a href="/help/analysis-reports/article/quiz-analysis-charts">Test and Exam Analysis Charts</a> for Item Difficulty, discrimination and correct-answer highlighting.</li>
<li><a href="/help/exporting-data/article/exporting-survey-data">Exporting Survey Data</a> for the full export options.</li>
<li>Check a single result with the <a href="/pages/grade-calculator">Grade Calculator</a>, or paste a score list into the <a href="/pages/pass-rate-calculator">Pass Rate Calculator</a> to replicate the card's pass rate.</li>
<li>Combine component grades outside the app with the <a href="/pages/weighted-grade-calculator">Weighted Grade Calculator</a>.</li>
</ul>]]>
            </summary>
                                    <updated>2026-07-29T11:25:41+00:00</updated>
        </entry>
            <entry>
            <title><![CDATA[Chi-Square, Cramér's V and P-Values: Testing Significance in Survey Cross-Tabs]]></title>
            <link rel="alternate" href="https://www.papersurvey.io/help/statistical-analysis/article/chi-square-tests-and-cross-tab-significance" />
            <id>https://www.papersurvey.io/131</id>
            <author>
                <name><![CDATA[PaperSurvey.io]]></name>
            </author>
            <summary type="html">
                <![CDATA[<p>A cross-tab answers the question "do these two answers move together?". In this walkthrough we use the Employee Wellbeing Study, a 300-respondent survey, to test whether shift workers think about quitting more often than their colleagues. PaperSurvey runs the chi-square test of independence for you and reports the p-value and effect size on every comparison card, so you rarely need to compute anything by hand. When you do have counts from outside the app, the free <a href="/pages/chi-square-calculator">Chi-Square Calculator</a> applies the identical math to a pasted table.</p>
<h2>Run the comparison</h2>
<ol>
<li>Open the survey and go to <strong>Analysis</strong>, then the <strong>Compare Responses</strong> tab.</li>
<li>Under <strong>How do responses differ based on:</strong> pick the grouping question. Here we choose "Which shift do you usually work?". The basis question must be close-ended or a rating/NPS scale; Number and open text questions cannot be compared here.</li>
<li>PaperSurvey automatically cross-tabulates every other eligible question against your choice and runs a chi-square test on each pair. Cards are sorted so significant, strong associations come first.</li>
</ol>
<p>In the default Simple mode the page translates the statistics into plain language. For our shift question the insight banner reads: "1 of 5 questions show a notable relationship with Which shift do you usually work?. The strongest association is with Are you considering leaving your job in the next 12 months?. 4 other questions showed no notable relationship."</p>
<p><img src="/images/blog/help-calc-compare-simple.png" alt="Compare Responses in Simple mode with the plain-language insight banner" /></p>
<p>Each card offers <strong>Side by side</strong>, <strong>Stacked</strong> and <strong>Proportions</strong> chart styles, and a <strong>Chart</strong>, <strong>Table</strong> or <strong>Both</strong> view. The page also reminds you that these comparisons are exploratory.</p>
<h2>Read the chi-square result in Advanced mode</h2>
<p>Switch the toggle in the top right from <strong>Simple</strong> to <strong>Advanced</strong> to see the full test statistics. The card for "Are you considering leaving your job in the next 12 months?" shows the side-by-side bars and the cross-tab table, with the stats line underneath:</p>
<p><img src="/images/blog/help-calc-chi-square.png" alt="Advanced cross-tab card with chi-square, p-value, Cramér&#039;s V and margin of error" /></p>
<p>The table counts tell the story before any statistic does. Only 21 of 165 morning-shift workers say Yes to leaving, against 18 of 85 on the evening shift and 24 of 50 on the night shift. Almost half the night shift is considering leaving. The stats line confirms this is not noise:</p>
<ul>
<li><strong>χ² = 30.5612, df = 4</strong>. The chi-square statistic measures how far the observed counts sit from what independence would predict. Degrees of freedom = (rows - 1) × (columns - 1), here (3 - 1) × (3 - 1) = 4.</li>
<li><strong>p = &lt; 0.0001, Sig.</strong> The probability of seeing a table this uneven if shift and leaving intention were unrelated. PaperSurvey flags significance at p &lt; 0.05 and displays very small values as "&lt; 0.0001".</li>
<li><strong>V = 0.2257 (Small)</strong>. Cramér's V is the effect size on a 0 to 1 scale. The strength labels are the same bands the free <a href="/pages/cramers-v-calculator">Cramér's V Calculator</a> uses: 0.1 is small, 0.3 medium, 0.5 large. So this is a real but modest association, worth acting on without overselling it.</li>
<li><strong>MoE ±5.7%</strong>. The margin of error for the percentages at this sample size, at 95% confidence.</li>
</ul>
<p>In Advanced mode with the <strong>Table</strong> or <strong>Both</strong> view you can also tick the <strong>z-scores</strong> checkbox to overlay adjusted standardized residuals on each cell, highlighting exactly which cells drive the result (values beyond ±1.96 are colored).</p>
<h2>What the p-value means, and multiple comparisons</h2>
<p>A p-value converts your test statistic into a probability. If you ever need to do that conversion yourself, for example from a χ² value and df quoted in a report, the <a href="/pages/p-value-calculator">P-Value Calculator</a> accepts a z, t, chi-square or F statistic and returns the same p the app computes.</p>
<p>One test at p &lt; 0.05 has a 5% false-positive risk, but Compare Responses runs one test per question. To protect you, when five or more comparisons are shown in Advanced mode a correction selector appears with <strong>No correction</strong>, <strong>Bonferroni (p &lt; X)</strong> and <strong>FDR (Benjamini-Hochberg)</strong> options, and Bonferroni is pre-selected by default. That means the significance threshold on this page is already tightened to 0.05 divided by the number of comparisons. Our leaving-intention result clears even that stricter bar comfortably.</p>
<h2>Small tables get Fisher's exact test</h2>
<p>Chi-square is an approximation that weakens on small tables. Whenever both questions have exactly two answer options, PaperSurvey additionally runs Fisher's exact test (two-tailed) and treats it as the primary verdict. Here is "Have you taken a sick day in the last month?" grouped by "Do you exercise at least twice a week?":</p>
<p><img src="/images/blog/help-calc-fisher-2x2.png" alt="2x2 cross-tab card with Fisher&#039;s exact test verdict" /></p>
<p>Of the 66 people who reported a sick day, only 21 (31.8%) are regular exercisers while 45 (68.2%) are not, even though exercisers make up 168 of the 300 respondents. The stats line reads "χ² = 20.0811 | df = 1 | p = &lt; 0.0001 | Sig. (Fisher) | Fisher p = &lt; 0.0001 | V = 0.2587 (Small) | MoE ±5.7%". The "Sig. (Fisher)" label tells you the verdict comes from the exact test, not the chi-square approximation. To run the same exact test on a 2x2 table you typed up from somewhere else, use the free <a href="/pages/fisher-exact-test-calculator">Fisher's Exact Test Calculator</a>; the chi-square calculator on its own does not fall back to Fisher.</p>
<p>A note on question types: multiple-choice answers are exploded per selected option, so the cross-tab grand total counts option combinations rather than respondents. For clean 2x2 Fisher tables, prefer single-choice Yes/No questions like the ones here.</p>
<h2>Show your work with the Workbook</h2>
<p>Every Advanced-mode card has a <strong>Workbook</strong> link that downloads an Excel file for that comparison. It contains the raw and numerically coded data, an Observed Frequencies sheet, an Expected Frequencies sheet, a Standardized Residuals sheet, and a step-by-step Chi-Square Calculation sheet that builds the (Observed - Expected)² / Expected contributions and computes the p-value with a live =CHISQ.DIST.RT formula, plus the Cramér's V and margin of error figures. It is exactly the working you would show a reviewer or a statistics teacher. In Simple mode the <strong>Download workbook</strong> link produces a lighter file with a Summary sheet and observed counts, without the calculation sheets, so download from Advanced mode when you need the full derivation.</p>
<h2>Built-in safeguards</h2>
<p>Two protections keep you from quoting a test that does not hold up:</p>
<ul>
<li><strong>Unreliable verdicts.</strong> When any expected cell count falls below 1, the card is marked "Unreliable" instead of Sig. or Not Sig., the χ² and p figures are dimmed and struck through, and a warning explains the problem. A softer warning appears when more than 20% of cells have expected counts below 5. This is the app telling you the chi-square approximation cannot be trusted for that pairing, not a bug.</li>
<li><strong>Exploratory framing.</strong> The page reminds you these are exploratory comparisons. Treat a surprising significant card as a hypothesis to confirm, not a final conclusion.</li>
</ul>
<h2>Dashboards and external data</h2>
<p>The same test is available as the <strong>Cross-Tab</strong> block in Analysis views, so you can pin a key comparison to a dashboard, and it works on public shared views too. Note the widget always uses uncorrected p-values.</p>
<p>PaperSurvey has no standalone contingency-table input; the app always builds tables from your collected responses. For counts from other sources, or to double-check a result by hand, paste the table into the <a href="/pages/chi-square-calculator">Chi-Square Calculator</a>, <a href="/pages/fisher-exact-test-calculator">Fisher's Exact Test Calculator</a> or <a href="/pages/cramers-v-calculator">Cramér's V Calculator</a>. For deeper modelling, export your responses from the Responses tab to Excel, SPSS or R and continue in your stats software.</p>
<h2>Next steps</h2>
<ul>
<li><a href="/help/statistical-analysis/article/comparing-groups-with-t-tests-and-anova">Comparing group scores with t-tests and ANOVA</a></li>
<li><a href="/help/statistical-analysis/article/margin-of-error-and-confidence-intervals-for-survey-results">Margin of error and confidence intervals for survey results</a></li>
<li><a href="/help/analysis-reports/article/filtering-data-in-analysis">Filtering data in analysis</a></li>
<li><a href="/help/exporting-data/article/exporting-survey-data">Exporting survey data</a></li>
</ul>]]>
            </summary>
                                    <updated>2026-07-22T12:00:00+00:00</updated>
        </entry>
            <entry>
            <title><![CDATA[Comparing Group Scores: T-Tests, ANOVA and Effect Sizes in Survey Analysis]]></title>
            <link rel="alternate" href="https://www.papersurvey.io/help/statistical-analysis/article/comparing-groups-with-t-tests-and-anova" />
            <id>https://www.papersurvey.io/132</id>
            <author>
                <name><![CDATA[PaperSurvey.io]]></name>
            </author>
            <summary type="html">
                <![CDATA[<p>If you have tried our free <a href="/pages/t-test-calculator">T-Test Calculator</a> or <a href="/pages/anova-calculator">ANOVA Calculator</a>, you already know the mechanics: paste two or more groups of numbers, get a test statistic and a p-value. PaperSurvey runs the same tests directly on your collected responses, so you never have to copy numbers out by hand. This walkthrough uses the Employee Wellbeing Study demo survey, where 300 employees answered questions about sleep, energy, exercise and shift patterns.</p>
<h2>Two groups: the Welch t-test</h2>
<p>The wellbeing team wants to know whether people who exercise report different energy levels than people who do not. That is a numeric question (energy, rated 1 to 10) split by a two-option question (exercise, Yes/No), which is exactly what a two-sample t-test is for.</p>
<ol>
<li>Open the survey and go to <strong>Analysis</strong>, then the <strong>Compare Responses</strong> tab.</li>
<li>Under "How do responses differ based on:" pick "How would you rate your energy level during a typical workday?".</li>
<li>Switch the toggle in the top right from <strong>Simple</strong> to <strong>Advanced</strong> to see the full test statistics.</li>
</ol>
<p>Each result card is titled with the other question in the pair. On the card for "Do you exercise at least twice a week?" the stats line reads: T-test | t = -3.1818 | df = 279.1 | p = 0.0016 | Sig. | d = 0.3742 (small), followed by each group's summary: No: mean=6.093, SD=1.7653, n=129 and Yes: mean=6.7702, SD=1.8448, n=161.</p>
<p><img src="/images/blog/help-calc-ttest.png" alt="Welch t-test on the Compare Responses card for exercise and energy" /></p>
<p>Exercisers average 6.77 on the energy scale against 6.09 for non-exercisers, and with p = 0.0016 that difference is very unlikely to be sampling noise. PaperSurvey uses Welch's t-test, which does not assume the two groups have equal variances, so the degrees of freedom come out fractional (279.1 here). The <a href="/pages/t-test-calculator">T-Test Calculator</a> uses the identical Welch method on pasted values, which makes it a handy cross-check or a way to test numbers that never went through a survey.</p>
<h2>Effect size: Cohen's d</h2>
<p>Significance tells you a difference exists, Cohen's d tells you whether it matters. The same stats line shows d = 0.3742 (small), computed with the pooled standard deviation, and its tooltip spells out the conventional bands: 0.2 = small, 0.5 = medium, 0.8 = large. A 0.37 effect is real but modest, worth acting on only if exercise programs are cheap.</p>
<p>Cohen's d appears on the Compare Responses card and in the Cross-Tab dashboard widget. The downloadable comparison workbook's Group Comparison sheet lists each group's n, mean and standard deviation plus the t statistic, df and p, but not d. If you need the effect size outside the app, the free <a href="/pages/cohens-d-calculator">Cohen's d Calculator</a> computes it with the same pooled-SD formula from two pasted groups of raw values, so export the responses and paste each group's values in.</p>
<h2>Three or more groups: ANOVA runs automatically</h2>
<p>Shift work is the team's second question, and "Which shift do you usually work?" has three options: Morning, Evening and Night. You do not need to do anything different. When the grouping question has three or more groups, the same Compare Responses card switches from a t-test to a one-way ANOVA.</p>
<p><img src="/images/blog/help-calc-anova.png" alt="ANOVA with Bonferroni pairwise comparisons for energy by shift" /></p>
<p>The card for the shift question shows ANOVA F = 12.7144, df = 2, 287, p &lt; 0.0001, Sig., with the group means underneath: Morning 6.8375 (SD 1.78, n=160), Evening 6.3951 (SD 1.7079, n=81) and Night 5.3878 (SD 1.8236, n=49). The ANOVA only says "at least one shift differs", so PaperSurvey adds a "Pairwise comparisons (Bonferroni corrected)" table that pins down which pairs differ:</p>
<ul>
<li>Morning vs Night: mean difference 1.4497, p &lt; 0.0001, Sig.</li>
<li>Evening vs Night: mean difference 1.0073, p 0.0069, Sig.</li>
<li>Morning vs Evening: mean difference 0.4424, p 0.1887, not significant.</li>
</ul>
<p>Night shift is the problem, not a Morning versus Evening gap. The Bonferroni correction inflates each pairwise p-value to account for running three tests at once, which protects you from the false positives that uncorrected repeated testing produces. Two honest limitations are visible on this card too. A yellow note explains that the chi-square test is unreliable for this pairing because expected cell counts fall below 1, which is precisely why the ANOVA line is the verdict to read. And no per-pair Cohen's d is shown in ANOVA mode, so if you need one, export the responses and paste the two groups' raw values into the <a href="/pages/cohens-d-calculator">Cohen's d Calculator</a>. The public <a href="/pages/anova-calculator">ANOVA Calculator</a> returns F, both degrees of freedom and p on pasted groups, but it has no post-hoc table, so the in-app Bonferroni comparisons go a step further than the free tool.</p>
<h2>Against a benchmark: the one-sample t-test widget</h2>
<p>Sometimes the comparison is not between groups but against a target. The team wants to know whether work-life balance, rated 1 to 10, sits meaningfully above 5, the score they treat as neutral.</p>
<ol>
<li>Open an analysis view under <strong>Analysis</strong> (or use the auto-built Statistical Deep-Dive view, which already places a one-sample t-test for the survey's headline metric).</li>
<li>Click <strong>Edit</strong>, then <strong>Add</strong>, and pick <strong>One-sample t-test</strong> from the Advanced stats category.</li>
<li>Choose the question, then open the inspector's <strong>Advanced</strong> panel and set "Test against mean" to 5. If you leave it blank it defaults to the scale midpoint, so set it explicitly when your benchmark is anything else.</li>
</ol>
<p><img src="/images/blog/help-calc-one-sample-ttest.png" alt="One-sample t-test widget testing work-life balance against 5" /></p>
<p>The card shows Sample mean 6.244, t 11.221 and p-value &lt; 0.001, with the footer "Tested against 5 • n = 278 • df = 277". Balance is convincingly above neutral. The widget displays t, df, p and the sample mean; it does not show a standard error. To cross-check the result, the <a href="/pages/one-sample-t-test-calculator">One-Sample T-Test Calculator</a> accepts the raw values plus a hypothesised mean and returns the same t, df, p and sample mean. You can also create this widget straight from a numeric chart on the Results tab: open the chart's "..." menu (its tooltip says Actions) and pick One-sample t-test under "Analyze as".</p>
<h2>Same people, two measures: the paired t-test</h2>
<p>The paired t-test compares two numeric questions answered by the same respondents, matching answers person by person. Its classic use is a before and after measurement, and PaperSurvey's Before/After Table question supports that directly: on its Results card, the "..." menu's "Save to View" group offers a "Paired t-test" entry per statement whenever the table has five or fewer statements. The widget is also pre-configured with a detected before/after pair when your question labels contain matching before and after wording.</p>
<p>The wellbeing study has no repeat measurement, so as a demonstration the team paired the sleep-hours and energy questions, which run on similar numeric ranges, using the widget's "Before / condition A" and "After / condition B" pickers from the same <strong>Add</strong> library.</p>
<p><img src="/images/blog/help-calc-paired-ttest.png" alt="Paired t-test widget comparing sleep hours with energy ratings" /></p>
<p>The card reports Mean difference 0.608, t 7.783, p-value &lt; 0.001 and "n = 281 pairs • df = 280". Note the n: only the 281 respondents who answered both questions count as pairs, out of 300 total. Pairing is always by respondent within one survey, so you cannot pair a January survey against a June survey; put both measurements in the same survey (a Before/After Table is the cleanest way) if you plan a paired analysis. The <a href="/pages/paired-t-test-calculator">Paired T-Test Calculator</a> runs the same test on two pasted columns when your paired data lives outside PaperSurvey.</p>
<h2>What the app does not compute, and the export route</h2>
<p>A few things deliberately stay outside the app. Groups on Compare Responses always come from the option labels of a question, so if you need custom segments (for example "Night shift AND no exercise" versus everyone else), the Comparison Chart widget can chart two filter-defined groups but shows counts only, with no significance test. The paired t-test card shows no effect size. And there is no repeated-measures or two-way ANOVA.</p>
<p>For all of those, the workflow is: collect with PaperSurvey, export, then compute. Open the <strong>Responses</strong> tab, click <strong>Export</strong> and pick a file type. Excel works for the free calculators, while the SPSS and R exports carry numeric codes and value labels ready for <code>t.test()</code>, <code>aov()</code> or their SPSS equivalents.</p>
<p><img src="/images/blog/help-calc-export.png" alt="Export Data modal with Excel, SPSS and R file types" /></p>
<h2>Next steps</h2>
<ul>
<li><a href="/help/statistical-analysis/article/chi-square-tests-and-cross-tab-significance">Chi-Square, Cramér's V and P-Values: Testing Significance in Survey Cross-Tabs</a></li>
<li><a href="/help/statistical-analysis/article/descriptive-statistics-for-survey-data">Descriptive Statistics for Survey Data</a></li>
<li><a href="/help/exporting-data/article/exporting-survey-data">Exporting Survey Data</a></li>
<li><a href="/pages/t-test-calculator">T-Test Calculator</a> and <a href="/pages/anova-calculator">ANOVA Calculator</a></li>
</ul>]]>
            </summary>
                                    <updated>2026-07-22T12:00:01+00:00</updated>
        </entry>
            <entry>
            <title><![CDATA[Correlation and Regression: Finding Relationships Between Survey Questions]]></title>
            <link rel="alternate" href="https://www.papersurvey.io/help/statistical-analysis/article/correlation-and-regression-in-survey-data" />
            <id>https://www.papersurvey.io/133</id>
            <author>
                <name><![CDATA[PaperSurvey.io]]></name>
            </author>
            <summary type="html">
                <![CDATA[<p>Most survey questions are more interesting together than alone. Knowing the average energy rating and the average work-life balance rating tells you little on its own; knowing that the two move together tells you where to intervene. This article walks one real dataset, the Employee Wellbeing Study sample survey (300 respondents), through both tools PaperSurvey offers: the Correlation widget for Pearson and Spearman coefficients, and the regression line on Compare Responses. Along the way it maps each number to the free <a href="/pages/correlation-calculator">Correlation Calculator</a>, <a href="/pages/spearman-correlation-calculator">Spearman Correlation Calculator</a> and <a href="/pages/linear-regression-calculator">Linear Regression Calculator</a>.</p>
<h2>The scenario</h2>
<p>The study asked two 1-10 rating questions: "How would you rate your energy level during a typical workday?" and "How satisfied are you with your work-life balance?". The HR team suspects the two are linked. Correlation puts a single number on how strongly they move together, and regression fits a line that predicts one from the other. Neither proves that one causes the other, and the Compare Responses page carries an on-page note reminding you the results are exploratory. A strong link is a reason to investigate, not a verdict.</p>
<h2>Add the Correlation widget</h2>
<p>The Statistical Deep-Dive view, which PaperSurvey builds automatically, already places correlation blocks pairing your headline metric with likely driver questions. To add one anywhere:</p>
<ol>
<li>Open your survey, go to <strong>Analysis</strong> and open a view (or click <strong>+ New View</strong>).</li>
<li>Click <strong>Add</strong> to open the <strong>Add blocks</strong> drawer. This also switches the page into editor mode.</li>
<li>Under <strong>Advanced stats</strong>, pick <strong>Correlation</strong> ("Pearson and Spearman correlation between two numeric questions.").</li>
<li>In the inspector, choose the two questions under <strong>First variable</strong> and <strong>Second variable</strong>. Until both are set, the card says "Click Edit, select this block, and choose two numeric questions."</li>
</ol>
<p>Eligible questions are Number, Range, NPS, single-choice and single-choice grid rows (grid rows are offered individually). Choice questions correlate on each option's numeric recode value, the code you can edit per option, so make sure ordered options carry meaningful codes. Multiple-choice questions are not supported.</p>
<p><img src="/images/blog/help-calc-correlation.png" alt="Correlation widget for work-life balance vs energy level" /></p>
<p>For work-life balance vs energy level the card shows Pearson r 0.685, R² 0.469 and Spearman ρ 0.679, with the footer n = 278, Pearson p &lt; 0.001, Spearman p &lt; 0.001.</p>
<h2>Reading the three numbers</h2>
<ul>
<li><strong>Pearson r 0.685</strong> is a fairly strong positive linear relationship. People who report more energy also report better work-life balance. On a -1 to 1 scale, survey questions rarely exceed 0.7, so this is a headline finding.</li>
<li><strong>R² 0.469</strong> is r squared: about 47% of the variation in one answer is shared with the other. The remaining half is everything else, from workload to commute.</li>
<li><strong>Spearman ρ 0.679</strong> is the rank-based coefficient. It only assumes the relationship is consistently upward or downward, which makes it the safer choice for ordinal rating scales, skewed data or outliers. When Pearson and Spearman land this close together, the relationship is close to linear and either coefficient tells the same story.</li>
</ul>
<p>Both p-values below 0.001 mean a link this strong is extremely unlikely to appear by chance in 278 respondents.</p>
<p>The pairing happens per respondent automatically: only people who answered both questions are used, which is why n is 278 rather than 300. The widget needs at least three such respondents, otherwise it shows "Needs at least three respondents who answered both questions."</p>
<h2>Fit a line on Compare Responses</h2>
<p>Correlation says the two move together. Regression puts a slope on it. The <strong>Compare Responses</strong> tab inside <strong>Analysis</strong> runs a linear regression whenever the crossed pair are both numeric scales:</p>
<ol>
<li>Open <strong>Analysis</strong>, then the <strong>Compare Responses</strong> tab.</li>
<li>In <strong>How do responses differ based on:</strong> pick the energy level question as the basis.</li>
<li>Switch the toggle in the top right from <strong>Simple</strong> to <strong>Advanced</strong>. The statistics line only appears in Advanced mode.</li>
<li>Find the card titled "How satisfied are you with your work-life balance?". Because both questions are rating scales, the footer shows a regression instead of a group test.</li>
</ol>
<p><img src="/images/blog/help-calc-regression.png" alt="Regression footer on the Compare Responses card for work-life balance" /></p>
<p>The footer reads: Regression | R² = 0.4692 | slope = 0.6765 | p = &lt; 0.0001 | Sig. | n=278 | y = 0.6765x + 2.2036.</p>
<p>Note that the basis question here must be close-ended or a rating/NPS scale. Plain Number questions cannot be selected on Compare Responses even though they work in the Correlation widget, and single-choice grid rows are treated as ordered positions 1 to k on this page rather than their recode values.</p>
<h2>Interpreting slope, intercept and R²</h2>
<p>The equation y = 0.6765x + 2.2036 predicts work-life balance from energy. Each extra energy point is worth about 0.68 balance points on average. The intercept 2.2036 is the predicted balance at energy 0, which sits outside the 1-10 scale, so treat it as the line's anchor rather than a real prediction. Hovering the Regression label shows this interpretation spelled out in plain language.</p>
<p>The R² of 0.4692 matches the Correlation widget's 0.469, as it must: for a single predictor, regression R² is simply Pearson r squared (0.685² = 0.469). The p-value comes from an F-test on R² and the <strong>Sig.</strong> tag confirms the slope is statistically distinguishable from zero.</p>
<p>One thing this page does not compute is Spearman's ρ. The numeric-vs-numeric path on Compare Responses is Pearson-style linear regression only; for the rank-based view of the same pair, use the Correlation widget or the <a href="/pages/spearman-correlation-calculator">Spearman Correlation Calculator</a>.</p>
<h2>Cross-checking with the free calculators</h2>
<p>The public calculators run the same formulas on pasted X/Y pairs, which is handy for a subset you filtered by hand or data from outside PaperSurvey:</p>
<ul>
<li>The <a href="/pages/correlation-calculator">Correlation Calculator</a> returns r, R² and n. It does not report a p-value, which the in-app widget adds.</li>
<li>The <a href="/pages/linear-regression-calculator">Linear Regression Calculator</a> returns slope, intercept, R² and the same F-test p-value, so its output matches the Compare Responses footer digit for digit.</li>
</ul>
<h2>When you need more than a straight line</h2>
<p>Multiple regression with several predictors, partial correlations, confidence intervals around r, or diagnostics like residual plots are jobs for a stats package. The workflow is collect with PaperSurvey, then export: open the <strong>Responses</strong> tab, click <strong>Export</strong>, and choose Excel, CSV, SPSS, R, SAS, Stata or Presentation. The SPSS .sav file carries numeric codes with value labels, and the R export bundles the data with a ready-made import script, so both questions arrive analysis-ready for <code>lm()</code> or SPSS's regression menus.</p>
<p><img src="/images/blog/help-calc-export.png" alt="Export Data modal with the file type dropdown open" /></p>
<h2>Next steps</h2>
<ul>
<li><a href="/help/statistical-analysis/article/descriptive-statistics-for-survey-data">Descriptive statistics for survey data</a> to understand each variable before correlating them</li>
<li><a href="/help/analysis-reports/article/filtering-data-in-analysis">Filtering data in analysis</a> to run the same correlation for one department or time period</li>
<li><a href="/help/exporting-data/article/exporting-survey-data">Exporting survey data</a> for the Excel, SPSS and R workflow in detail</li>
<li><a href="/pages/linear-regression-calculator">Linear Regression Calculator</a> to try the slope and intercept math on your own pairs</li>
</ul>]]>
            </summary>
                                    <updated>2026-07-22T12:00:01+00:00</updated>
        </entry>
            <entry>
            <title><![CDATA[Descriptive Statistics for Survey Data: Standard Deviation, Variance and the Right Kind of Average]]></title>
            <link rel="alternate" href="https://www.papersurvey.io/help/statistical-analysis/article/descriptive-statistics-for-survey-data" />
            <id>https://www.papersurvey.io/134</id>
            <author>
                <name><![CDATA[PaperSurvey.io]]></name>
            </author>
            <summary type="html">
                <![CDATA[<p>A single average hides most of what your survey data has to say. Two teams can both average 7 hours of sleep while one clusters tightly around 7 and the other swings between 4 and 10. Descriptive statistics, the standard deviation, variance, standard error and their relatives, tell those two stories apart. This article walks through one real dataset, the Employee Wellbeing Study sample survey (300 respondents), and shows exactly where each number appears in PaperSurvey and how it maps to our free <a href="/pages/standard-deviation-calculator">Standard Deviation Calculator</a> and its siblings.</p>
<h2>The scenario</h2>
<p>An HR team asked "How many hours of sleep do you get on a typical work night?" as a Number question (2 digits). Of the 300 people who responded to the survey, 291 answered this question. The team wants to know not just the average, but how spread out the answers are and how much to trust the mean.</p>
<h2>Add the Descriptive Statistics widget</h2>
<p>The full breakdown lives in a single analysis widget. The Statistical Deep-Dive view is built for you automatically and already contains one, but you can add it to any view:</p>
<ol>
<li>Open your survey and go to <strong>Analysis</strong>, then open a view (or click <strong>+ New View</strong>).</li>
<li>Click <strong>Edit</strong>, then <strong>Add</strong> to open the <strong>Add blocks</strong> drawer.</li>
<li>Under <strong>Advanced stats</strong>, pick <strong>Descriptive Statistics</strong>.</li>
<li>In the inspector, choose the question under <strong>Questions</strong>. The widget accepts Number, Range, NPS, single-choice and single-choice grid questions (grid rows are offered individually).</li>
<li>Use the <strong>Statistics to show</strong> checkboxes to trim the list. Every statistic starts ticked, so untick the ones you do not need. At least one must stay selected. A per-widget <strong>Time range</strong> field is also available; the view's own filter bar handles response filters but has no date selector.</li>
</ol>
<p><img src="/images/blog/help-calc-descriptive-stats.png" alt="Descriptive statistics widget for the sleep question" /></p>
<p>For the sleep question the widget reports: Mean 7.04, Median 7, Mode 7, Std deviation 1.09, Variance 1.18, Std error 0.06, Coefficient of variation 15.42%, Minimum 5, Maximum 9, Range 4, Q1 6, Q3 8, IQR 2, Skewness 0.11, Kurtosis (excess) -0.68, Geometric mean 6.96, Harmonic mean 6.87 and 0 Tukey outliers, across 291 responses.</p>
<p>The numbers are always computed from the latest responses whenever the view loads or a filter changes, so the widget stays current without any manual refresh step.</p>
<h2>Spread: standard deviation and variance</h2>
<p>The two spread rows answer "how far do answers typically stray from the mean?". Here the standard deviation is 1.09 hours, and the variance is its square, 1.18. A typical respondent is within roughly an hour of the 7.04 average, which is a tight distribution.</p>
<p>PaperSurvey uses the sample formulas (dividing by n-1), which is the right default when your respondents are a sample of a larger population. There is no population toggle in the widget, and displayed values are rounded to at most two decimal places. If you need the population version, or more precision, paste the exported values into the <a href="/pages/standard-deviation-calculator">Standard Deviation Calculator</a>, which has a sample/population toggle, or the <a href="/pages/variance-calculator">Variance Calculator</a> for the squared form.</p>
<h2>Precision: standard error</h2>
<p>The Std error row (0.06 here) is the sample standard deviation divided by the square root of n, so 1.09 divided by the square root of 291. It answers a different question than the standard deviation: not "how spread out are people?" but "how precisely have we pinned down the mean?". With 291 answers, the true average sleep of this workforce is very likely within a fraction of an hour of 7.04.</p>
<p>This matches the default sample mode of the <a href="/pages/standard-error-calculator">Standard Error Calculator</a>. The widget does not compute confidence intervals, so when you need one, take the mean and standard error into the calculator or your stats package and build the interval there.</p>
<h2>Comparing variability across different scales</h2>
<p>Standard deviations from questions on different scales cannot be compared directly. The Coefficient of variation row rescales the spread as a percentage of the mean (sample SD divided by mean, times 100), so you can put two questions side by side.</p>
<p>Add a second Descriptive Statistics widget for another question and compare the CV rows. In the Staff Experience Survey sample, the 0-10 NPS question has a mean of 7.53 with a standard deviation of 2.33, a CV of 30.89%, about twice the relative variability of the sleep question's 15.42%. Staff agree far more about their sleep than about recommending the workplace.</p>
<p><img src="/images/blog/help-calc-outliers-skew.png" alt="Descriptive statistics for the staff NPS question, showing high CV, negative skew and 19 Tukey outliers" /></p>
<p>Treat CV as a rough guide on rating scales: it is only strictly meaningful for ratio data with a true zero, it becomes unstable when the mean is near zero, and the widget shows no result at all when the mean is exactly zero. The <a href="/pages/coefficient-of-variation-calculator">Coefficient of Variation Calculator</a> applies the same formula if you want to check a subset by hand. The same Descriptive Statistics widget on the NPS question also illustrates why you look past the mean: a skewness of -1.26 and 19 Tukey outliers flag a long tail of low scores that the 7.53 average smooths over.</p>
<h2>Special means for special data</h2>
<p>Two more rows cover cases where the arithmetic mean is the wrong kind of average:</p>
<ul>
<li><strong>Geometric mean</strong> (6.96 for the sleep question) is the right average for growth-like or ratio data. It only exists for strictly positive values, so if any response is zero or negative the row shows a placeholder instead of a number. The <a href="/pages/geometric-mean-calculator">Geometric Mean Calculator</a> follows the same positive-values-only rule.</li>
<li><strong>Harmonic mean</strong> (6.87) is the right average for rates. It shows no result if any response equals 0, though negative values are allowed. See the <a href="/pages/harmonic-mean-calculator">Harmonic Mean Calculator</a> for worked examples.</li>
</ul>
<p>Note the ordering: harmonic 6.87, geometric 6.96, arithmetic 7.04. The three always line up this way for positive data, and the gaps widen as the data gets more spread out. If your Number question needs fractional answers, turn on the <strong>Decimal</strong> switch in the question editor, which adds two decimal places, including two extra digit boxes on printed paper forms.</p>
<h2>Quick single-number tiles and the Results footer</h2>
<p>For dashboards that only need one headline number, the <strong>Add blocks</strong> drawer's <strong>Stats</strong> category has a <strong>Mean</strong> widget ("Average (mean) value across all numeric responses.") and a <strong>Standard Deviation</strong> widget ("How spread out responses are from the mean.").</p>
<p>The <strong>Results</strong> subtab under <strong>Analysis</strong> also prints a small footer under numeric charts with Mean, Std Dev and Median.</p>
<p><img src="/images/blog/help-calc-rating-scale.png" alt="Results card for a 1-5 rating question with the Mean, Std Dev and Median footer" /></p>
<p>The footer and the widget will not always agree exactly, by design. The footer's standard deviation is population-based and the footer excludes values of 0 or below, while the Descriptive Statistics widget uses sample statistics on all numeric answers. For the job satisfaction question above the footer reads Mean 3.57, Std Dev 1.11, Median 4.00 across 186 responses. When precision matters, trust the widget.</p>
<p>There is also a shortcut from any numeric chart on Results: open the chart's <strong>...</strong> menu (its tooltip is <strong>Actions</strong>) and pick <strong>Analyze as</strong> then <strong>Descriptive Stats</strong> to save a preconfigured widget into a view. The option appears once your survey has at least one analysis view, and with several views each entry becomes a submenu where you choose the destination.</p>
<h2>Choice questions and what the widget analyzes</h2>
<p>For single-choice questions and single-choice grid rows, the widget runs on each option's numeric recode value, the code you can edit per option. That makes descriptive statistics on a 1-5 agreement item meaningful, but check your recode values first if the options are not naturally ordered. Multiple-choice questions are not supported here.</p>
<h2>When you need more than the widget shows</h2>
<p>Population variance, confidence intervals at custom confidence levels, or any statistic beyond the 18 in the catalog follow the same workflow: collect with PaperSurvey, export, then compute. Open the <strong>Responses</strong> tab, click <strong>Export</strong>, and choose a file type: Excel, CSV, SPSS, R, SAS, Stata or Presentation. The SPSS .sav file carries numeric codes with value labels, and the R export bundles the data with a ready-made import script, so the columns land in your stats tool analysis-ready. From there, our free calculators or SPSS/R take over.</p>
<p><img src="/images/blog/help-calc-export.png" alt="Export Data modal with the file type dropdown open" /></p>
<h2>Next steps</h2>
<ul>
<li><a href="/help/analysis-reports/article/creating-an-analysis-dashboard">Creating an analysis dashboard</a> to arrange descriptive statistics widgets into a shareable view</li>
<li><a href="/help/analysis-reports/article/filtering-data-in-analysis">Filtering data in analysis</a> to compute the same statistics for one department or time period</li>
<li><a href="/help/exporting-data/article/exporting-survey-data">Exporting survey data</a> for the Excel, SPSS and R workflow in detail</li>
<li><a href="/pages/standard-deviation-calculator">Standard Deviation Calculator</a> to try the formulas on your own numbers</li>
</ul>]]>
            </summary>
                                    <updated>2026-07-22T12:00:01+00:00</updated>
        </entry>
            <entry>
            <title><![CDATA[Percentiles, Skewness and Outliers: Finding Unusual Answers in Your Survey Data]]></title>
            <link rel="alternate" href="https://www.papersurvey.io/help/statistical-analysis/article/finding-outliers-and-skewed-data-in-survey-results" />
            <id>https://www.papersurvey.io/135</id>
            <author>
                <name><![CDATA[PaperSurvey.io]]></name>
            </author>
            <summary type="html">
                <![CDATA[<p>An average can look perfectly healthy while hiding a tail of extreme answers. In the Staff Experience Survey sample, the NPS question averages 7.53 out of 10, a number most managers would happily report. But the same widget shows a skewness of -1.26 and 19 outliers, a pocket of very unhappy staff the mean smooths over. This article walks through the rows in PaperSurvey's Descriptive Statistics widget that reveal distribution shape, quartiles, skewness, kurtosis and the Tukey outlier count, and shows how they map to our free <a href="/pages/percentile-calculator">Percentile Calculator</a>, <a href="/pages/skewness-kurtosis-calculator">Skewness and Kurtosis Calculator</a> and <a href="/pages/outlier-calculator">Outlier Calculator</a>.</p>
<h2>Two real distributions, side by side</h2>
<p>We will compare two questions from the sample surveys:</p>
<ul>
<li>"How many hours of sleep do you get on a typical work night?", a Number question from the Employee Wellbeing Study (291 of 300 respondents answered)</li>
<li>"How likely are you to recommend this workplace to a friend or colleague?", the 0-10 NPS question from the Staff Experience Survey (188 responses)</li>
</ul>
<p>Both are read through the same widget. The Statistical Deep-Dive view is created for you automatically and already contains one, or you can add your own:</p>
<ol>
<li>Open your survey, go to <strong>Analysis</strong> and open a view (or click <strong>+ New View</strong>).</li>
<li>Click <strong>Edit</strong>, then <strong>Add</strong> to open the <strong>Add blocks</strong> drawer.</li>
<li>Under <strong>Advanced stats</strong>, pick <strong>Descriptive Statistics</strong> and choose the question in the inspector.</li>
</ol>
<p>A freshly added widget shows every statistic in the catalog, including all the shape rows below, so there is nothing extra to switch on. Use the <strong>Statistics to show</strong> checkboxes to untick anything you do not need. The widget recomputes whenever responses arrive or the view's filters change.</p>
<p><img src="/images/blog/help-calc-descriptive-stats.png" alt="Descriptive statistics widget for the sleep question" /></p>
<p>The sleep question is what a well-behaved distribution looks like: Mean 7.04 and Median 7 sit on top of each other, Skewness is 0.11, and Outliers (Tukey) reads 0.</p>
<h2>Quartiles: Q1, Q3 and the IQR</h2>
<p>The <strong>Q1 (25th percentile)</strong>, <strong>Median</strong>, <strong>Q3 (75th percentile)</strong> and <strong>IQR</strong> rows split your responses into quarters. For the sleep question, Q1 is 6 and Q3 is 8: half of all staff sleep between 6 and 8 hours, and the IQR of 2 measures that middle spread without being pulled around by extremes the way the standard deviation is.</p>
<p>PaperSurvey computes exactly these three percentiles, the 25th, 50th and 75th. No widget or chart can display an arbitrary percentile such as the 90th or 95th. When you need one, export the responses (see below) and use the <a href="/pages/percentile-calculator">Percentile Calculator</a> on the pasted values, or compute it in SPSS, R or Excel.</p>
<h2>Skewness and kurtosis: quantifying the tail</h2>
<p>Now the NPS question from the Staff Experience Survey:</p>
<p><img src="/images/blog/help-calc-outliers-skew.png" alt="Descriptive statistics for the staff NPS question, showing negative skew and 19 Tukey outliers" /></p>
<ul>
<li><strong>Skewness</strong> is -1.26. Negative skewness means a long tail on the low side. You can see the classic signature in the location rows too: Mean 7.53 is below Median 8, which is below Mode 9. Most staff answer 8 or 9, but a minority of very low scores drags the mean down.</li>
<li><strong>Kurtosis (excess)</strong> is 1.04. Positive excess kurtosis means the tails are heavier than a normal distribution's, so extreme answers are more common than the standard deviation alone suggests. The sleep question's -0.68, by contrast, describes a slightly flat distribution with almost no tail at all.</li>
</ul>
<p>Both statistics use the same Excel-style sample definitions as the <a href="/pages/skewness-kurtosis-calculator">Skewness and Kurtosis Calculator</a>, so pasting exported values into the calculator reproduces the widget's figures. As a rule of thumb, skewness beyond about plus or minus 1 means the mean alone is a misleading summary and you should report the median and quartiles alongside it.</p>
<h2>Counting outliers with Tukey fences</h2>
<p>The <strong>Outliers (Tukey)</strong> row counts answers that fall outside the standard Tukey fences: below Q1 - 1.5 x IQR or above Q3 + 1.5 x IQR. The count turns red whenever it is not zero, and the <a href="/pages/outlier-calculator">Outlier Calculator</a> applies the identical rule to pasted values.</p>
<p>The widget shows only the count, not the fence values or the flagged answers, but you can derive the fences from the rows on the card. For the NPS question, Q1 is 7 and IQR is 2, so the lower fence is 7 - 3 = 4 and the upper fence is 9 + 3 = 12. Anything below 4 is flagged, and 19 respondents scored 0 to 3. The upper fence sits above the scale maximum, so there are no high outliers.</p>
<p>This example also shows when bounded scales produce outliers. A 0-10 scale usually cannot exceed fences built from its own quartiles, and most Range or NPS questions will show 0 here. But when answers cluster as tightly as these do (half of all staff between 7 and 9), the fences land inside the scale and genuinely unusual answers get flagged. On open-ended Number questions, where a stray 70 can sit among answers of 7, the row is at its most useful. One small caveat: the count needs at least 4 responses, below that it simply shows 0.</p>
<h2>Inspecting the actual outliers</h2>
<p>To see who the 19 low scorers are, export the data rather than hunting in the app. The Responses list can filter a Number question only by an exact value, with no less-than or range option, so the fences are easier to apply in a spreadsheet:</p>
<ol>
<li>Open the <strong>Responses</strong> tab and click <strong>Export</strong>.</li>
<li>In the <strong>Export Data</strong> modal, pick a <strong>File type</strong>: Excel, CSV, SPSS, R, SAS, Stata or Presentation.</li>
<li>In Excel, sort or filter the question's column against your fences (here, values below 4).</li>
</ol>
<p><img src="/images/blog/help-calc-export.png" alt="Export Data modal with the file type dropdown open" /></p>
<p>For deeper work, the SPSS export is the cleanest route: the .sav file declares codes like "no response" as user-missing, so they cannot distort a mean, standard deviation or percentile computed downstream.</p>
<h2>Z-scores: standardizing individual answers</h2>
<p>A z-score expresses one answer as the number of standard deviations from the mean, which is another common way to define an outlier (beyond plus or minus 3, for instance). PaperSurvey never computes z-scores of respondent values, but it supplies both ingredients: the Mean and Std deviation rows of the widget, or the Mean and Std Dev footer under numeric charts on <strong>Results</strong>. Standardize after export with SPSS (DESCRIPTIVES with /SAVE), R (scale()) or a plain (x - mean) / SD formula in Excel, or check a single value with the <a href="/pages/z-score-calculator">Z-Score Calculator</a>.</p>
<p>One thing not to confuse: the <strong>z-scores</strong> checkbox on the Compare Responses tab (visible in Advanced mode when the Table or Both view is active) overlays adjusted standardized residuals on cross-tab cells. Those measure how far a cell deviates from independence between two questions, not how unusual an individual answer is.</p>
<h2>Before you trim anything</h2>
<p>An outlier flag is a prompt to investigate, not to delete. On a paper survey, first rule out a scanning or handwriting misread by opening the flagged entries and checking the scanned page. If the answers are real, they are often the most important responses in the dataset, the 19 staff scoring 0-3 are exactly the people a retention plan is for. If you do exclude values for a statistical reason, report it, and remember that medians, quartiles and the IQR barely move either way, which is why this widget leads with them.</p>
<h2>Next steps</h2>
<ul>
<li><a href="/help/statistical-analysis/article/descriptive-statistics-for-survey-data">Descriptive statistics for survey data</a> for the spread and precision rows on the same widget</li>
<li><a href="/help/analysis-reports/article/filtering-data-in-analysis">Filtering data in analysis</a> to recompute the shape statistics for one department or time period</li>
<li><a href="/help/exporting-data/article/exporting-survey-data">Exporting survey data</a> for the Excel, SPSS and R workflow in detail</li>
<li><a href="/pages/outlier-calculator">Outlier Calculator</a> to run the Tukey fence rule on your own numbers</li>
</ul>]]>
            </summary>
                                    <updated>2026-07-22T12:00:01+00:00</updated>
        </entry>
            <entry>
            <title><![CDATA[How Many Survey Responses Do You Need? Planning Sample Size, Print Runs and Response Rates]]></title>
            <link rel="alternate" href="https://www.papersurvey.io/help/statistical-analysis/article/how-many-survey-responses-do-you-need" />
            <id>https://www.papersurvey.io/136</id>
            <author>
                <name><![CDATA[PaperSurvey.io]]></name>
            </author>
            <summary type="html">
                <![CDATA[<p>The most common survey planning question is also the one people answer last: how many completed responses do you actually need? PaperSurvey now answers that in the app: every survey has a <strong>Response plan</strong> section on its <strong>Settings</strong> page that turns a population size, a confidence level and a target margin of error into a required number of completed responses. What the app still does not include is a statistical power planner or a minimum detectable effect, so that part of planning stays outside the app, in free calculators such as the <a href="/pages/sample-size-calculator">Sample Size Calculator</a> and the <a href="/pages/ab-test-sample-size-calculator">A/B Test Sample Size Calculator</a>. The app then gives you the raw counts you need to track fieldwork and judge how close you got. This article walks through one realistic scenario, planning a staff survey for a 1,000-person organisation, using the demo surveys and real figures from a PaperSurvey account.</p>
<h2>Start from the precision you need, not a round number</h2>
<p>Before any calculator, decide what decision the survey supports. If leadership will act when "considering leaving" moves by 10 points, a margin of error of ±5% is fine. If you need to detect a 3-point shift, you need a much larger sample. The margin of error you can live with is the single input that drives everything below.</p>
<h2>Step 1: Work out how many completed responses you need</h2>
<p>For questions reported as percentages (the share who exercise, the share considering leaving), open the survey's <strong>Settings</strong> page and fill in the <strong>Response plan</strong> section. For our scenario, a <strong>Population size</strong> of 1,000 employees, a <strong>Confidence level</strong> of 95% and a <strong>Target margin of error</strong> of ±5%, the plan returns 278 required completed responses. Leave <strong>Population size</strong> blank when the population is large or you do not know it, and the same 95% and ±5% return 385 instead.</p>
<p>The free <a href="/pages/sample-size-calculator">Sample Size Calculator</a> returns the same 278 from the same three inputs, because both run Cochran's formula with a finite population correction. Use the calculator to scope a survey you have not built yet, and the Response plan once the survey exists, because only the plan tracks progress against the target later. Either way, the number is completions, not printed forms. We will get to the print run in a moment.</p>
<p>The Response plan sizes a survey for a percentage, so a target built on an average still belongs in a calculator. If your headline metric is an average rather than a percentage, for example average hours of sleep, use the <a href="/pages/sample-size-mean-calculator">Sample Size Calculator for a Mean</a> instead. It asks for an <strong>Expected standard deviation</strong>, which you will not know before fielding. The honest way to get one is a small pilot. In the demo Employee Wellbeing Study, the Statistical Deep-Dive view's Descriptive Statistics widget reports the sleep question's <strong>Std deviation</strong> as 1.09 across 291 responses.</p>
<p><img src="/images/blog/help-calc-descriptive-stats.png" alt="Descriptive Statistics widget showing Std deviation 1.09 for the sleep question" /></p>
<p>Feeding 1.09 into the calculator with a desired margin of ±0.15 hours at 95% confidence gives roughly 203 completed responses. A wider margin of ±0.25 hours needs only about 74. This is why the standard deviation matters: noisy questions need bigger samples for the same precision.</p>
<h2>Step 2: Size the print run or invitation list</h2>
<p>The Response plan does this division for you, and the arithmetic is deliberately simple: divide required completions by the response rate you expect.</p>
<ol>
<li>The plan already holds the target from Step 1, in our scenario 278 completed responses.</li>
<li>Estimate a response rate from a previous wave and type it into <strong>Expected response rate</strong>. If your last staff survey achieved about 30%, enter 30%.</li>
<li>The plan divides 278 by 0.30, which is 927, and rounds up to a <strong>suggested print run</strong> shown as about 930. With a workforce of 1,000, the practical answer is to invite everyone and print a form for each person.</li>
</ol>
<p><strong>Expected response rate</strong> is optional and is used only to size the print run. Leave it out and you still get the required completions figure.</p>
<p>If a previous wave achieved a much higher rate, say 60%, printing 500 forms would be enough. Always round up, spoiled and undeliverable forms are part of fieldwork. The same suggested print run is prefilled as the copy count in the <strong>Create copies</strong> modal when you print, so you do not have to carry the number across by hand.</p>
<h2>Step 3: Track responses as they come in</h2>
<p>Once forms are out, PaperSurvey shows you raw counts in four places.</p>
<p>The surveys list shows a per-survey count of processed responses in the column headed with a people icon. Hover over the icon and the tooltip reads <strong>Responses collected</strong>. In the demo account the Employee Wellbeing Study shows 300 and the Customer Service Training Assessment shows 250.</p>
<p><img src="/images/blog/help-calc-responses-collected.png" alt="Surveys list showing responses collected per survey" /></p>
<p>For paper surveys printed with unique page marking, open <strong>Prints</strong> in the main navigation to reach the Generated Prints page. Each batch row shows a <strong>Copies Requested</strong> column and an <strong>Uploaded</strong> column in the form "X / Y", processed returns out of the copies in that batch. An info icon on the column header explains the counter. One caveat: if you reprint a batch reusing the same identifiers, the per-batch counter can over- or under-count, so treat the survey-level total as the reliable number. Surveys printed without unique page marking download as a single PDF and do not appear on this page.</p>
<p>Inside an analysis view you can also add a <strong>Total Responses</strong> widget, and, on surveys with web surveys enabled, separate <strong>Paper survey submissions</strong> and <strong>Web survey submissions</strong> widgets that split the count by channel. That split is exactly what you need for mixed-mode response rates.</p>
<p>The fourth place is where the plan turns into progress. Add a <strong>Response plan</strong> widget to an analysis view and it shows a progress bar, the responses collected so far against the target from Step 1, and the margin of error those responses actually deliver against the one you asked for. In the demo Employee Wellbeing Study, 300 responses against a target of 278 reads as met, and the achieved margin of error is ±4.7% against the ±5% you set.</p>
<p>The data-quality banner at the top of the <strong>Analysis</strong> tab repeats the same headline, so you do not have to open a view to see it, and while the survey is still short of the target it raises a <strong>Short of your response target</strong> note.</p>
<h2>Step 4: Compute your actual response rate</h2>
<p>PaperSurvey never computes a response rate percentage itself. The <strong>Expected response rate</strong> in the Response plan is not an exception: it is an estimate you type in to size a print run, not something the app has measured. The app never sees how many forms you handed out. It gives you the numerator, and you supply the denominator from your own distribution records. Take the numbers to the free <a href="/pages/response-rate-calculator">Response Rate Calculator</a>:</p>
<ol>
<li>Enter <strong>Responses received</strong>, the processed count from the surveys list or the Total Responses widget. For the Employee Wellbeing Study that is 300.</li>
<li>Enter <strong>People invited</strong>, the number of forms you distributed or web invitations you sent, in our scenario 1,000.</li>
<li>The calculator returns 30%, comfortably delivering the 278 completions we needed.</li>
</ol>
<p>One thing the app genuinely cannot see: web survey entries are only created when a respondent submits. Someone who opens the link and abandons leaves no trace, so the denominator for a web response rate must come from your invitation list, never from the app.</p>
<h2>Step 5: Check your completion rate</h2>
<p>Response rate tells you how many people took part. Completion rate tells you how many of those made it through the form. On the <strong>Analysis</strong> tab, open <strong>Results</strong> and compare the footers of an early question and a question near the end of the form. Each question card with responses shows <strong>TOTAL</strong>, <strong>NO RESPONSE</strong> and <strong>INVALID</strong> at the bottom. In the demo Staff Experience Survey 2027, which collected 200 responses, the overall job satisfaction card shows Total 186 and No response 14.</p>
<p><img src="/images/blog/help-calc-rating-scale.png" alt="Rating scale results card with Total 186 and No response 14 in the footer" /></p>
<p>Enter those figures into the <a href="/pages/completion-rate-calculator">Completion Rate Calculator</a>: <strong>Started the survey</strong> 200, <strong>Completed the survey</strong> 186, giving a 93% completion rate. Two practical notes:</p>
<ul>
<li>The per-question No response count includes people who simply skipped that item, so measure completion against a late question respondents would not legitimately skip. A "prefer not to say" salary question is a poor yardstick.</li>
<li>To inspect who the non-completers are, click the <strong>Total</strong> or <strong>No response</strong> label text under the chart (the label, not the number) to open the Responses list filtered to exactly those entries.</li>
</ul>
<h2>Verify the precision you actually achieved</h2>
<p>After fieldwork, check whether your final sample delivered the margin of error you planned for. The <strong>Response plan</strong> widget answers that for the survey as a whole: in the demo Employee Wellbeing Study it reports ±4.7% against the ±5% target. For the precision behind one specific comparison, open <strong>Compare Responses</strong> on the Analysis tab, switch the toggle in the top right to <strong>Advanced</strong>, and run a comparison. The stats footer of each result reports the achieved margin of error. In the demo Employee Wellbeing Study, comparing intention to leave by shift shows "MoE ±5.7%" based on the 300 collected responses at a 95% confidence level.</p>
<p><img src="/images/blog/help-calc-chi-square.png" alt="Cross-tab comparison with MoE ±5.7% in the stats footer" /></p>
<p>Two different margins on the same 300 responses is not a bug, and neither figure is wrong. The Response plan honours what you entered, a population of 1,000 and a 95% confidence level, and applies the finite population correction, which is what pulls it down to ±4.7%. The Compare Responses card does neither: its confidence level is fixed at 95% and it treats the population as effectively unlimited, so it reports the more conservative ±5.7%. Quote the plan figure when you report on the survey as a whole against the population you defined, and the Compare Responses figure when you are talking about one specific cross-tab.</p>
<p>The n behind the Compare Responses figure is the number of respondents who answered both questions in the comparison, which can be smaller than your full sample. Confidence level is now a survey setting, so the plan will size and report at 80, 85, 90, 95 or 99%, but three things stay outside the app: a sample size for an average, statistical power, and a minimum detectable effect. For those, and for any other planning arithmetic the app does not do, the workflow is the same throughout: collect with PaperSurvey, export from the Responses tab (Excel, CSV, SPSS, R, SAS, Stata), and compute in the free calculators or your stats package.</p>
<p><img src="/images/blog/help-calc-export.png" alt="Export Data modal with file type options" /></p>
<h2>Next steps</h2>
<ul>
<li>Set the target for the survey you are running now in <strong>Settings</strong> &gt; <strong>Response plan</strong>, then follow it in the Response plan widget</li>
<li>Understand what your margin of error really means in <a href="/help/statistical-analysis/article/margin-of-error-and-confidence-intervals-for-survey-results">Margin of Error and Confidence Intervals</a></li>
<li>Get pilot standard deviations from the widget covered in <a href="/help/statistical-analysis/article/descriptive-statistics-for-survey-data">Descriptive Statistics for Survey Data</a></li>
<li>Export your raw counts and data with <a href="/help/exporting-data/article/exporting-survey-data">Exporting Survey Data</a></li>
<li>Plan your next wave with the <a href="/pages/sample-size-calculator">Sample Size Calculator</a></li>
</ul>]]>
            </summary>
                                    <updated>2026-08-07T10:22:21+00:00</updated>
        </entry>
            <entry>
            <title><![CDATA[Item Analysis for Tests: Difficulty and Discrimination Index Explained]]></title>
            <link rel="alternate" href="https://www.papersurvey.io/help/statistical-analysis/article/item-analysis-difficulty-and-discrimination" />
            <id>https://www.papersurvey.io/137</id>
            <author>
                <name><![CDATA[PaperSurvey.io]]></name>
            </author>
            <summary type="html">
                <![CDATA[<p>After grading a stack of test papers, the next question is about the test itself: which questions were too easy, which were too hard, and which were simply broken? Item analysis answers this with two numbers per question. Difficulty is the percentage of takers who answered correctly, and discrimination measures whether a question separates strong performers from weak ones. PaperSurvey computes both automatically for every graded survey, and the free <a href="/pages/item-difficulty-calculator">Item Difficulty Calculator</a> and <a href="/pages/discrimination-index-calculator">Discrimination Index Calculator</a> apply the same formulas when you want to verify the math or analyze a test that was not run through PaperSurvey.</p>
<p>This article walks through a real example: the Customer Service Training Assessment demo survey, a graded quiz with 12 single-choice questions worth 14 points in total (two questions carry 2 points each), a 70% pass threshold, and 250 responses.</p>
<h2>Set up grading first</h2>
<p>Item analysis only appears for graded surveys, so the quiz needs two things before collecting responses:</p>
<ol>
<li>Open <strong>Settings</strong> and turn on <strong>Activate test grading</strong> in the Grading section. Optionally set a pass threshold, 70% in this example.</li>
<li>On the <strong>Setup</strong> tab, open each question's tools menu and choose <strong>Answer Key</strong>. Tick the correct option under "Correct answers" and set its Points value. You can also assign deduction points under "Incorrect answers" for negative marking.</li>
</ol>
<p><img src="/images/blog/help-calc-answer-key.png" alt="Answer Key modal with correct answers, points and the rescoring warning" /></p>
<p>Answer keys can be changed later. As the warning in the modal notes, updating a key recalculates the scores of all existing responses, 250 of them in this demo.</p>
<h2>Where item analysis lives</h2>
<p>Once responses are in, open <strong>Analysis</strong> and stay on the <strong>Results</strong> tab. A <strong>Test Results</strong> card sits at the top of the page with a view switch: <strong>Overview</strong>, <strong>Item Difficulty</strong>, <strong>Score Distribution</strong> and <strong>Score Over Time</strong>.</p>
<p><img src="/images/blog/help-calc-quiz-overview.png" alt="Test Results overview with summary statistics and frequently missed questions" /></p>
<p>The Overview already hints at where the problems are. For the demo assessment it shows an average score of 70%, a median of 10.0, a high of 14.0 and a low of 0.0 out of a maximum of 14, with 146 of 250 respondents passing (58.4%). Below the summary, the <strong>Frequently Missed Questions</strong> list shows the five questions with the lowest percentage correct. Here it is topped by "Which behaviour builds the most long-term loyalty?" at 45.6% correct.</p>
<h2>Reading item difficulty</h2>
<p>Switch the Test Results card to <strong>Item Difficulty</strong>. Every graded question gets a horizontal bar, sorted hardest first, and a side table with <strong>% Correct</strong>, <strong>Correct / Total</strong>, a <strong>Difficulty</strong> label and a <strong>Discrimination</strong> value.</p>
<p><img src="/images/blog/help-calc-item-difficulty.png" alt="Item Difficulty view with sorted bars and the difficulty and discrimination table" /></p>
<p>In the demo, the hardest question is the loyalty question at 45.6% correct (114 of 250), labelled Moderate. The easiest is "A customer is angry about a late delivery..." at 83.6% (209 of 250), labelled Easy.</p>
<p>The math is straightforward: correct answers divided by all quiz takers. A response counts as correct when it earned points, and respondents who skipped the question stay in the denominator, so a skipped question counts as incorrect. The difficulty bands are:</p>
<ul>
<li><strong>Easy (&gt;70%)</strong>, shown green</li>
<li><strong>Moderate (30-70%)</strong>, shown yellow</li>
<li><strong>Difficult (&lt;30%)</strong>, shown red</li>
</ul>
<p>These are exactly the bands the <a href="/pages/item-difficulty-calculator">Item Difficulty Calculator</a> uses. Enter 114 correct out of 250 students and it returns the same 45.6% with the same moderate rating.</p>
<h2>Reading the discrimination index</h2>
<p>Difficulty alone cannot tell a genuinely hard question from a broken one. That is what the <strong>Discrimination</strong> column is for. PaperSurvey uses the classic upper/lower 27% method: it sorts all respondents by total score, takes the top 27% and the bottom 27% (68 of the 250 takers in each group for this demo), and subtracts the share of the bottom group who answered the question correctly from the share of the top group. The result runs from -1 to +1 and is shown to two decimals with a label:</p>
<ul>
<li><strong>Good (&gt;0.3)</strong>: a strong differentiator</li>
<li><strong>Fair (0.15-0.3)</strong>: acceptable</li>
<li><strong>Poor (&lt;0.15)</strong>: the tooltip explains the question "does not differentiate well between high and low performers" and suggests revising it</li>
</ul>
<p>In the demo assessment every question scores between 0.41 and 0.66, all flagged Good. That combination is the healthy outcome: the loyalty question is hard (45.6% correct) but its discrimination of 0.41 shows that high scorers get it right far more often than low scorers, so it is difficult and fair. If a question ever lands near zero or negative, treat it as a red flag: the wording may be ambiguous, more than one option may be defensible, or the answer key may simply be wrong. Check the key first, then the question text.</p>
<h2>Small samples and filters</h2>
<p>Discrimination needs at least 4 respondents. With fewer than that, the Discrimination column does not appear on the table at all, only difficulty is shown. Both metrics also respect the current filters, so narrowing the responses by date or by an answer recomputes the whole table live. That makes it easy to compare item statistics between, say, two training cohorts.</p>
<h2>Item analysis on a dashboard</h2>
<p>The same table is available as a reusable block for analysis views:</p>
<ol>
<li>Open an analysis view (or create one with <strong>+ New View</strong>) and click <strong>Add</strong>.</li>
<li>In the <strong>Add blocks</strong> drawer, find <strong>Item Difficulty</strong> under the <strong>Quiz</strong> heading, described as "See which questions were easiest and hardest for respondents." The block requires grading to be enabled and honors the view's filters.</li>
</ol>
<p>You can also send it there from the Results tab directly: the three-dot icon on the Test Results card (hover tooltip "Save to view") opens a <strong>Save to View</strong> menu that includes Item Difficulty. The menu appears once the survey has at least one analysis view.</p>
<h2>Checking the math or analyzing an external test</h2>
<p>For tests graded outside PaperSurvey, the two free calculators do the identical arithmetic:</p>
<ul>
<li>The <a href="/pages/item-difficulty-calculator">Item Difficulty Calculator</a> takes the number of correct answers and the number of students and returns the percentage with the same easy, moderate and difficult bands.</li>
<li>The <a href="/pages/discrimination-index-calculator">Discrimination Index Calculator</a> takes each student's total score plus a matching 1-or-0 series marking whether they got the item right. The two series must be the same length, at least 4 students are required, and it applies the same upper/lower 27% split as the app.</li>
</ul>
<p>If you want the raw per-respondent data out of PaperSurvey to run this by hand, use the <strong>Export</strong> button on the Responses tab, which offers Excel, CSV, SPSS, R and more.</p>
<h2>Next steps</h2>
<ul>
<li><a href="/help/analysis-reports/article/quiz-analysis-charts">Test and Exam Analysis Charts</a> covers the Score Distribution and Score Over Time views of the same card.</li>
<li><a href="/help/statistical-analysis/article/automatic-test-grading-and-pass-rates">Grading Paper Tests Automatically: Scores, Weighted Points and Pass Rates</a> goes deeper on answer keys, weights and pass thresholds.</li>
<li><a href="/help/statistical-analysis/article/measuring-test-reliability-and-rater-agreement">Is Your Test Reliable? Cronbach's Alpha, KR-20, SEM and Inter-Rater Agreement</a> checks the instrument as a whole rather than single items.</li>
<li>Try the <a href="/pages/item-difficulty-calculator">Item Difficulty Calculator</a> and the <a href="/pages/discrimination-index-calculator">Discrimination Index Calculator</a> on your own numbers.</li>
</ul>]]>
            </summary>
                                    <updated>2026-07-22T12:00:01+00:00</updated>
        </entry>
            <entry>
            <title><![CDATA[Margin of Error and Confidence Intervals: How Precise Are Your Survey Results?]]></title>
            <link rel="alternate" href="https://www.papersurvey.io/help/statistical-analysis/article/margin-of-error-and-confidence-intervals-for-survey-results" />
            <id>https://www.papersurvey.io/138</id>
            <author>
                <name><![CDATA[PaperSurvey.io]]></name>
            </author>
            <summary type="html">
                <![CDATA[<p>Suppose 300 employees answered your wellbeing survey and 63% of them said they are not considering leaving their job. Is the true figure 63%, or could it plausibly be 57% or 69%? Margin of error and confidence intervals answer exactly that question. This article walks through where PaperSurvey shows a margin of error, what that figure assumes, and how to compute confidence intervals for any percentage or average in your results using the free <a href="/pages/margin-of-error-calculator">Margin of Error Calculator</a>, <a href="/pages/confidence-interval-calculator">Confidence Interval Calculator (Proportion)</a> and <a href="/pages/confidence-interval-mean-calculator">Confidence Interval Calculator (Mean)</a>.</p>
<h2>Where PaperSurvey shows margin of error</h2>
<p>Margin of error appears in three places in the app. Two of them are survey-wide and read off the <strong>Response plan</strong> you set in the survey's <strong>Settings</strong>: the <strong>Response plan</strong> widget on an analysis view, and the data-quality banner at the top of the <strong>Analysis</strong> tab. Both report the margin your collected responses actually deliver against the target you asked for. The third is per comparison: the Compare Responses page in Advanced mode, and the Excel workbook you can download from each comparison, which report the margin for one pair of questions.</p>
<p>To reach the per-comparison figure:</p>
<ol>
<li>Open your survey and go to <strong>Analysis</strong>, then the <strong>Compare Responses</strong> tab.</li>
<li>Pick a question under "How do responses differ based on:".</li>
<li>Switch the toggle in the top right from <strong>Simple</strong> to <strong>Advanced</strong>.</li>
</ol>
<p>Every comparison card that runs a chi-square test now shows a stats line with, at the end, "MoE ±x%". Cards that run a t-test, ANOVA or regression instead do not carry the figure. In the Employee Wellbeing Study, crossing "Are you considering leaving your job in the next 12 months?" with the shift question shows "MoE ±5.7%" next to the test results, because all 300 respondents answered both questions.</p>
<p><img src="/images/blog/help-calc-chi-square.png" alt="Compare Responses card in Advanced mode with the MoE figure in the stats line" /></p>
<p>Hover over the MoE figure and a tooltip explains it, for this card it reads "Based on 300 responses at 95% confidence level." The same number is written out in the downloadable workbook: click <strong>Workbook</strong> on the card (labelled <strong>Download workbook</strong> in Simple mode) and the crosstab.xlsx file lists "Margin of error (95% CI)" on both the Summary and the Chi-Square Calculation sheets. Note that the Cross-Tab dashboard widget does not display the MoE on the card itself, only its downloadable worksheet contains it, and the Results tab never shows a margin of error at all.</p>
<h2>What the Compare Responses figure assumes</h2>
<p>The margin of error on a Compare Responses card uses the standard worst-case formula: z multiplied by the square root of p(1-p)/n, with p fixed at 0.5 and z fixed at 1.96 for a 95% confidence level. Three things are worth knowing:</p>
<ul>
<li>The confidence level on this card is always 95%. There is no setting to change it here. The <strong>Confidence level</strong> in the <strong>Response plan</strong> section of survey <strong>Settings</strong> is where you pick 80, 85, 90, 95 or 99%, and it drives the survey-wide figures rather than this card.</li>
<li>The n is the number of entries that answered both questions in the pair, not your total respondent count. If either question allows multiple answers, each combination of selected options counts once, so n can even exceed the number of people.</li>
<li>This card applies no finite population correction, so the figure is conservative when you surveyed most of a small population. The Response plan does apply the correction once you enter a <strong>Population size</strong>, which is why the same survey can show two different margins. For the Employee Wellbeing Study's 300 responses out of a population of 1,000, the plan reports ±4.7% while this card reports ±5.7%. Neither is wrong, they answer different questions: the plan describes the survey against the population you defined, the card describes one cross-tab.</li>
</ul>
<p>The free <a href="/pages/margin-of-error-calculator">Margin of Error Calculator</a> uses the same worst-case p = 0.5 formula, and like the Response plan it lets you pick a confidence level and enter a population size for a finite population correction. Reach for it when you are scoping a survey that does not exist yet, or when you want a margin for an n that is neither your full sample nor a cross-tab pair. If you surveyed 300 out of 450 employees, the corrected margin is noticeably tighter than the ±5.7% on the card.</p>
<h2>Confidence interval for a percentage</h2>
<p>A margin of error built on p = 0.5 is a planning number. Once you have a real result, a confidence interval around the observed percentage is more precise, and PaperSurvey does not display one for a proportion or a mean anywhere in-app. The workflow is: read the two inputs off the Results tab, then compute the interval with the calculator.</p>
<p>Every question card on <strong>Analysis</strong> &gt; <strong>Results</strong> shows a side table with each option's count and percentage, and a footer with "Total", the number of distinct respondents who answered that question. Those are exactly the calculator inputs.</p>
<p><img src="/images/blog/help-calc-rating-scale.png" alt="Results card with the count and percentage side table and the Total footer" /></p>
<p>In the Staff Experience Survey, 68 of 186 respondents (36.6%) rated their overall job satisfaction 4 out of 5. Enter 36.6% and n = 186 into the <a href="/pages/confidence-interval-calculator">Confidence Interval Calculator (Proportion)</a> and you get roughly ±6.9 percentage points at 95% confidence, an interval of about 29.7% to 43.5%. You can do the same for any combination of options, for example the 108 of 186 respondents (58.1%) who chose 4 or 5.</p>
<p>Two things to keep in mind with choice questions:</p>
<ul>
<li>Each option is its own proportion over the same n, so compute a separate interval per option.</li>
<li>Multiple-choice percentages are calculated over answering respondents and can sum past 100%. That is fine, the per-option interval is still valid.</li>
</ul>
<h2>Confidence interval for a mean</h2>
<p>For averages you need three inputs: the mean, the standard deviation and n. The Descriptive Statistics widget shows all three. The auto-built Statistical Deep-Dive analysis view already includes Descriptive Statistics widgets, or you can add your own: open an analysis view, click <strong>Edit</strong>, then <strong>Add</strong>, and pick <strong>Descriptive Statistics</strong> from the <strong>Advanced stats</strong> category. A freshly added widget shows the full list of statistics, including <strong>Std error</strong>, and you can trim it with the "Statistics to show" checkboxes.</p>
<p><img src="/images/blog/help-calc-descriptive-stats.png" alt="Descriptive Statistics widget showing Mean, Std deviation and Std error" /></p>
<p>For the sleep question in the Employee Wellbeing Study the widget shows Mean 7.04, Std deviation 1.09 and Std error 0.06, with "291 Responses" in the footer. Enter mean 7.04, standard deviation 1.09 and n = 291 into the <a href="/pages/confidence-interval-mean-calculator">Confidence Interval Calculator (Mean)</a> and the 95% interval comes out at roughly 6.91 to 7.17 hours. The calculator also echoes the standard error it used, which you can cross-check against the widget's Std error row.</p>
<p>Prefer the widget over the chart footer for these inputs. The Results-tab footer Std Dev is a population standard deviation and the footer statistics exclude values of 0 or below, while the widget uses sample (n-1) statistics, which is what the calculator expects. Related: the One-sample t-test widget reports t, df, p and the sample mean against a target value, but it does not display an interval either.</p>
<h2>Going deeper in SPSS or R</h2>
<p>For exact intervals, subgroups or non-standard confidence levels, export the raw data. On the <strong>Responses</strong> tab click <strong>Export</strong> and pick <strong>SPSS</strong> or <strong>R</strong> from the <strong>File type</strong> dropdown.</p>
<p><img src="/images/blog/help-calc-export.png" alt="Export Data modal with the File type dropdown open" /></p>
<p>The .sav file carries numeric codes, value labels and user-missing sentinels, so blank answers do not distort means. The R export is a zip with data.sav plus an import_script.R that already builds frequency tables and is ready to extend, for example with <code>prop.test()</code> for exact proportion intervals or <code>t.test()</code> for mean intervals.</p>
<h2>Common traps</h2>
<ul>
<li>The per-comparison MoE lives only on Compare Responses (Advanced) and in the crosstab.xlsx workbook. The survey-wide MoE lives in the Response plan widget and the data-quality banner. The Results tab never shows a margin of error at all.</li>
<li>The MoE n is pair-specific. A card where fewer people answered both questions has a wider margin than your headline respondent count suggests.</li>
<li>Footer statistics and widget statistics differ by design (population vs sample SD, exclusion of values of 0 or below). Take calculator inputs from the Descriptive Statistics widget.</li>
<li>A tight interval only quantifies sampling noise. It says nothing about non-response bias, so a 95% interval on a survey only enthusiasts returned can still miss the truth.</li>
</ul>
<h2>Next steps</h2>
<ul>
<li><a href="/help/statistical-analysis/article/how-many-survey-responses-do-you-need">How Many Survey Responses Do You Need?</a></li>
<li><a href="/help/statistical-analysis/article/chi-square-tests-and-cross-tab-significance">Chi-Square, Cramér's V and P-Values: Testing Significance in Survey Cross-Tabs</a></li>
<li><a href="/help/exporting-data/article/exporting-survey-data">Exporting Survey Data</a></li>
<li>Plan your next wave with the <a href="/pages/sample-size-calculator">Sample Size Calculator</a></li>
</ul>]]>
            </summary>
                                    <updated>2026-08-06T14:13:09+00:00</updated>
        </entry>
            <entry>
            <title><![CDATA[Measuring Net Promoter Score (NPS) with Paper Surveys]]></title>
            <link rel="alternate" href="https://www.papersurvey.io/help/statistical-analysis/article/measuring-nps-with-paper-surveys" />
            <id>https://www.papersurvey.io/139</id>
            <author>
                <name><![CDATA[PaperSurvey.io]]></name>
            </author>
            <summary type="html">
                <![CDATA[<p>Net Promoter Score condenses loyalty into a single number between -100 and +100. Respondents answer one question on a 0 to 10 scale, and each answer lands in a bucket: 9 or 10 makes a promoter, 7 or 8 a passive, and 0 to 6 a detractor. The score is the percentage of promoters minus the percentage of detractors. This article walks through a real example, the Staff Experience Survey 2027 sample survey, where 200 employees were asked "How likely are you to recommend this workplace to a friend or colleague?" and 188 of them answered the NPS question.</p>
<h2>Add the NPS question</h2>
<ol>
<li>Open your survey and go to the <strong>Setup</strong> tab.</li>
<li>Add a question and pick <strong>Net Promoter Score</strong> from the question type list (it sits in the Choice group).</li>
<li>The scale runs to 10. By default it starts at 0, and you can set <strong>From</strong> to 1 if you prefer a 1 to 10 scale.</li>
</ol>
<p>The same question collects answers on printed forms and on the web version of the survey, so scanned paper responses and online submissions feed the same score.</p>
<h2>Read the score on the Results tab</h2>
<p>Once responses arrive, open <strong>Analysis</strong> and stay on the <strong>Results</strong> sub-tab. The NPS question gets its own card with the response distribution across the 0 to 10 scale and a response table with per-value counts.</p>
<p><img src="/images/blog/help-calc-nps-results.png" alt="Results card for the NPS question with the 0 to 10 bar chart and response table" /></p>
<p>Below the chart, an NPS summary shows the score itself, labelled "NPS Score" and displayed as a plain number without a plus sign. Hovering the score shows the tooltip "Net Promoter Score ranges from -100 to +100. Calculated as % Promoters (9-10) minus % Detractors (0-6)." Next to it, a stacked bar splits the responses into detractors, passives and promoters. Segments show their percentages when wide enough, hovering a segment reveals the exact response count, and a color legend sits below the bar.</p>
<h2>Track it on a dashboard</h2>
<p>For an always-current view, add the <strong>NPS Score</strong> widget to an analysis view. Open a view, click <strong>Edit</strong>, then <strong>Add</strong>, and pick <strong>NPS Score</strong> from the Stats category. In the staff survey it renders a gauge showing 20 with the summary line "44% promoters • 23% detractors • 188".</p>
<p><img src="/images/blog/help-calc-nps-widget.png" alt="NPS Score widget gauge showing 20 with 44% promoters, 23% detractors, 188 responses" /></p>
<p>Notice that 44 minus 23 is 21, one point above the gauge. That is not a bug. The widget computes the score from the unrounded promoter and detractor percentages and rounds once at the end, while the summary line rounds each percentage separately for display. Whenever you recompute a score by hand from rounded figures, expect to be off by up to a point.</p>
<p>Two more things worth knowing about the widget:</p>
<ul>
<li>It can pool several questions. Select more than one eligible question and it sums their promoter and detractor counts before computing one combined score.</li>
<li>It also accepts single-choice grid questions with 10 or more scale points. Each grid row's answers are classified by the option's numeric value, 9 or above counts as a promoter and 6 or below as a detractor. Grid rows are not picked automatically, so select the rows you want in the widget's settings.</li>
</ul>
<p>To trend the score, add the <strong>NPS Over Time</strong> widget. It charts the score across time with a configurable interval, monthly by default, with daily, weekly, quarterly and yearly options. Both widgets honor the view's date and response filters, so a filtered view of one department shows that department's NPS.</p>
<p>There is also a shortcut straight from the Results tab. Click the "..." icon on the NPS chart (its tooltip reads Actions), open the <strong>Analyze as</strong> group and choose <strong>NPS Score</strong>. The pre-configured widget is created in your analysis view immediately. This menu group appears once the survey has at least one analysis view, and the NPS Score entry is only offered on NPS questions. If you have several views, the entry expands so you can pick which view to save into.</p>
<h2>Cross-check with the free NPS calculator</h2>
<p>The free <a href="/pages/nps-calculator">NPS Calculator</a> uses the identical formula: percentage of promoters minus percentage of detractors, with passives counted in the total only. You will not normally need it for data collected in PaperSurvey, since the app computes the score for you, but it is handy when some of your counts live outside the app. If last year's survey ran in another tool, enter its promoter, passive and detractor counts into the calculator and compare the result against this year's widget on equal terms. Because the calculator also computes from raw counts and rounds once, it agrees with the app's score for the same data.</p>
<h2>Look past the single number</h2>
<p>A score of 20 says promoters outnumber detractors, but not how the answers are spread. To see the distribution behind the score, add a <strong>Descriptive Statistics</strong> widget (in the Advanced stats category of the same <strong>Add</strong> drawer) pointed at the NPS question.</p>
<p><img src="/images/blog/help-calc-outliers-skew.png" alt="Descriptive statistics widget for the NPS question showing mean, skewness and Tukey outliers" /></p>
<p>For the staff survey the widget reports a mean of 7.53, a median of 8 and a mode of 9 across the 188 responses, with skewness of -1.26 and 19 Tukey outliers highlighted in red. The picture is a strongly left-skewed distribution: most staff cluster at 8 and 9, while a small tail of very low scores pulls the mean down and fills the detractor bucket. That is exactly the pattern NPS is designed to expose. An average of 7.53 out of 10 sounds comfortable, yet the score of 20 is only moderate because every answer of 6 or below counts fully against you.</p>
<h2>Slice the score by group</h2>
<p>NPS questions are eligible on the <strong>Compare Responses</strong> sub-tab, so you can cross-tabulate the NPS question against department, office or salary band and let the app run a chi-square test on each pairing. The page notes that these comparisons are exploratory, which is the right way to treat them: use a significant pairing as a prompt to investigate, not as proof on its own. For ongoing segment tracking, duplicate your analysis view and apply a response filter per segment, since the NPS widgets respect those filters.</p>
<h2>Next steps</h2>
<ul>
<li><a href="/help/statistical-analysis/article/tracking-csat-ces-and-star-ratings">CSAT, Customer Effort Score and Star Ratings</a> covers the satisfaction metrics that complement NPS.</li>
<li><a href="/help/statistical-analysis/article/chi-square-tests-and-cross-tab-significance">Chi-Square, Cramér's V and P-Values</a> explains the significance tests behind Compare Responses.</li>
<li><a href="/help/analysis-reports/article/creating-an-analysis-dashboard">Creating an Analysis Dashboard</a> shows how to build the view that hosts your NPS widgets.</li>
<li>The <a href="/pages/nps-calculator">NPS Calculator</a> computes a score from any promoter, passive and detractor counts.</li>
</ul>]]>
            </summary>
                                    <updated>2026-07-22T12:00:01+00:00</updated>
        </entry>
            <entry>
            <title><![CDATA[Is Your Test Reliable? Cronbach's Alpha, KR-20, SEM and Inter-Rater Agreement]]></title>
            <link rel="alternate" href="https://www.papersurvey.io/help/statistical-analysis/article/measuring-test-reliability-and-rater-agreement" />
            <id>https://www.papersurvey.io/140</id>
            <author>
                <name><![CDATA[PaperSurvey.io]]></name>
            </author>
            <summary type="html">
                <![CDATA[<p>Before you act on test scores, it is worth asking whether the test itself is trustworthy. Reliability comes in two flavors. Internal consistency asks whether your questions pull in the same direction, so the total score measures one thing rather than noise. Inter-rater agreement asks whether two people scoring the same work reach the same verdict. PaperSurvey computes the first kind directly on your graded responses. For the second kind, the app gives you the agreement matrix and you finish the job with the free <a href="/pages/cohens-kappa-calculator">Cohen's Kappa Calculator</a>. This article walks through both using the Customer Service Training Assessment demo survey, a graded quiz with 12 single-choice questions worth 14 points in total (two questions are worth 2 points), a 70% pass threshold, and 250 responses.</p>
<h2>Add the Reliability &amp; Consistency block</h2>
<p>Internal consistency lives in one block on an analysis view. It requires grading to be switched on and answer keys set, the same setup described in <a href="/help/analysis-reports/article/quiz-analysis-charts">Test and Exam Analysis Charts</a>.</p>
<ol>
<li>Open the survey and go to <strong>Analysis</strong>.</li>
<li>Open an analysis view tab, or create one with <strong>+ New View</strong>.</li>
<li>Click <strong>Edit</strong>, then <strong>Add</strong> to open the Add blocks drawer.</li>
<li>In the <strong>Quiz</strong> category, pick <strong>Reliability &amp; Consistency</strong> ("Cronbach's alpha, KR-20 and standard error of measurement for your graded questions").</li>
</ol>
<p>If grading is not enabled, the card is greyed out in the drawer with the hint "Enable grading on this survey". The block also needs at least two graded questions and two respondents before it shows numbers. You rarely have to add it by hand: the Assessment Report view template and the Smart Report builder place it automatically for graded surveys, and the Test Results card on the Results tab has a Save to View entry named Reliability.</p>
<h2>Reading the card on real data</h2>
<p>Here is the block on the 250 training assessments:</p>
<p><img src="/images/blog/help-calc-reliability.png" alt="Reliability &amp; Consistency widget showing Cronbach&#039;s alpha, KR-20 and standard error of measurement" /></p>
<ul>
<li><strong>Cronbach's alpha 0.688</strong>, labelled "Questionable" in red. The badge thresholds are Excellent at 0.9 and above, Good at 0.8, Acceptable at 0.7, and Questionable below that. The honest red label is doing you a favor: at 0.688 the total score is usable for group-level conclusions, but you should be cautious about high-stakes decisions on individual respondents.</li>
<li><strong>KR-20 0.723</strong>, the reliability estimate for dichotomous right/wrong items.</li>
<li><strong>Std error of measurement 1.76</strong> score points.</li>
<li><strong>Score std deviation 3.15</strong>, plus <strong>Items 12</strong> and <strong>Respondents 250</strong>.</li>
</ul>
<p>Why do alpha and KR-20 disagree? Alpha is computed on the raw item point scores, where the two 2-point questions carry more weight. KR-20 first reduces every item to right or wrong. When all items are 1-point right/wrong questions, the two figures coincide. If your test uses negative marking (deducted points for wrong answers) or unequal point weights, the alpha row is the safer figure, because KR-20 assumes plain right/wrong items. Questions with zero points are excluded from the reliability calculation entirely.</p>
<h2>How the numbers are computed</h2>
<p>The in-app math matches the free calculators exactly, so you can reproduce every figure by hand.</p>
<ul>
<li><strong>KR-20</strong> dichotomizes each response: a score above 0 becomes 1, anything else becomes 0, and a missing answer counts as 0 (incorrect). It then applies (k/(k-1)) × (1 − Σpq / total score variance). The <a href="/pages/kr-20-calculator">KR-20 Calculator</a> accepts a pasted 0/1 matrix and runs the identical formula.</li>
<li><strong>Cronbach's alpha</strong> runs the same idea on raw item scores instead of 0/1 values. The <a href="/pages/cronbach-alpha-calculator">Cronbach's Alpha Calculator</a> takes a pasted item-score matrix, which is how you check reliability for a test that was not graded in PaperSurvey.</li>
<li><strong>Standard error of measurement</strong> is score SD × sqrt(1 − reliability), using Cronbach's alpha and falling back to KR-20 when alpha cannot be computed. The row shows a dash if reliability falls outside 0 to 1. You can verify the card: 3.15 × sqrt(1 − 0.688) = 1.76. The <a href="/pages/standard-error-measurement-calculator">Standard Error of Measurement Calculator</a> does the same from any SD and reliability pair.</li>
</ul>
<p>SEM is expressed in score points on your test's own point scale, not percentages, and it appears only in this block, not on the Results tab. The Score std deviation row matches the Std Dev 3.15 shown in the Score Distribution view of the Test Results card:</p>
<p><img src="/images/blog/help-calc-score-distribution.png" alt="Score distribution histogram with mean, median and standard deviation" /></p>
<p>SEM is the most practical number on the card. It says an individual's observed score sits roughly within ±1.76 points of their "true" score about two thirds of the time. On this 14-point test the pass threshold is 70%, which is 9.8 points, so a respondent scoring 9 is well within one SEM of passing. Treat pass/fail decisions in that band with care rather than reading a 9 versus a 10 as a meaningful difference.</p>
<h2>Rater agreement is a different question</h2>
<p>Suppose two trainers independently grade the same 80 role-play exercises into bands (Excellent, Good, Fair, Poor). Percent agreement overstates consistency because some agreement happens by chance. Cohen's kappa corrects for that, and to be explicit: PaperSurvey does not compute kappa anywhere in the app. What it does give you is a clean agreement matrix and exports, and the <a href="/pages/cohens-kappa-calculator">Cohen's Kappa Calculator</a> finishes the calculation.</p>
<p>Set up a double-coding sheet as its own survey:</p>
<ol>
<li>Create one Single choice question per rater, for example "Rater A: overall band" and "Rater B: overall band", with identical option lists in identical order. Use Single choice, not Multiple choice, so each rater contributes exactly one answer.</li>
<li>Record one entry per rated subject, with both questions answered on the same entry. Pairing happens per entry, so a form where only one rater answered contributes nothing.</li>
</ol>
<p>Then build the agreement matrix:</p>
<ol>
<li>Go to <strong>Analysis</strong>, then <strong>Compare Responses</strong>, and pick the Rater A question under "How do responses differ based on:".</li>
<li>Switch the toggle in the top right to <strong>Advanced</strong>, set the view control to <strong>Table</strong>, and choose <strong>Counts only</strong>.</li>
</ol>
<p>The resulting Rater A × Rater B table is the agreement matrix. Because both questions share the same option order, the diagonal cells are the agreements. Click <strong>Workbook</strong> to download the comparison as Excel; its Observed Frequencies sheet holds the same matrix, ready to copy into the calculator's matrix box.</p>
<p>One caution: the stats line under that card shows chi-square and Cramér's V. Those measure association, not agreement. Two harsh-versus-lenient raters can produce a highly significant chi-square while rarely agreeing, so never quote the cross-tab statistics as kappa. As a plain-arithmetic illustration, if the raters agree on 60 of 80 essays, observed agreement is 75%; if the marginals put chance agreement at 40%, kappa = (0.75 − 0.40) / (1 − 0.40) = 0.58, a much more sober figure than "75% agreement".</p>
<h2>Exporting for SPSS or R</h2>
<p>For weighted kappa, confidence intervals, or more than two raters, export the raw data. On the <strong>Responses</strong> tab, click <strong>Export</strong> and pick a File type in the Export Data modal:</p>
<p><img src="/images/blog/help-calc-export.png" alt="Export Data modal with the file type dropdown showing Excel, CSV, SPSS, R and more" /></p>
<ul>
<li><strong>SPSS</strong> produces a .sav file. Set Cell Values to <strong>Recoded Values</strong> so the rating bands export as numeric codes, then run CROSSTABS with /STATISTICS=KAPPA.</li>
<li><strong>R</strong> produces a zip with data.sav plus an import_script.R. Load it and run irr::kappa2 for two raters, or psych::cohen.kappa for weighted variants.</li>
</ul>
<p>The same exports let you rerun alpha or KR-20 on any subset, for example checking whether reliability holds within a single department using the filters described in <a href="/help/analysis-reports/article/filtering-data-in-analysis">Filtering Data in Analysis</a>.</p>
<h2>Next steps</h2>
<ul>
<li><a href="/help/statistical-analysis/article/item-analysis-difficulty-and-discrimination">Item Analysis for Tests: Difficulty and Discrimination Index Explained</a> shows which individual questions drag reliability down.</li>
<li><a href="/help/analysis-reports/article/quiz-analysis-charts">Test and Exam Analysis Charts</a> covers the Test Results card, grading setup and answer keys.</li>
<li><a href="/help/exporting-data/article/exporting-survey-data">Exporting Survey Data</a> details every export format and cell value option.</li>
<li>Try the free calculators: <a href="/pages/cronbach-alpha-calculator">Cronbach's Alpha Calculator</a>, <a href="/pages/kr-20-calculator">KR-20 Calculator</a>, <a href="/pages/standard-error-measurement-calculator">Standard Error of Measurement Calculator</a> and <a href="/pages/cohens-kappa-calculator">Cohen's Kappa Calculator</a>.</li>
</ul>]]>
            </summary>
                                    <updated>2026-07-22T12:00:01+00:00</updated>
        </entry>
            <entry>
            <title><![CDATA[CSAT, Customer Effort Score and Star Ratings: Tracking Satisfaction Beyond NPS]]></title>
            <link rel="alternate" href="https://www.papersurvey.io/help/statistical-analysis/article/tracking-csat-ces-and-star-ratings" />
            <id>https://www.papersurvey.io/141</id>
            <author>
                <name><![CDATA[PaperSurvey.io]]></name>
            </author>
            <summary type="html">
                <![CDATA[<p>Net Promoter Score answers one question, would people recommend you. Most teams also want to know how satisfied respondents are right now (CSAT), how much effort an interaction took (CES), and what the average star rating works out to. This article walks through all three on real data from the Staff Experience Survey 2027 [Sample] demo, a 200-respondent survey that includes "Rate your overall job satisfaction" on a 1 to 5 rating scale. The survey's dashboard already carries an NPS Score widget showing 20, built from 44% promoters and 23% detractors across 188 answers, so the goal here is to put satisfaction numbers next to it.</p>
<p><img src="/images/blog/help-calc-nps-widget.png" alt="NPS Score widget showing 20 with 44% promoters and 23% detractors" /></p>
<h2>Read the star rating on the Results tab</h2>
<p>Open the survey and go to <strong>Analysis</strong>, then the <strong>Results</strong> tab. A rating question built with <strong>From:</strong> 1 and <strong>To:</strong> 5 renders as a bar chart of how many respondents gave each rating, with a side table of counts and percentages:</p>
<p><img src="/images/blog/help-calc-rating-scale.png" alt="Results card for the 1-5 job satisfaction rating with counts and footer statistics" /></p>
<p>The side table reads 1: 10 (5.4%), 2: 22 (11.8%), 3: 46 (24.7%), 4: 68 (36.6%), 5: 40 (21.5%), and the footer shows TOTAL 186, NO RESPONSE 14, INVALID 0, MEAN 3.57, STD DEV 1.11, MEDIAN 4.00.</p>
<p>That footer Mean is already your star rating. It is the count-weighted average of the scale values:</p>
<p>(1×10 + 2×22 + 3×46 + 4×68 + 5×40) / 186 = 664 / 186 = 3.57</p>
<p>The free <a href="/pages/star-rating-calculator">Star Rating Calculator</a> computes exactly this from per-star counts, which is handy when your counts come from somewhere else, an app store listing or a review site, or when you want to show the arithmetic to a stakeholder.</p>
<p>Two design notes worth knowing:</p>
<ul>
<li>Start the scale at 1, not 0. The Results footer statistics exclude values of 0 or below, so a 0-anchored scale would silently drop its lowest ratings from the mean.</li>
<li>A single-choice question also works as a star scale if its options carry numeric recode values 1 to 5, because the footer mean weights each option's numeric code by its count.</li>
</ul>
<h2>Turn it into a CSAT percentage</h2>
<p>CSAT is a top-box metric: the percentage of responses at or above a satisfaction threshold. PaperSurvey computes it with the CSAT widget:</p>
<ol>
<li>Open an analysis view under <strong>Analysis</strong> and click <strong>Edit</strong>, then <strong>Add</strong>.</li>
<li>Pick <strong>CSAT</strong> from the <strong>Stats</strong> category of the block library.</li>
<li>The widget auto-detects a satisfaction-style question, here it picks "Rate your overall job satisfaction" on its own. You can change it with the <strong>Question</strong> picker in the inspector.</li>
</ol>
<p><img src="/images/blog/help-calc-csat-widget.png" alt="CSAT widget showing 58.1% with 108 of 186 satisfied at score 4+" /></p>
<p>The card shows 58.1%, with the working underneath: 108 of 186 satisfied at score 4+. That is the 68 respondents who answered 4 plus the 40 who answered 5, divided by all 186 answers. The threshold defaults to 4.0 and lives in the inspector's collapsed <strong>Advanced</strong> panel as <strong>Satisfied when score is at least</strong>, so you can switch to a stricter 5-only definition and watch the score change.</p>
<p>The <a href="/pages/csat-calculator">CSAT Calculator</a> does the same satisfied-over-total arithmetic on typed-in counts, useful for combining figures from several surveys or checking a number someone else reported.</p>
<p>There is also a shortcut: on the Results tab, a numeric chart's <strong>...</strong> actions menu contains an <strong>Analyze as</strong> group with <strong>CSAT Score</strong> and <strong>CES Score</strong> entries that create the pre-configured widget directly. The group appears once the survey has at least one analysis view.</p>
<h2>Customer Effort Score</h2>
<p>The staff survey does not include an effort question, but the workflow is identical. Add a question like "How easy was it to get help from IT?" on a 1 to 7 scale, then add the <strong>Customer Effort Score</strong> widget from the same <strong>Stats</strong> category. It shows the average effort rating with the response count, auto-selects a detected effort question, and the inspector's <strong>Effort question</strong> picker lets you point it elsewhere. Both the CSAT and CES widgets accept Number, Range, NPS, single-choice and single-choice grid questions, and both follow the filter bar at the top of the view.</p>
<p>The <a href="/pages/ces-calculator">CES Calculator</a> averages pasted ratings the same way, so you can reproduce the widget's number or score a batch of ratings collected outside PaperSurvey. Watch the scale direction: on a 1 = very difficult, 7 = very easy scale a higher average is better, but some published CES scales run the other way, so label your endpoints before you compare against a benchmark.</p>
<h2>Churn: what the app computes and what it does not</h2>
<p>If you ask a churn-style question in the survey itself, for example "Do you still use the staff canteen?" with Yes and No options, the Results chart's side table gives you each option's count and percentage directly, so the "No" percentage is your churn rate among respondents, and the Total and No response footer figures show how much of the sample that covers.</p>
<p>The accounting definition of churn, customers lost divided by customers at the start of the period, is different. PaperSurvey does not track your customers' accounts or billing, so it never computes that number. Take the counts from your own records and use the <a href="/pages/churn-rate-calculator">Churn Rate Calculator</a>, which returns both the churn and retention percentages.</p>
<h2>Trending and slicing</h2>
<p>All of these numbers recompute as responses arrive. To compare periods, use the filter bar on the analysis view: the date dropdown offers <strong>Uploaded</strong> and <strong>Printed</strong> modes with a date range picker, and the filter list includes <strong>Tag</strong>, so you can tag each collection wave and read CSAT per wave. Any Results chart can also be saved to a view from its <strong>...</strong> actions menu.</p>
<h2>Honest caveats</h2>
<ul>
<li>186 of 200 respondents answered the satisfaction question, and 14 skipped it. People who skip are rarely a random sample, so treat CSAT from a survey as satisfaction among those who answered.</li>
<li>The CSAT threshold is a choice. At 4+, this survey scores 58.1%; a 5-only definition would count just the 40 top ratings. Pick one definition and keep it constant across waves.</li>
<li>Star-rating means compress a whole distribution into one number. The 3.57 here hides that 17.2% of staff answered 1 or 2, so report the chart alongside the average.</li>
</ul>
<h2>Next steps</h2>
<ul>
<li><a href="/help/statistical-analysis/article/measuring-nps-with-paper-surveys">Measuring Net Promoter Score (NPS) with Paper Surveys</a></li>
<li><a href="/help/analysis-reports/article/creating-an-analysis-dashboard">Creating an Analysis Dashboard</a></li>
<li><a href="/help/analysis-reports/article/filtering-data-in-analysis">Filtering Data in Analysis</a></li>
<li><a href="/pages/star-rating-calculator">Star Rating Calculator</a></li>
</ul>]]>
            </summary>
                                    <updated>2026-07-22T12:00:01+00:00</updated>
        </entry>
            <entry>
            <title><![CDATA[How We Verify Our Statistics: Tested Against SciPy on Every Change]]></title>
            <link rel="alternate" href="https://www.papersurvey.io/help/statistical-analysis/article/how-we-verify-our-statistics" />
            <id>https://www.papersurvey.io/142</id>
            <author>
                <name><![CDATA[PaperSurvey.io]]></name>
            </author>
            <summary type="html">
                <![CDATA[<p>When a dashboard shows you a standard deviation, a p-value or an NPS, it is fair to ask whether the number is right. Our answer is not "trust us". Every statistic PaperSurvey reports is checked against <a href="https://scipy.org/">SciPy</a>, the reference scientific computing library used across academia and industry, by an automated test suite that runs on every code change. This article explains how that works and how you can reproduce any figure yourself. If you want the exact formula behind a specific number, the <a href="/statistical-methodology">Statistical Methodology</a> page lists them all.</p>
<h2>One golden fixture, generated from SciPy</h2>
<p>The core of the system is a single golden fixture: a file of known inputs paired with the answers SciPy produces for them. For each statistic we compute, from the mean and standard deviation through correlations, t-tests, chi-square, Cronbach's alpha and NPS, the fixture records SciPy's result to full precision. SciPy is the arbiter because it is independently maintained, widely peer-reviewed and the de facto standard for scientific computing in Python.</p>
<p>Because the expected answers come from an outside reference rather than from our own code, the fixture cannot quietly agree with a bug of ours. If our formula drifted, the fixture would still hold SciPy's correct value, and the test would fail.</p>
<h2>Both engines are tested against the same fixture</h2>
<p>PaperSurvey computes statistics in two places. One engine powers the dashboards, the automatic reports and the exports. A second engine powers the public <a href="/calculators">calculators</a> and the live figures you see as you edit an analysis view. These are two separate implementations of the same formulas.</p>
<p>On every code change, both engines are run against the same golden fixture. Each engine's results must match SciPy to the last meaningful decimal. This is what lets a scanned paper survey, a web survey, an export and a public calculator all report the same number for the same data. If a change nudged any figure off its SciPy reference, the test suite blocks it before it can ship.</p>
<h2>The conventions are documented, not hidden</h2>
<p>Many statistics have more than one defensible definition, and the honest thing is to state which one we use rather than leave you guessing why our figure differs from another tool by a hair. Our choices match the most common conventions in Excel and R:</p>
<ul>
<li><strong>Standard deviation and variance</strong> use the sample formula that divides by n minus 1, treating your responses as a sample of a wider audience. This matches Excel's STDEV.S and R's <code>sd()</code>.</li>
<li><strong>Percentiles and quartiles</strong> use linear interpolation, the type 7 definition, which is what Excel's PERCENTILE.INC and R's default <code>quantile()</code> return.</li>
<li><strong>P-values</strong> are two-tailed unless a test is inherently one-sided, so they answer "is there a difference in either direction".</li>
<li><strong>NPS</strong> is rounded once at the end, as the percentage of promoters (9 to 10) minus the percentage of detractors (0 to 6).</li>
</ul>
<p>Every one of these conventions, and the exact formula for each statistic, is spelled out on the <a href="/statistical-methodology">Statistical Methodology</a> page alongside the academic references behind them.</p>
<h2>Reproduce any number yourself</h2>
<p>The fixture proves our code matches SciPy, but you do not have to take that on faith either. You can recompute any figure from the same raw data the app uses:</p>
<ol>
<li>Open the <strong>Responses</strong> tab and export your data. The <a href="/help/exporting-data/article/exporting-survey-data">Excel, CSV, SPSS and R exports</a> all contain the raw per-respondent answers, so you can load them into your own tool and run the statistic yourself.</li>
<li>For a quick check without leaving the browser, paste the same numbers into the matching <a href="/calculators">free calculator</a>. Because the calculators are tested against the same SciPy reference as the dashboard, they agree with it for the same data.</li>
<li>Where a widget offers a workbook download, the Excel file carries the calculation as live formulas rather than pasted values, so you can trace each cell back to the inputs and watch the result recompute.</li>
</ol>
<p>If you ever find a figure that does not reconcile, it is almost always a difference in convention (for example a population standard deviation instead of the sample one, or rounding applied at a different step). The <a href="/statistical-methodology">Statistical Methodology</a> page is the place to check which convention we use.</p>
<h2>Why this matters</h2>
<p>Survey data often feeds decisions that matter: a pass or fail threshold on an exam, a reported NPS in a board deck, a significance claim in a research paper. Testing every formula against SciPy on every change means the numbers you present are the numbers a statistician would get from the same data, and that you can show your working if anyone asks.</p>
<h2>Next steps</h2>
<ul>
<li><a href="/statistical-methodology">Statistical Methodology</a> lists every formula and convention with references.</li>
<li><a href="/help/statistical-analysis/article/descriptive-statistics-for-survey-data">Descriptive Statistics for Survey Data</a> walks through the spread and shape statistics on real data.</li>
<li><a href="/help/exporting-data/article/exporting-survey-data">Exporting survey data</a> covers the Excel, CSV, SPSS and R exports you can recompute from.</li>
<li>The <a href="/calculators">free calculators</a> let you check any figure against the same tested engine.</li>
</ul>]]>
            </summary>
                                    <updated>2026-07-29T11:25:41+00:00</updated>
        </entry>
            <entry>
            <title><![CDATA[Scoring Assessment Scales with Points and Severity Bands]]></title>
            <link rel="alternate" href="https://www.papersurvey.io/help/statistical-analysis/article/scoring-assessment-scales-with-severity-bands" />
            <id>https://www.papersurvey.io/143</id>
            <author>
                <name><![CDATA[PaperSurvey.io]]></name>
            </author>
            <summary type="html">
                <![CDATA[<p>Standardized assessment tools work differently from a quiz. There are no right or wrong answers: every option is valid, but each carries a different number of points, and the total maps to a category that means something (Minimal, Moderate, Severe). PaperSurvey scores these scales automatically. You assign a point value to each answer, the app sums an instrument total for every respondent as their sheet is scanned or their web form is submitted, and it labels that total with the severity band you defined. This article walks through the PHQ-9 depression screen, a nine item scale scored 0 to 27, and shows how the same setup applies to any scored questionnaire.</p>
<h2>Points scoring versus right or wrong grading</h2>
<p>PaperSurvey has two scoring modes, and you choose one per question in the Answer Key:</p>
<ul>
<li><strong>Right / wrong answers</strong> is classic quiz grading. You tick the correct options and give the question a single weight in points. Covered in <a href="/help/statistical-analysis/article/automatic-test-grading-and-pass-rates">Grading Paper Tests Automatically</a>.</li>
<li><strong>Points per answer</strong> is for scales. Every option gets its own point value (often 0, 1, 2, 3), there is no correct answer, and a respondent's score is the value of the option they picked. This article is about this mode.</li>
</ul>
<p>Both modes need grading switched on for the survey, and both can live in the same survey.</p>
<h2>The scenario: PHQ-9</h2>
<p>The PHQ-9 asks how often, over the last two weeks, a person was bothered by nine problems. Each item is answered on the same four point frequency scale: Not at all (0), Several days (1), More than half the days (2), Nearly every day (3). The nine item scores add up to a total from 0 to 27, and that total maps to a severity band:</p>
<table>
<thead>
<tr>
<th>Total score</th>
<th>Severity</th>
</tr>
</thead>
<tbody>
<tr>
<td>0 to 4</td>
<td>Minimal</td>
</tr>
<tr>
<td>5 to 9</td>
<td>Mild</td>
</tr>
<tr>
<td>10 to 14</td>
<td>Moderate</td>
</tr>
<tr>
<td>15 to 19</td>
<td>Moderately severe</td>
</tr>
<tr>
<td>20 to 27</td>
<td>Severe</td>
</tr>
</tbody>
</table>
<p>Because all nine items share one scale, the natural way to build this is a single-choice grid: the nine items are the rows, and the four frequencies are the columns.</p>
<h2>Step 1: Turn on grading</h2>
<ol>
<li>Open your survey, go to <strong>Settings</strong>, and choose <strong>Grading</strong> in the side navigation.</li>
<li>Switch on <strong>Activate test grading</strong>.</li>
<li>Leave the <strong>Pass threshold</strong> empty. A pass or fail line is a quiz idea; a scale uses severity bands instead, which you set up next.</li>
</ol>
<h2>Step 2: Switch the Answer Key to Points per answer</h2>
<p>Answer keys live on the <strong>Setup</strong> tab. For a grid, open the tools menu on any one of the grid's rows and choose <strong>Answer Key</strong>. At the top of the modal there is a mode toggle:</p>
<ul>
<li>Select <strong>Points per answer</strong>.</li>
<li>The correct and incorrect sections are replaced by a <strong>Points</strong> field next to each column. Enter 0, 1, 2 and 3 for Not at all, Several days, More than half the days and Nearly every day.</li>
</ul>
<p><img src="/images/blog/help-scale-points-mode.png" alt="Answer Key modal in Points per answer mode with a point value beside each column" /></p>
<p>The column points are shared by every row of the grid, so you set them once. It does not matter which row you open the Answer Key on; the values you enter apply to the whole grid. Points can be any whole number, including negative values if a scale needs them.</p>
<h2>Step 3: Define the severity bands</h2>
<p>The same Answer Key modal has a <strong>Score bands</strong> section below the points. Add one row per band:</p>
<ul>
<li><strong>Min</strong> and <strong>Max</strong> are the inclusive ends of the range. A total of exactly 4 falls in a 0 to 4 band, and a total of 5 falls in a 5 to 9 band.</li>
<li>Leave <strong>Max</strong> blank on the top band (or <strong>Min</strong> blank on the bottom band) for an open ended range, for example 20 and above.</li>
<li><strong>Label</strong> is the text shown for that range, such as Moderate.</li>
<li><strong>Color</strong> tints the band in charts.</li>
</ul>
<p><img src="/images/blog/help-scale-bands-editor.png" alt="Score bands section with min, max, label and color rows for the PHQ-9 severity levels" /></p>
<p>For the PHQ-9 you add five bands: 0 to 4 Minimal, 5 to 9 Mild, 10 to 14 Moderate, 15 to 19 Moderately severe, 20 and above Severe. Bands may leave gaps; a total that falls in no band is simply left unlabeled. Click <strong>Save</strong>, and the modal reminds you that scores for all existing responses will be recalculated.</p>
<h2>What every respondent gets</h2>
<p>As each sheet is scanned and processed, or each web form submitted, the instrument total is computed as the sum of the item point values. On the <strong>Responses</strong> tab the <strong>Total Score</strong> column shows that sum. There is no pass or fail column unless you set a pass threshold; the meaning of the score comes from its band, which you see in analysis and exports.</p>
<h2>See the results: the Scale Score widget</h2>
<p>Open <strong>Analysis</strong>, edit the view, and add the <strong>Scale Score</strong> widget from the <strong>Quiz</strong> category. In its settings, pick the scored grid (or scored question) under <strong>Scored question or grid</strong>. The widget shows:</p>
<ul>
<li>A histogram of respondent totals, with each bar colored by the band it falls in.</li>
<li>The mean, median, high, low and standard deviation of the totals, and the count of respondents.</li>
<li>A legend listing each band, its range, and how many respondents landed in it.</li>
</ul>
<p><img src="/images/blog/help-scale-score-widget.png" alt="Scale Score widget with the total distribution colored by severity band and a band legend showing respondent counts" /></p>
<p>This is the headline view of a screening program: at a glance you see how many people scored in the Moderate or Severe range.</p>
<h2>Do you have to use a grid?</h2>
<p>No, but the choice matters. A band always applies to one instrument's total, so how you build the instrument decides what gets banded. There are three cases.</p>
<p><strong>A multi-item scale: use a single-choice grid (recommended).</strong> When several items share one answer scale, like the nine PHQ-9 items, build them as a single-choice grid with the items as rows and the scale as columns. The grid is what sums the rows into one total, so the band labels that combined total. This is how the PHQ-9 and GAD-7 templates are built, and it is the right structure for any standardized tool.</p>
<p><strong>A single scored question: fully supported.</strong> A standalone single-choice or multiple-choice question is a one item instrument. Put points on its options and bands on the question, and it behaves exactly like a grid: its own total (the value of the option picked), its own Scale Score widget, and its own export and webhook fields. Use this for a single global rating, for example one overall severity item.</p>
<p><strong>Several separate single-choice questions: each stands alone.</strong> If you build a scale as several individual single-choice questions instead of a grid, each question scores and bands on its own. Nothing combines them into one total, because only a grid groups items into an instrument. You have two choices:</p>
<ul>
<li>To get one banded total for the scale, turn the items into a single-choice grid (rows = items). This is the recommended structure.</li>
<li>If you keep them separate, the survey-wide <strong>Total Score</strong> column still adds up every scored answer, but that is a whole-survey number rather than a per-scale band, and it also folds in any other scored questions in the form.</li>
</ul>
<p><strong>Why not band the whole survey?</strong> Because one form often carries more than one instrument. An intake form can include both a PHQ-9 and a GAD-7, each needing its own total (0 to 27 versus 0 to 21) and its own bands, next to unscored questions such as demographics that should not count. Banding per instrument keeps them separate and correct. Individual grid rows are likewise never banded on their own; only the instrument total is.</p>
<p>Two more notes:</p>
<ul>
<li><strong>Reverse-scored items.</strong> If an instrument scores some items in reverse (3 down to 0 instead of 0 up to 3), keep those items in a separate grid whose columns are valued in reverse. A single grid uses one shared set of column points for all its rows.</li>
<li><strong>One scale per grid.</strong> Every row of a grid uses the same shared column points, which is exactly what a standardized scale needs.</li>
</ul>
<h2>Exports and integrations</h2>
<p>Every scored respondent carries their band into your data, not just into the app:</p>
<ul>
<li><strong>File exports.</strong> On the <strong>Responses</strong> tab, <strong>Export</strong> includes the <strong>Total Score</strong> column and, for every scored instrument with bands, a <strong>&lt;instrument name&gt; band</strong> column showing the label, for example Moderate. This applies to Excel, CSV, SPSS, R, SAS and Stata.</li>
<li><strong>Google Sheets.</strong> A connected sheet gets the same band column automatically, next to Total Score. If you have customized which columns your sheet shows, the band column is added alongside the score column and is also available to add or hide in the column picker.</li>
<li><strong>Webhooks and API.</strong> The entry payload includes a <strong>scale_bands</strong> array, one entry per scored instrument, each with the instrument's question id, name, summed score, and band label. A downstream system can route a Severe result straight into a follow-up workflow.</li>
<li><strong>Zapier.</strong> Each scored instrument appears as a flat <strong>band_&lt;id&gt;</strong> field you can map into any Zap.</li>
</ul>
<p>A total that falls in no band exports as an empty cell.</p>
<h2>Start from a template</h2>
<p>The PHQ-9 and GAD-7 templates in the gallery come preconfigured: the grid already has points 0 to 3 on the columns, the official severity bands, grading switched on, and a Scale Score report in the analysis view. Duplicate one of them and you have a working scored scale in a couple of clicks, ready to print, scan, and read as severity bands.</p>
<h2>Next steps</h2>
<ul>
<li><a href="/help/statistical-analysis/article/automatic-test-grading-and-pass-rates">Grading Paper Tests Automatically</a> for right or wrong quiz scoring, weighted points and pass rates.</li>
<li><a href="/help/statistical-analysis/article/analyzing-likert-scale-data">Analyzing Likert Scale Data</a> for response distributions across a battery of items.</li>
<li><a href="/help/analysis-reports/article/creating-an-analysis-dashboard">Creating an Analysis Dashboard</a> to arrange the Scale Score widget alongside other charts.</li>
<li><a href="/help/exporting-data/article/exporting-survey-data">Exporting Survey Data</a> for the full list of export formats.</li>
</ul>]]>
            </summary>
                                    <updated>2026-07-29T11:25:41+00:00</updated>
        </entry>
    </feed>