<?xml version="1.0" encoding="UTF-8"?>
<?xml-stylesheet href="/vendor/feed/atom.xsl" type="text/xsl"?>
<feed xmlns="http://www.w3.org/2005/Atom" xml:lang="en-US">
                        <id>https://www.papersurvey.io/feed</id>
                                <link href="https://www.papersurvey.io/feed" rel="self"></link>
                                <title><![CDATA[PaperSurvey.io blog]]></title>
                    
                                <subtitle></subtitle>
                                                    <updated>2026-04-30T14:15:48+00:00</updated>
                        <entry>
            <title><![CDATA[How to Grade 500 Paper Exams in Under an Hour]]></title>
            <link rel="alternate" href="https://www.papersurvey.io/blog/grade-500-paper-exams-under-an-hour" />
            <id>https://www.papersurvey.io/29</id>
            <author>
                <name><![CDATA[PaperSurvey.io]]></name>
            </author>
            <summary type="html">
                <![CDATA[<p>If you have ever sat down with a stack of 500 exam papers and a red pen, you know the math. At 3 to 5 minutes per paper, you are looking at 25 to 40 hours of grading. That is three to five full working days of repetitive, error-prone work, and it does not include the time to enter scores into a spreadsheet or gradebook afterward.</p>
<p>There is a faster way. With OMR (Optical Mark Recognition) scanning and automated processing, the same 500 exams can be graded in under an hour. Not "under an hour of grading per person across a team." Under an hour total, from the first paper entering the scanner to the last score exported to your gradebook.</p>
<p>This is not theoretical. It is a routine workflow for institutions that have adopted automated paper exam processing. Here is exactly how it works.</p>
<h2>The Manual Grading Problem</h2>
<p>Before looking at the solution, it is worth understanding just how expensive manual grading really is.</p>
<h3>Time Cost</h3>
<p>A typical multiple-choice exam with 40 questions takes about 2 minutes to grade manually if you are using an answer key overlay. An exam with short-answer or essay questions takes 5 to 10 minutes per paper, depending on the length and complexity of the responses.</p>
<p>For 500 exams:</p>
<ul>
<li><strong>40-question multiple choice only:</strong> 2 minutes x 500 = 16.7 hours</li>
<li><strong>Mixed format (MC + short answer):</strong> 5 minutes x 500 = 41.7 hours</li>
<li><strong>Essay-heavy exam:</strong> 8 minutes x 500 = 66.7 hours</li>
</ul>
<p>These estimates do not include the time to record scores, double-check calculations, or handle the inevitable errors that creep in during hours of repetitive work.</p>
<h3>Error Rate</h3>
<p>Manual grading is not just slow. It is inconsistent. Studies on grading reliability have found that human graders make errors at a rate of 1-3% on straightforward multiple-choice marking, and much higher rates on subjective questions. When you are grading the 400th paper in a sitting, your accuracy is not the same as it was on the 10th.</p>
<p>These errors have consequences. A mismarked answer can change a student's grade, trigger appeals, and undermine trust in the assessment process.</p>
<h3>Labor Cost</h3>
<p>If grading is done by teaching assistants paid $20-30 per hour, the labor cost for grading 500 mixed-format exams is $800 to $1,250. For a department running multiple sections of a course, this adds up quickly. That money goes to a task that adds no educational value. It is pure administrative overhead.</p>
<h2>The OMR Alternative</h2>
<p>OMR technology reads marks on paper. When a student fills in a bubble next to option B, the scanner detects the mark and records the response. This has been possible since the 1960s, but modern OMR is faster, more accurate, and far more accessible than the old Scantron machines.</p>
<h3>What You Need</h3>
<p><strong>A document feeder scanner.</strong> An Automatic Document Feeder (ADF) scanner processes pages continuously. A mid-range ADF scanner handles 40-60 pages per minute and costs $300-$500. This is a one-time investment that pays for itself in the first exam cycle.</p>
<p><strong>Exam processing software.</strong> This is where the intelligence lives. The software reads the scanned images, identifies the marked responses, compares them against your answer key, and calculates scores. <a href="https://www.papersurvey.io">PaperSurvey.io</a> handles this entire workflow in a browser-based platform with no software installation required.</p>
<p><strong>A well-designed exam paper.</strong> The exam needs to be designed with scanning in mind. Clear bubble areas, consistent layout, and machine-readable identification (like QR codes) make the difference between smooth processing and a frustrating experience.</p>
<h2>The Step-by-Step Workflow</h2>
<p>Here is the exact process for grading 500 multiple-choice exams in under an hour using <a href="https://www.papersurvey.io">PaperSurvey.io</a>.</p>
<h3>Step 1: Design the Exam (Done Once, Before the Exam)</h3>
<p>Create your exam in the platform. Add your multiple-choice questions, specify the correct answers, and assign point values. The platform generates a print-ready PDF with properly formatted bubble areas, clear question numbering, and QR codes that identify each page.</p>
<p>This step takes 30 minutes to an hour for a typical 40-question exam, but it is a one-time investment. You can reuse and modify templates for future exams.</p>
<h3>Step 2: Print and Administer</h3>
<p>Print the exam PDF on any standard laser printer. Administer it in your exam hall under normal supervised conditions. Students use a dark pen to fill in their answers.</p>
<p>No special paper is required. No special pens. No pre-printed bubble sheets from a third-party vendor. You print the exam on standard A4 or letter-size paper.</p>
<h3>Step 3: Scan the Completed Exams (15-20 Minutes)</h3>
<p>After the exam, collect the papers and feed them through your ADF scanner. At 40 pages per minute, 500 single-sided exams take about 12-13 minutes to scan. If the exams are double-sided, a duplex scanner handles both sides in a single pass, taking the same amount of time.</p>
<p>The scanner produces a PDF or set of images that you upload to the platform.</p>
<h3>Step 4: Automated Grading (5-15 Minutes)</h3>
<p>Once uploaded, the platform processes the scans automatically. For each exam paper, it:</p>
<ol>
<li>Identifies the page using the QR code.</li>
<li>Locates the bubble areas for each question.</li>
<li>Reads the marked responses.</li>
<li>Compares each response against the answer key.</li>
<li>Calculates the score.</li>
<li>Flags any ambiguous marks for your review.</li>
</ol>
<p>For 500 exams with 40 questions each, this processing typically takes 5 to 15 minutes depending on image quality and server load.</p>
<h3>Step 5: Review Flagged Items (5-10 Minutes)</h3>
<p>The platform flags a small percentage of responses where the mark is ambiguous. Maybe a student partially filled a bubble, marked two options, or made a stray mark near an answer area. You review these flagged items, which typically number 10-30 out of 500 exams, and make a quick judgment on each one.</p>
<p>This review step takes 5 to 10 minutes. It is the only part of the process that requires your active judgment.</p>
<h3>Step 6: Export Results (2 Minutes)</h3>
<p>Download the results as a CSV or Excel file. The export includes individual student scores, per-question breakdowns, and aggregate statistics. Import the file into your LMS or gradebook.</p>
<h3>Total Time: 27-47 Minutes</h3>
<p>That is the real number. Fifteen to twenty minutes of scanning. Five to fifteen minutes of automated processing. Five to ten minutes of human review. Two minutes to export. For 500 exams, you are done in under an hour.</p>
<p>Compare that to 25-40 hours of manual grading.</p>
<h2>What You Get Beyond Just Scores</h2>
<p>Automated processing does not just save time. It gives you data that manual grading never provides.</p>
<h3>Item Analysis</h3>
<p>For every question on the exam, you see:</p>
<ul>
<li>The percentage of students who selected each option.</li>
<li>The discrimination index, showing whether the question differentiates between high-performing and low-performing students.</li>
<li>The difficulty index, showing what percentage of students answered correctly.</li>
</ul>
<p>This tells you which questions are working well and which need revision. A question where 98% of students answer correctly is too easy. A question where the most common answer is a distractor rather than the correct option may be poorly worded.</p>
<h3>Score Distributions</h3>
<p>You get a histogram of scores, mean, median, standard deviation, and percentile rankings. This gives you an immediate picture of how the class performed and whether the exam was appropriately calibrated.</p>
<h3>Per-Student Breakdowns</h3>
<p>For each student, you can see which questions they got right and wrong. This is useful for post-exam review sessions and for identifying students who need additional support in specific topic areas.</p>
<h3>Exportable, Analyzable Data</h3>
<p>All of this data is in a structured digital format, ready for import into gradebooks, statistical software, or institutional reporting systems. There is no secondary data entry step where errors can creep in.</p>
<h2>Handling Mixed-Format Exams</h2>
<p>Not every exam is purely multiple choice. Many exams include a mix of multiple-choice questions and open-ended responses. This is still far faster than fully manual grading.</p>
<h3>The Automated Portion</h3>
<p>Multiple-choice, true/false, and matching questions are graded automatically, exactly as described above. If your 40-question exam has 30 multiple-choice questions and 10 short-answer questions, the 30 MC questions are graded in minutes across all 500 papers.</p>
<h3>The Assisted Portion</h3>
<p>For short-answer and essay questions, the platform extracts the handwritten text from the defined answer areas and presents it to graders in a digital interface. Instead of flipping through 500 physical papers, the grader sees one question at a time, across all students, on their screen.</p>
<p>This approach is faster than traditional grading for several reasons:</p>
<ul>
<li>No physical paper handling. No flipping pages, no losing your place, no illegible answers obscured by coffee stains.</li>
<li>Consistent grading. Seeing all responses to the same question in sequence, rather than grading one student's entire paper at a time, improves consistency.</li>
<li>Parallel grading. Multiple graders can work on different questions simultaneously, each from their own computer.</li>
<li>Built-in scoring. Grades are recorded directly in the platform. No separate score sheet to manage.</li>
</ul>
<p>For 500 exams with 10 short-answer questions, this assisted grading process might take 3 to 6 hours, which is still dramatically less than the 40+ hours full manual grading would require. The 30 MC questions that would have taken 10+ hours to grade manually are done in minutes.</p>
<h2>Real Cost Comparison</h2>
<p>Here is a concrete comparison for a department grading 500 exams per semester across three courses.</p>
<h3>Manual Grading</h3>
<ul>
<li>1,500 exams x 5 minutes each = 125 hours of grading</li>
<li>At $25/hour for teaching assistants = $3,125 per semester</li>
<li>Plus data entry time: approximately 20 additional hours = $500</li>
<li>Total: $3,625 per semester, $7,250 per year</li>
</ul>
<h3>Automated Processing</h3>
<ul>
<li>Scanner (one-time): $400</li>
<li>Platform subscription: varies, but typically $50-200 per month</li>
<li>Scanning time: approximately 1 hour per exam batch = 3 hours per semester</li>
<li>Review and export: approximately 1 hour per batch = 3 hours per semester</li>
<li>Total labor: 6 hours at $25/hour = $150 per semester</li>
<li>Total first year: $400 (scanner) + $600-2,400 (platform) + $300 (labor) = $1,300-$3,100</li>
<li>Total subsequent years: $600-2,400 (platform) + $300 (labor) = $900-$2,700</li>
</ul>
<p>The savings grow with volume. The more exams you process, the greater the advantage of automated grading.</p>
<h2>Getting Started</h2>
<p>You do not need to convert all your exams at once. Start with one course and one exam cycle.</p>
<ol>
<li>Sign up for a <a href="https://www.papersurvey.io">PaperSurvey.io</a> account.</li>
<li>Create a single exam with your existing multiple-choice questions.</li>
<li>Print it and administer it alongside your normal exam process.</li>
<li>Scan the completed exams and upload them.</li>
<li>Review the results and compare them to what manual grading would have produced.</li>
</ol>
<p>Most instructors who try the workflow once do not go back to manual grading. The time savings are too significant, the accuracy is too high, and the data you get is too useful.</p>
<p>Five hundred exams. Under an hour. That is the difference the right tools make.</p>]]>
            </summary>
                                    <updated>2026-04-26T08:45:22+00:00</updated>
        </entry>
            <entry>
            <title><![CDATA[How Universities Are Returning to Paper Exams to Combat AI Cheating]]></title>
            <link rel="alternate" href="https://www.papersurvey.io/blog/universities-returning-paper-exams-ai-cheating" />
            <id>https://www.papersurvey.io/40</id>
            <author>
                <name><![CDATA[PaperSurvey.io]]></name>
            </author>
            <summary type="html">
                <![CDATA[<p>For more than a decade, universities moved steadily toward digital assessments. Online exams, take-home assignments submitted through learning management systems, and remote proctoring software became the default at many institutions. Then ChatGPT arrived, and the assumptions behind digital assessment collapsed almost overnight.</p>
<p>Since late 2022, a growing number of universities have reversed course. They are returning to paper-based exams, not because they are nostalgic for the old way, but because paper remains the most reliable method for ensuring that the person sitting the exam is actually doing the work.</p>
<p>This is not a fringe movement. It is happening at research universities, teaching colleges, professional schools, and secondary institutions across multiple continents.</p>
<h2>Why AI Broke Digital Assessment</h2>
<p>The fundamental problem is simple: AI tools can now produce work that is indistinguishable from student-written responses in most academic contexts.</p>
<p>When ChatGPT launched publicly in November 2022, it could already pass bar exams, medical licensing tests, and graduate-level coursework. By 2024, newer models could handle nuanced essay questions, show mathematical working, write code with explanations, and produce responses calibrated to a specific grade level or writing style.</p>
<p>This created an impossible situation for online assessments. A student taking an exam on a laptop has access to the same AI tools that can pass that exam. No amount of browser lockdown software changes this reality when a student can simply use a second device, a phone, or even a smartwatch.</p>
<h3>AI Detection Tools Have Failed</h3>
<p>The initial response from many institutions was to adopt AI detection software. Tools like Turnitin's AI detection, GPTZero, and others promised to identify AI-generated text. The results have been disappointing.</p>
<p>Multiple studies have found that AI detection tools produce unacceptably high false positive rates, flagging human-written work as AI-generated. This is particularly harmful for non-native English speakers, whose writing patterns are more likely to be misidentified. In 2023, several universities abandoned AI detection mandates after students were wrongly accused of cheating based on detector output.</p>
<p>The detectors also have a fundamental limitation: as AI models improve, their outputs become harder to distinguish from human writing. Detection is an arms race that the detectors are losing. Students can also use paraphrasing tools, prompt engineering techniques, and humanization services to evade detection entirely.</p>
<h3>Remote Proctoring Created More Problems Than It Solved</h3>
<p>Remote proctoring software, which monitors students through their webcam during online exams, was widely adopted during the COVID-19 pandemic. It quickly became controversial.</p>
<p>Students reported invasive surveillance, false flagging for looking away from the screen or having someone walk through the background, and software that required root-level access to their personal computers. Accessibility advocates raised concerns about students with disabilities being disproportionately flagged. Privacy regulators in several jurisdictions questioned the data collection practices.</p>
<p>Beyond the ethical issues, proctoring software simply does not prevent AI use. A student can use a second device out of camera view. They can have someone in another room feeding them answers via an earpiece. The software monitors behavior, not cognition, and determined cheaters can work around behavioral monitoring.</p>
<h2>Which Institutions Have Made the Switch</h2>
<p>The return to paper exams is happening across a wide range of institutions and disciplines.</p>
<p>In the United Kingdom, several Russell Group universities reintroduced in-person written exams for courses that had moved to online assessment during the pandemic. The University of Manchester, Imperial College London, and others expanded their in-person exam schedules starting in the 2023-2024 academic year.</p>
<p>In Australia, the Group of Eight universities reported increased use of supervised written exams, with some departments specifically citing AI concerns as the driver. The University of Sydney and the University of Melbourne both expanded pen-and-paper assessments for courses in humanities, social sciences, and business.</p>
<p>In the United States, law schools, medical schools, and business schools have been among the fastest to return to paper. These professional programs have high-stakes assessments where the credential's value depends on the integrity of the examination process.</p>
<p>Engineering and computer science departments present an interesting case. While some have embraced AI tools as part of the curriculum, many still require paper-based exams for foundational courses where they need to verify that students can solve problems independently.</p>
<h2>The Practical Benefits of Paper Exams</h2>
<p>The return to paper is not just about preventing AI use. Paper exams offer several practical advantages that digital assessment cannot match.</p>
<h3>No Technology Failures</h3>
<p>Every instructor who has administered an online exam has experienced the nightmare scenario: the platform crashes during the exam, students lose their work, internet connections drop, or the submission system fails at the deadline. These incidents create anxiety for students, administrative headaches for staff, and fairness concerns that require makeup exams or grade adjustments.</p>
<p>Paper exams do not crash. They do not time out. They do not require a stable internet connection. The technology is a pen and a sheet of paper, and it works every time.</p>
<h3>No Screen Sharing or AI Assistance</h3>
<p>In a supervised paper exam, the student has access to exactly what the invigilator allows: the exam paper, an answer booklet, a pen, and any permitted reference materials. There is no browser to switch to, no second monitor to glance at, and no AI assistant waiting for a prompt.</p>
<p>This is not a hypothetical advantage. It is the reason paper exams have been the standard for high-stakes assessments for centuries. The controlled environment ensures that the work produced reflects the student's own knowledge and ability.</p>
<h3>
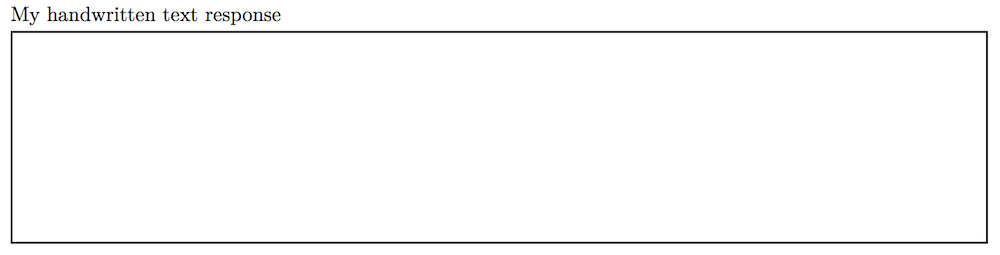
Handwritten Responses Show Authentic Thinking</h3>
<p>Handwritten exam responses reveal things that typed text does not. Crossed-out sentences, changed answers, rough working, and annotations in the margins all provide evidence of a student's thought process. An instructor reading a handwritten response can see where a student hesitated, changed direction, or worked through a problem step by step.</p>
<p>AI-generated text, by contrast, tends to be fluent, well-structured, and devoid of the false starts and self-corrections that characterize genuine student thinking. Paper exams make authentic thinking visible in a way that typed responses do not.</p>
<h3>Equal Access in the Exam Hall</h3>
<p>Online exams introduce inequities based on technology access. Students with newer laptops, faster internet connections, and quieter home environments have advantages over students with older devices, shared living spaces, and unreliable connectivity.</p>
<p>In-person paper exams equalize these conditions. Every student gets the same desk, the same paper, the same amount of time, and the same environment. The assessment measures knowledge, not the quality of a student's home internet setup.</p>
<h2>Handling Paper Exams at Scale</h2>
<p>The most common objection to paper exams is logistics. Processing hundreds or thousands of handwritten exam scripts is time-consuming, and manual grading is slow, inconsistent, and exhausting for instructors.</p>
<p>This is where modern technology makes the return to paper far more practical than it was even five years ago.</p>
<h3>OCR and OMR Processing</h3>
<p>
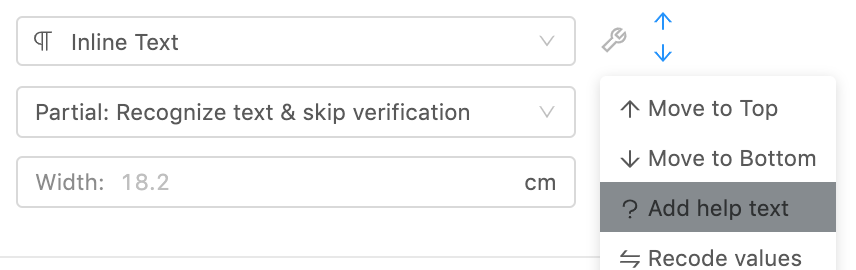
Optical Mark Recognition (OMR) can automatically grade multiple-choice and bubble-sheet responses from scanned paper exams. Combined with Optical Character Recognition (OCR) and Intelligent Word Recognition (IWR), modern scanning systems can also extract handwritten text from open-ended responses.</p>
<p>
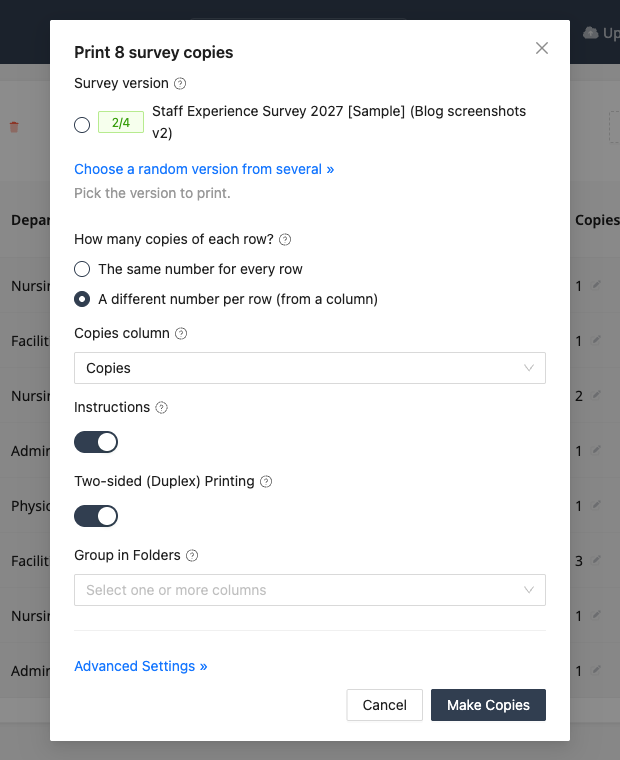
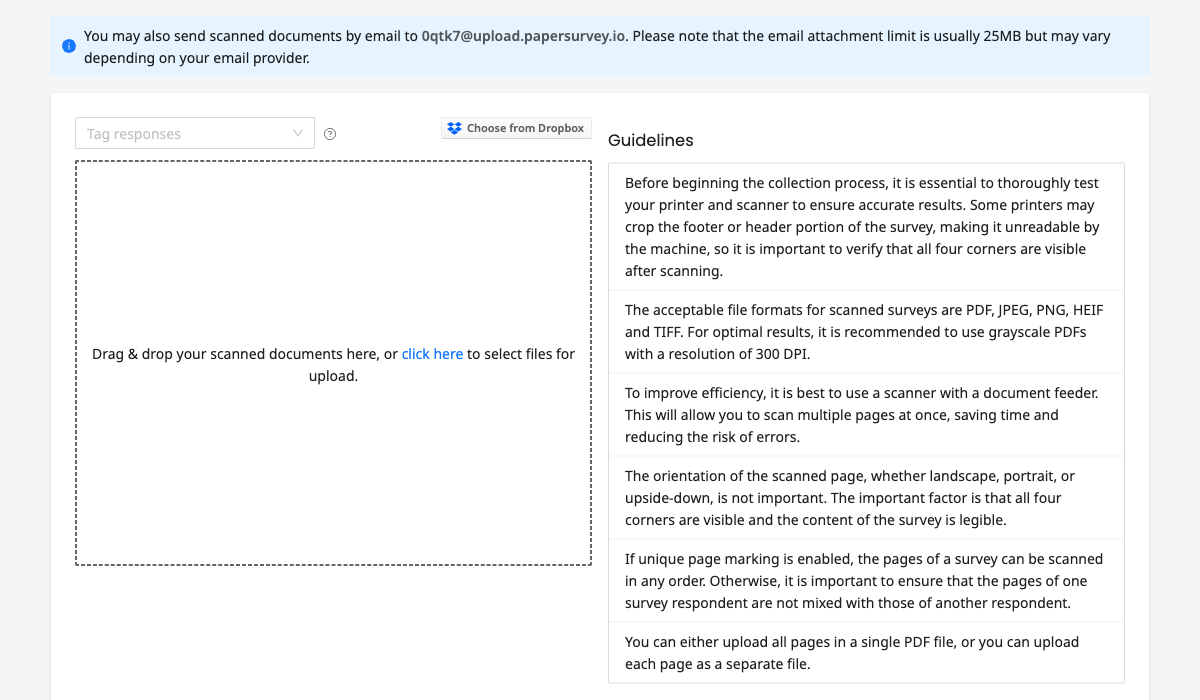
This means universities do not have to choose between exam integrity and processing efficiency. A well-designed paper exam can be scanned in bulk using a document feeder and processed automatically, with results exported to gradebook systems in a fraction of the time manual grading would take.
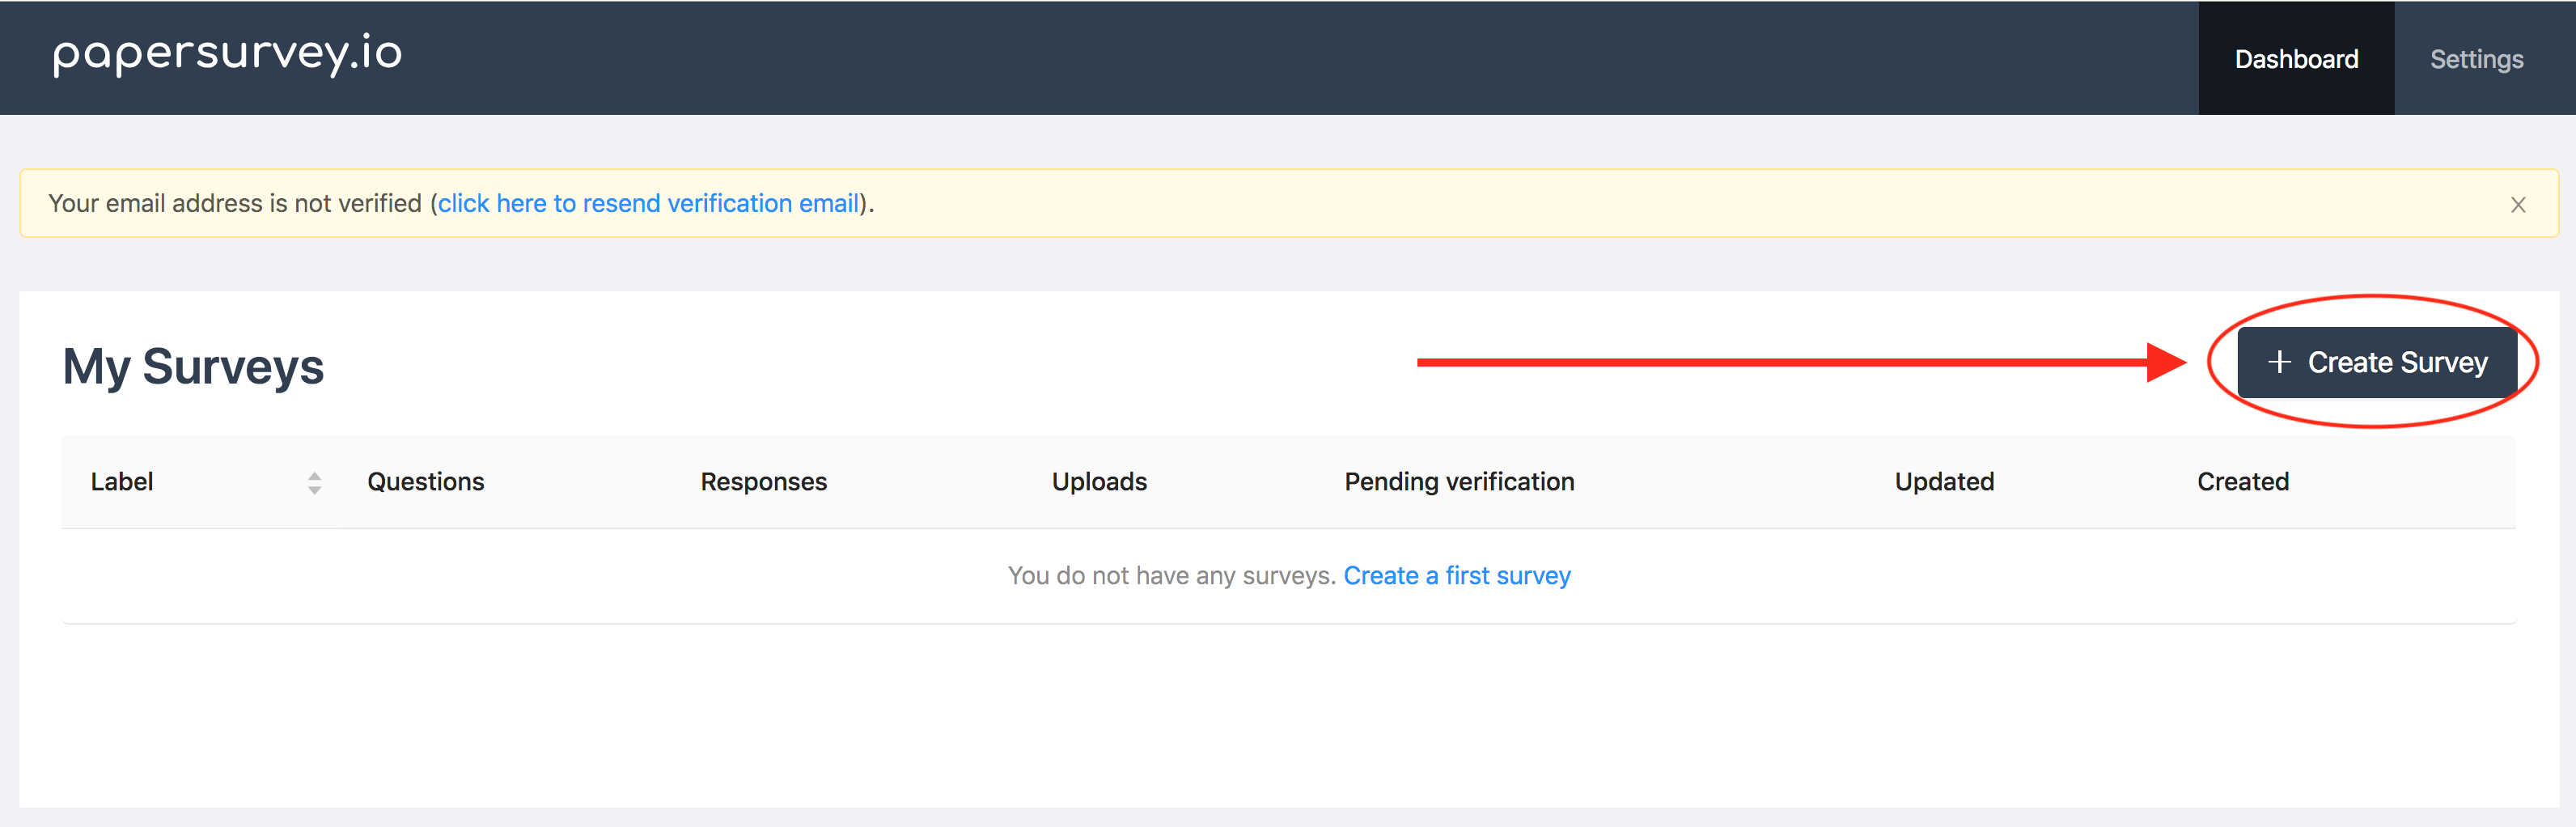
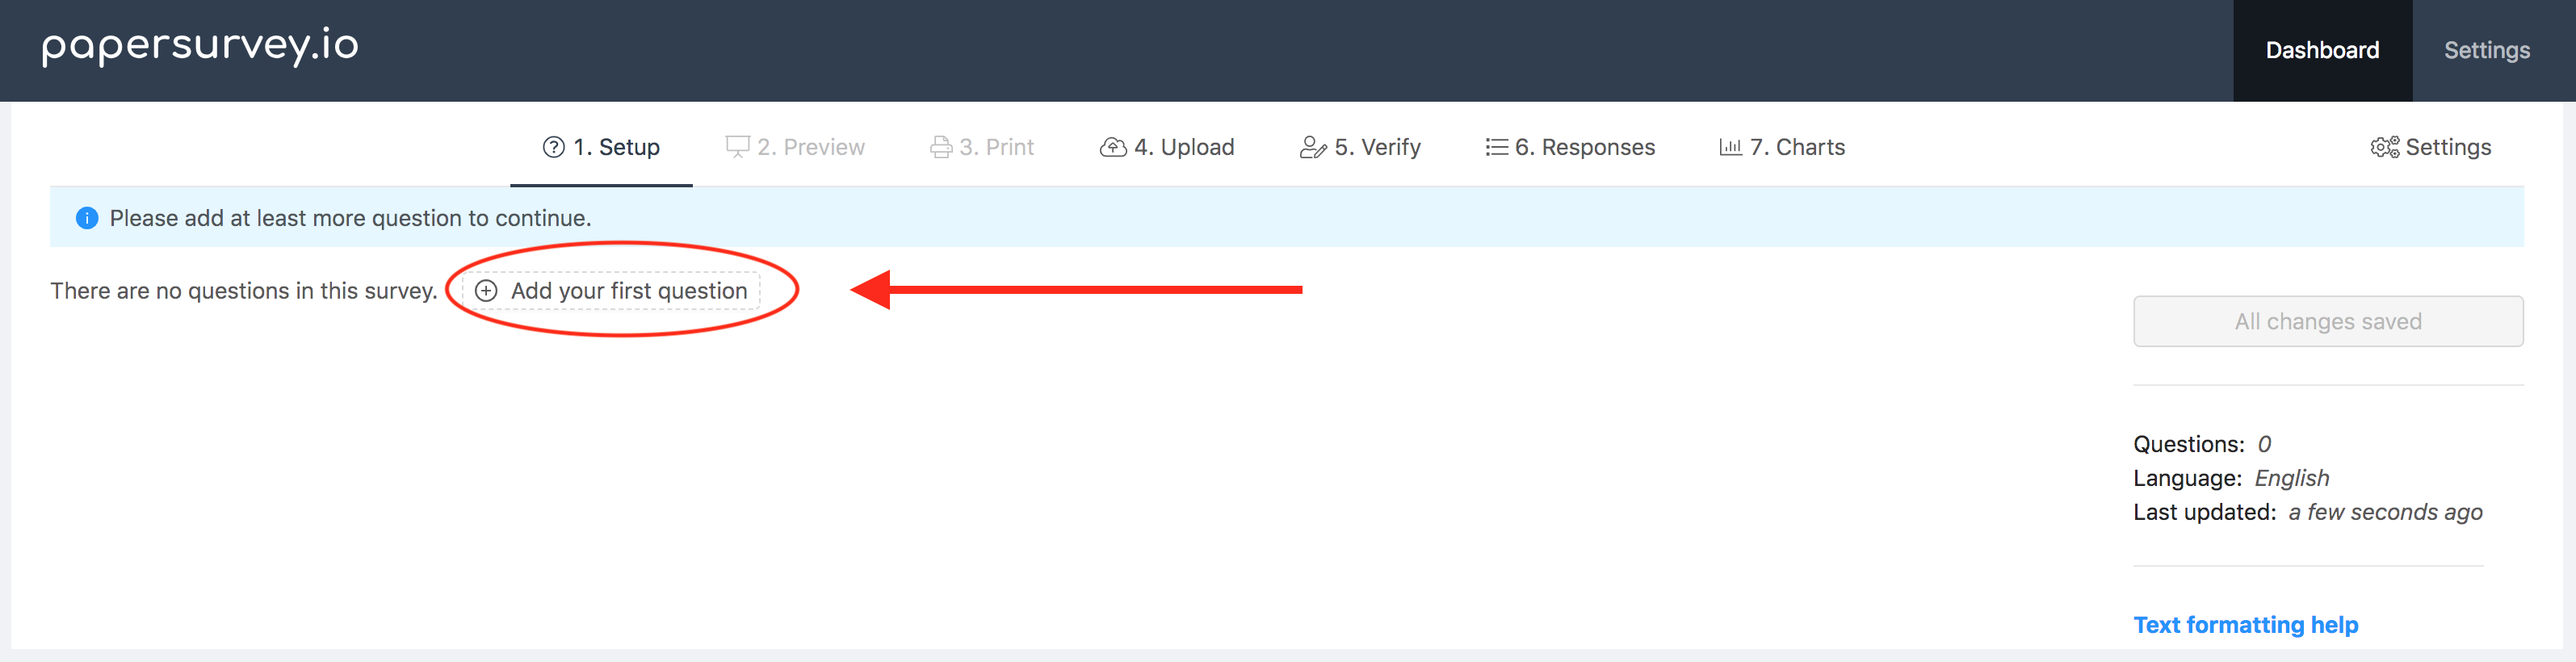
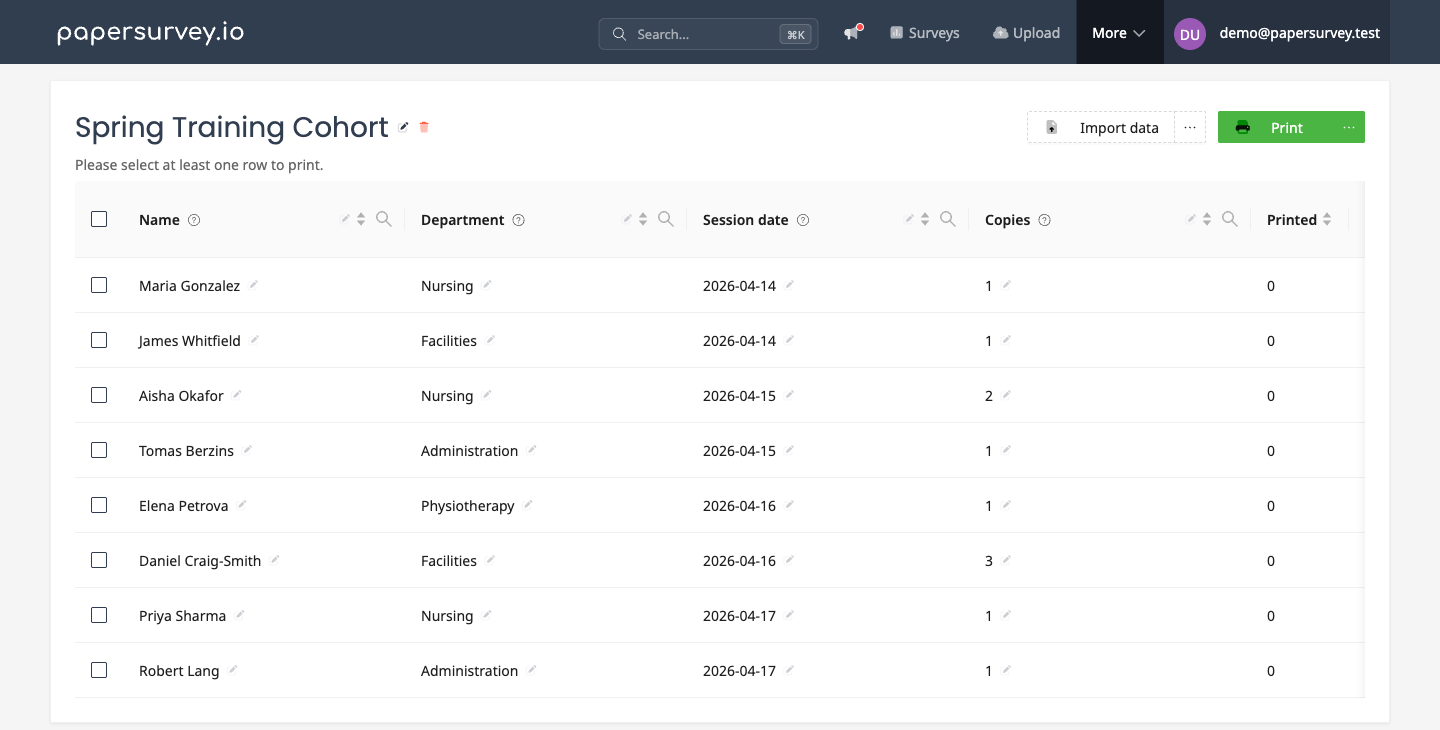
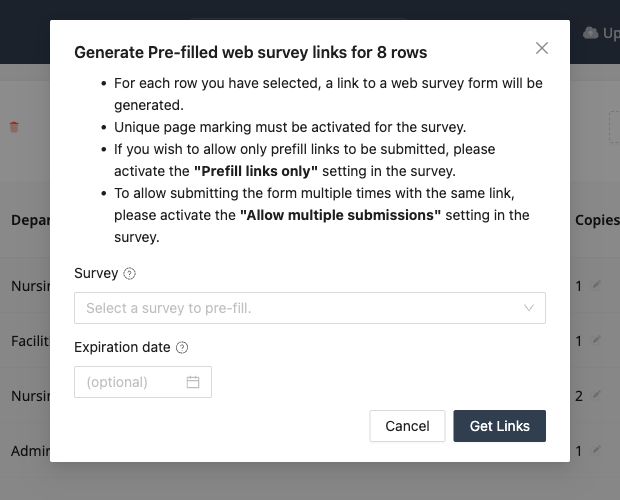
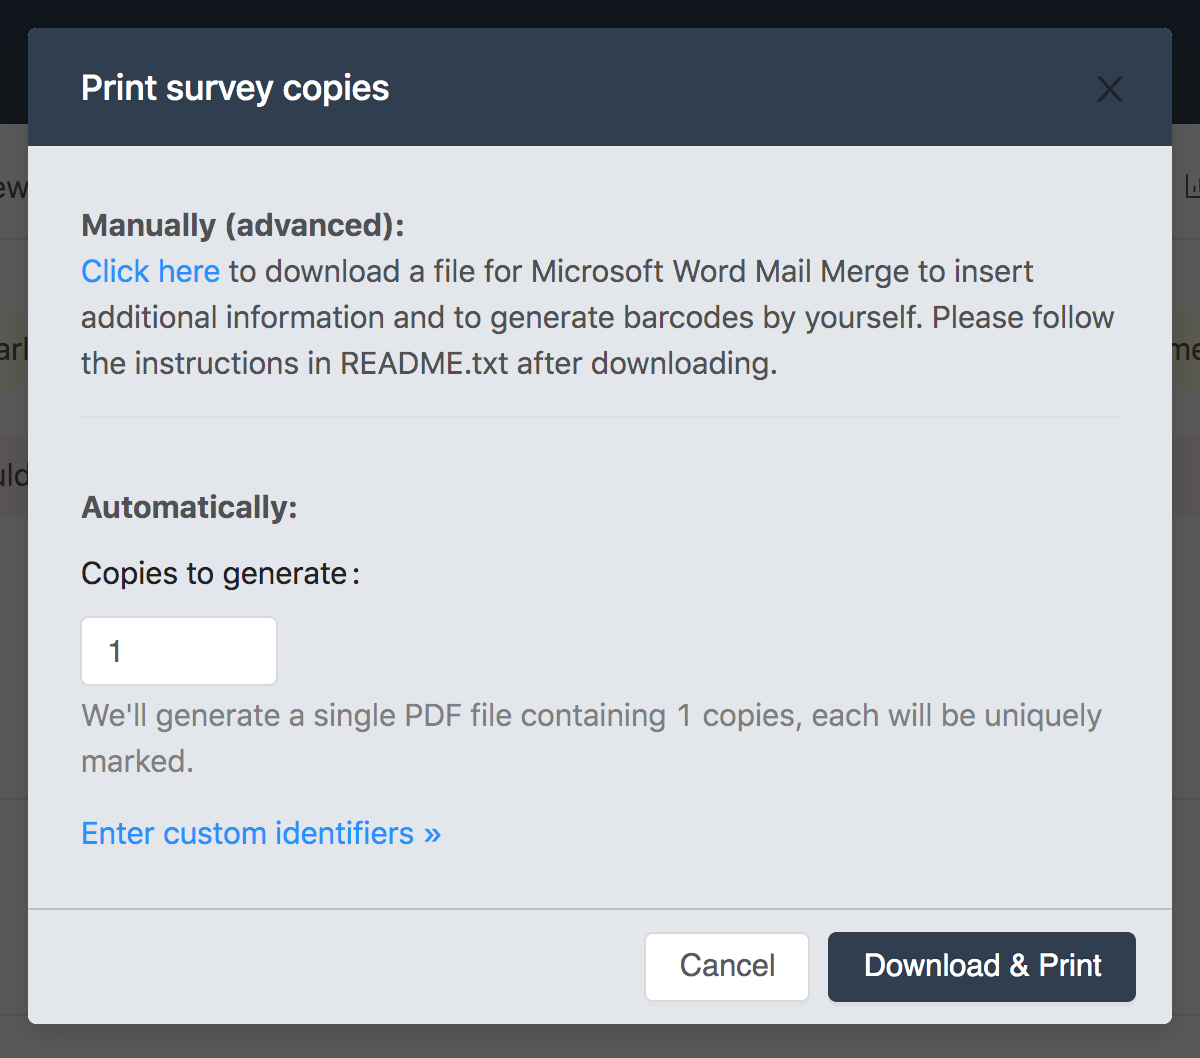
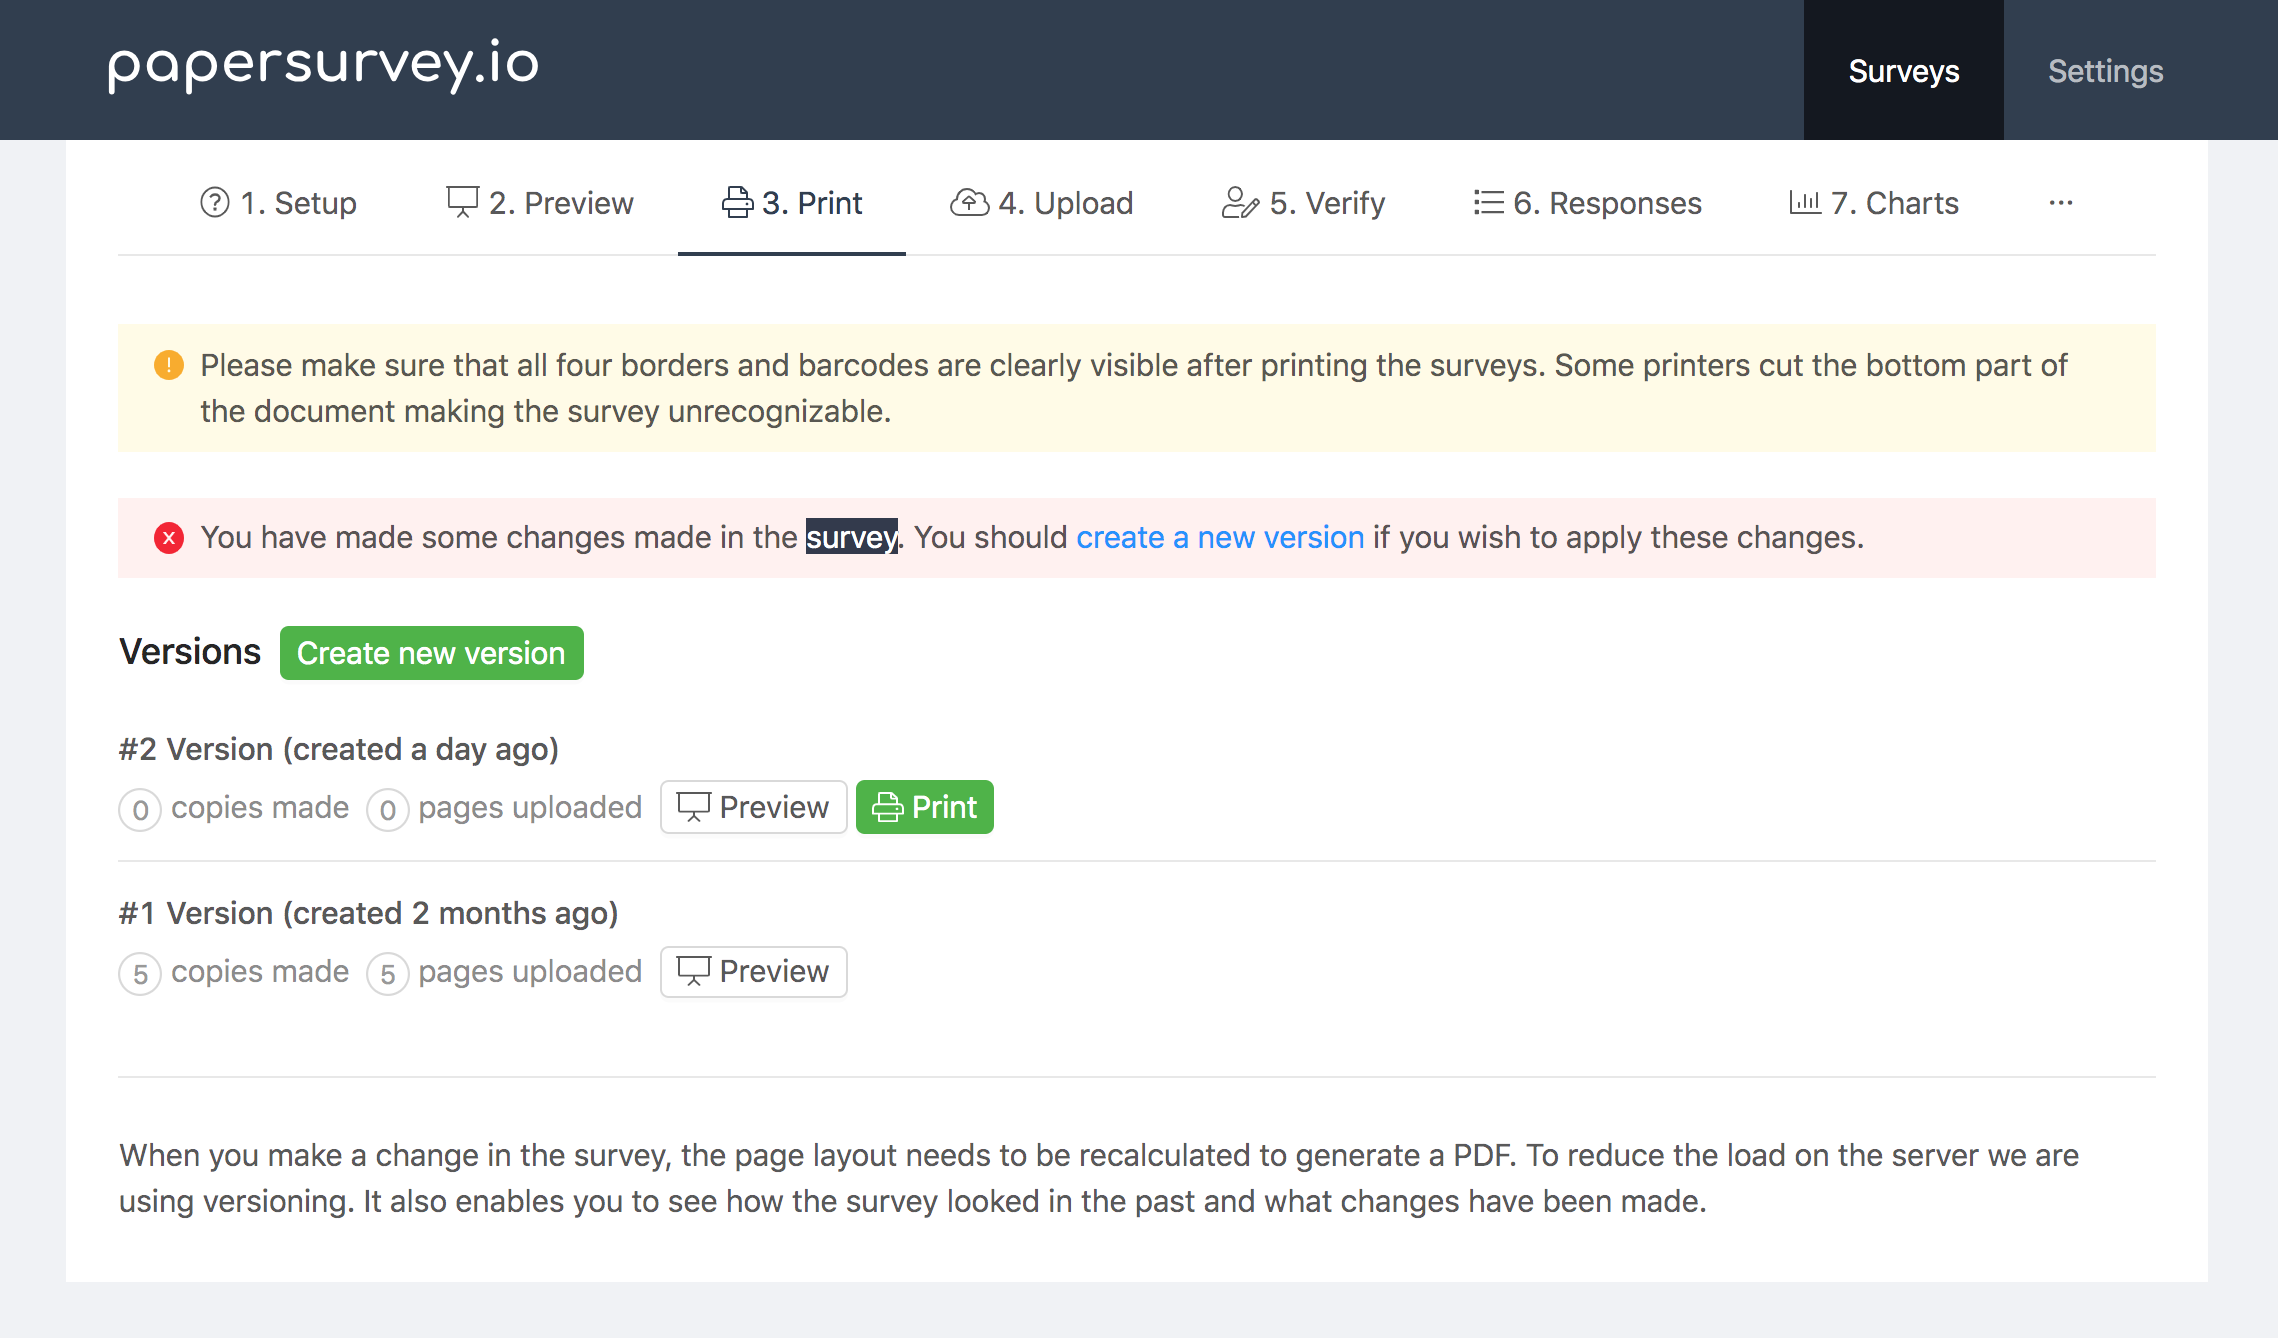
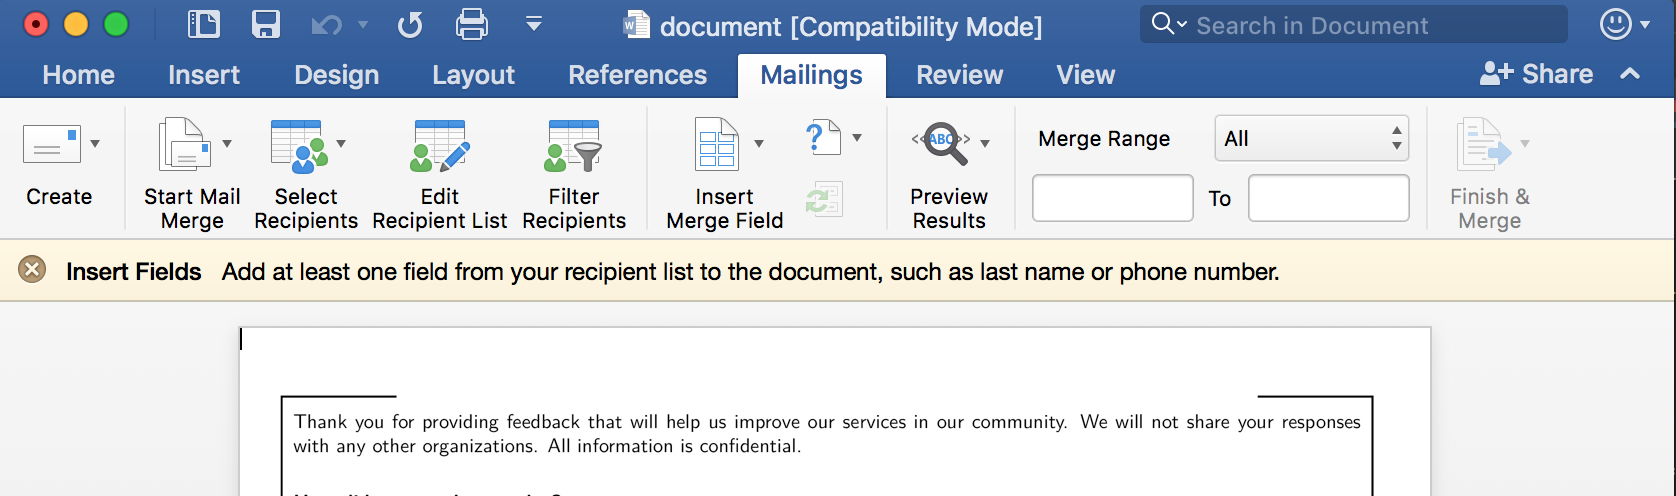
</p>
<p><a href="https://www.papersurvey.io">PaperSurvey.io</a> is one platform that handles this workflow end to end. You design your exam with a mix of question types, print it, administer it in a supervised exam hall, scan the completed scripts, and let the platform handle recognition and grading. Multiple-choice questions are graded automatically. Handwritten short-answer and essay responses are extracted and presented for efficient manual review.</p>
<h3>Designing Exams for Efficient Processing</h3>
<p>
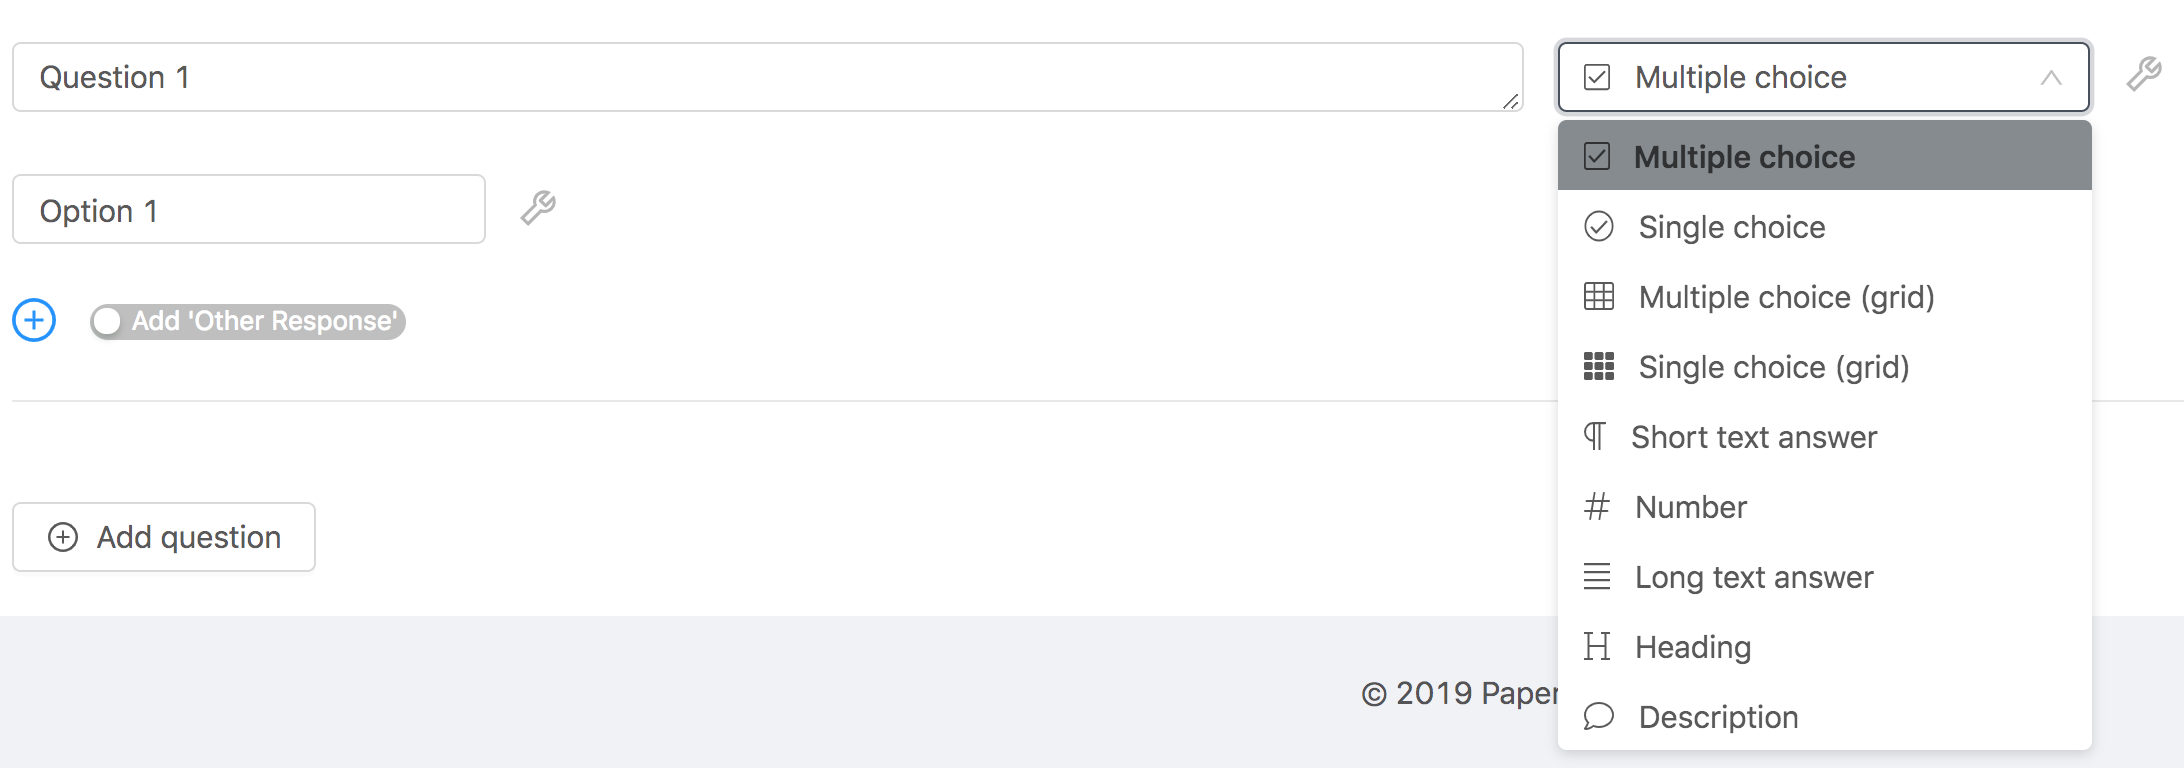
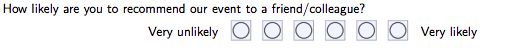
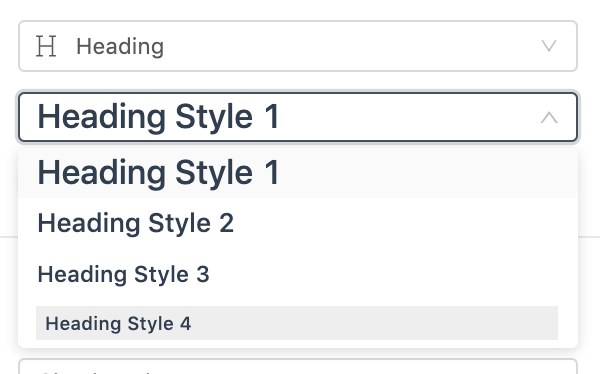
The key to making paper exams scalable is thoughtful design. Exams that use clear answer areas, consistent formatting, and a mix of automatically gradable and manually reviewed questions can be processed far faster than a stack of unstructured blue books.</p>
<p>
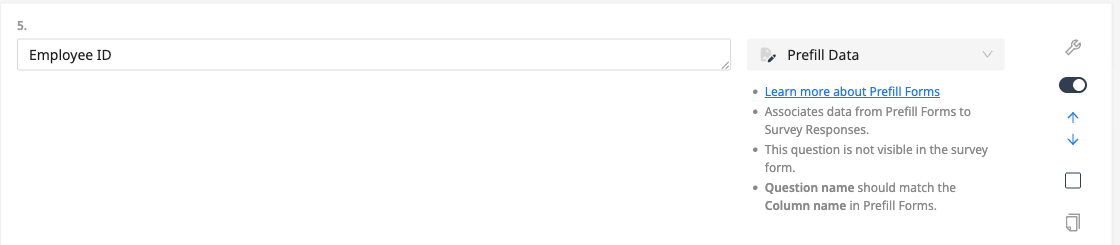
Structured answer sheets with designated response areas for each question allow scanning software to extract responses accurately. Multiple-choice sections can be graded instantly. Short-answer questions with defined answer boxes can be extracted and presented to graders in a standardized interface, rather than requiring them to flip through physical pages.</p>
<h3>
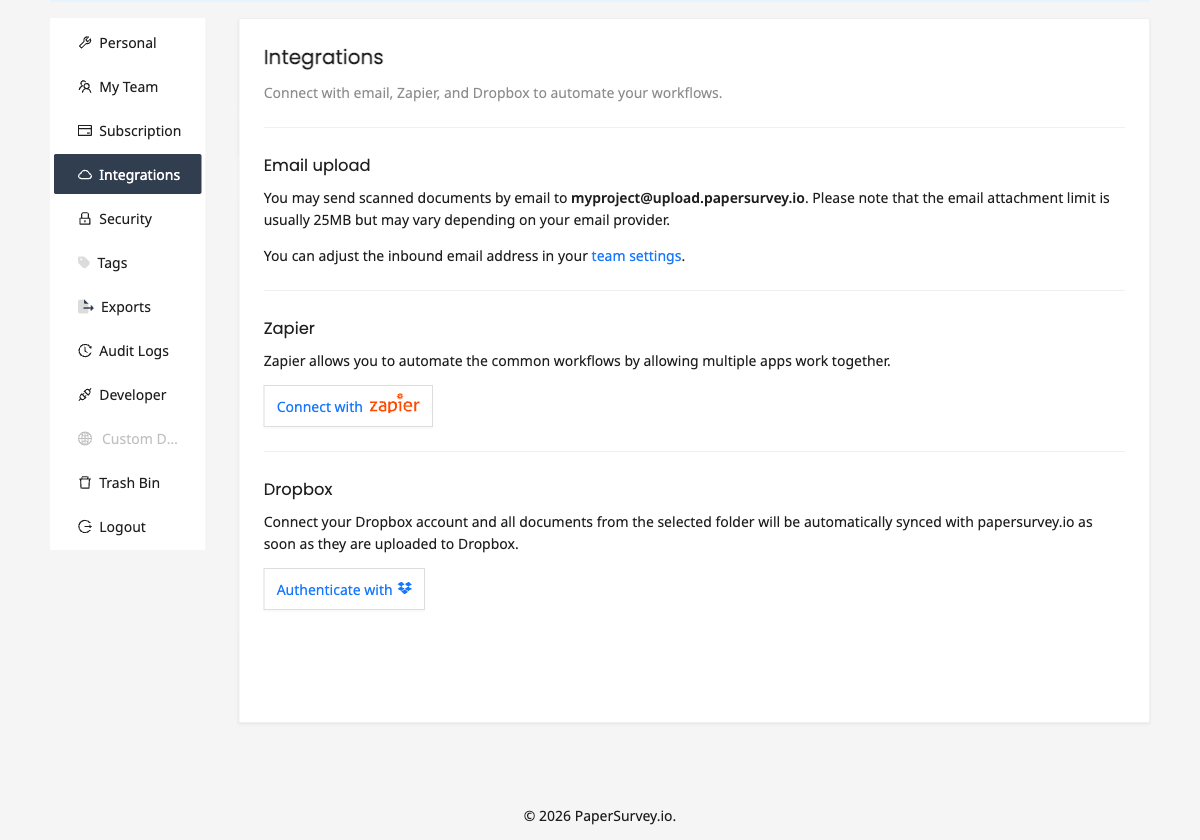
Integration with Existing Systems</h3>
<p>
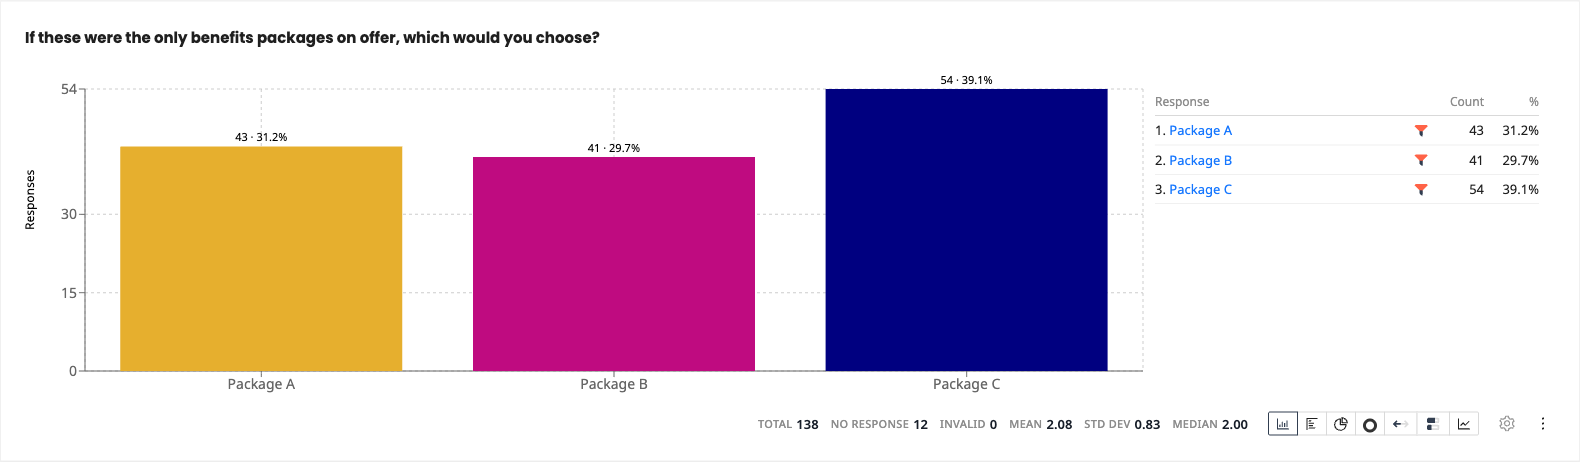
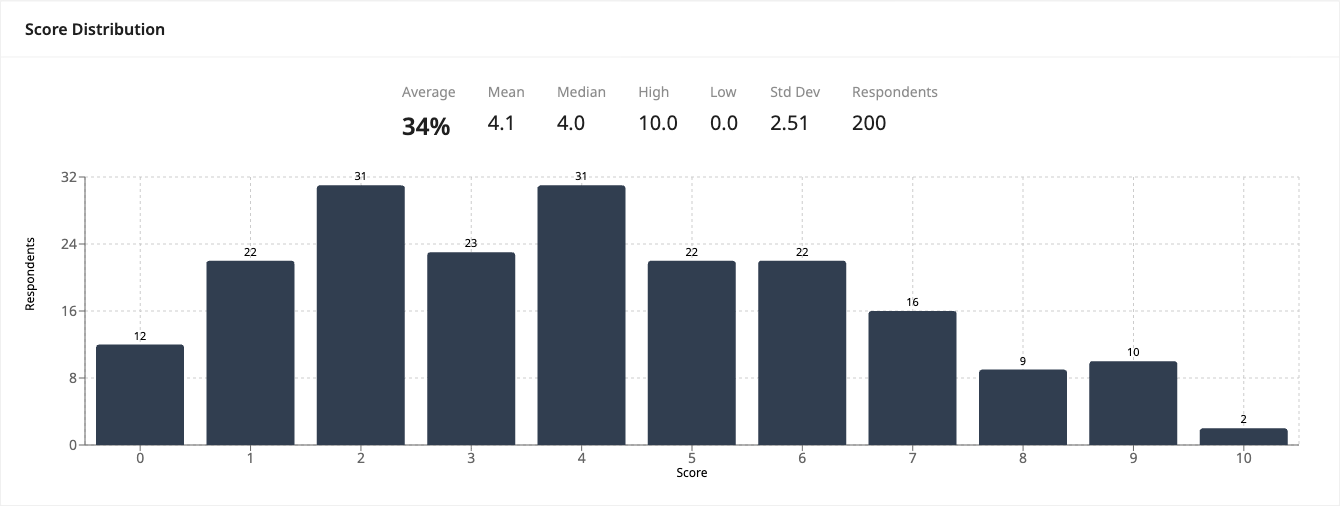
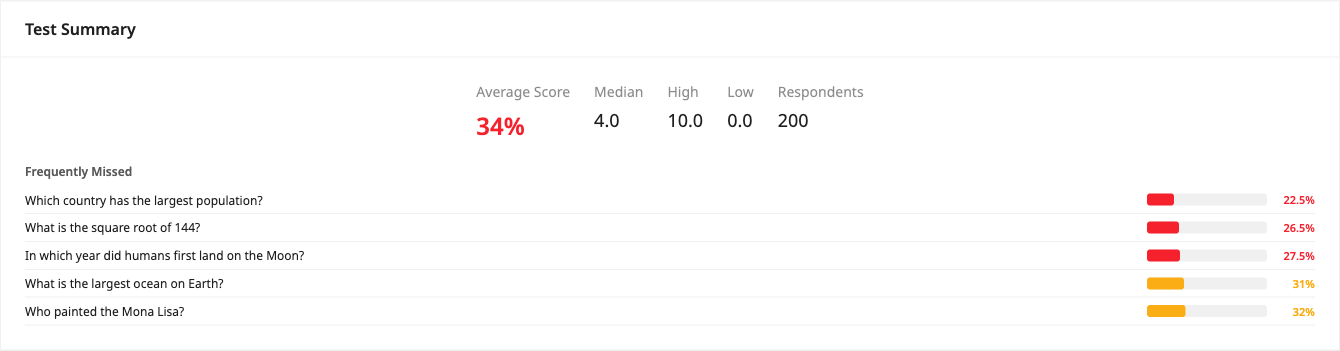
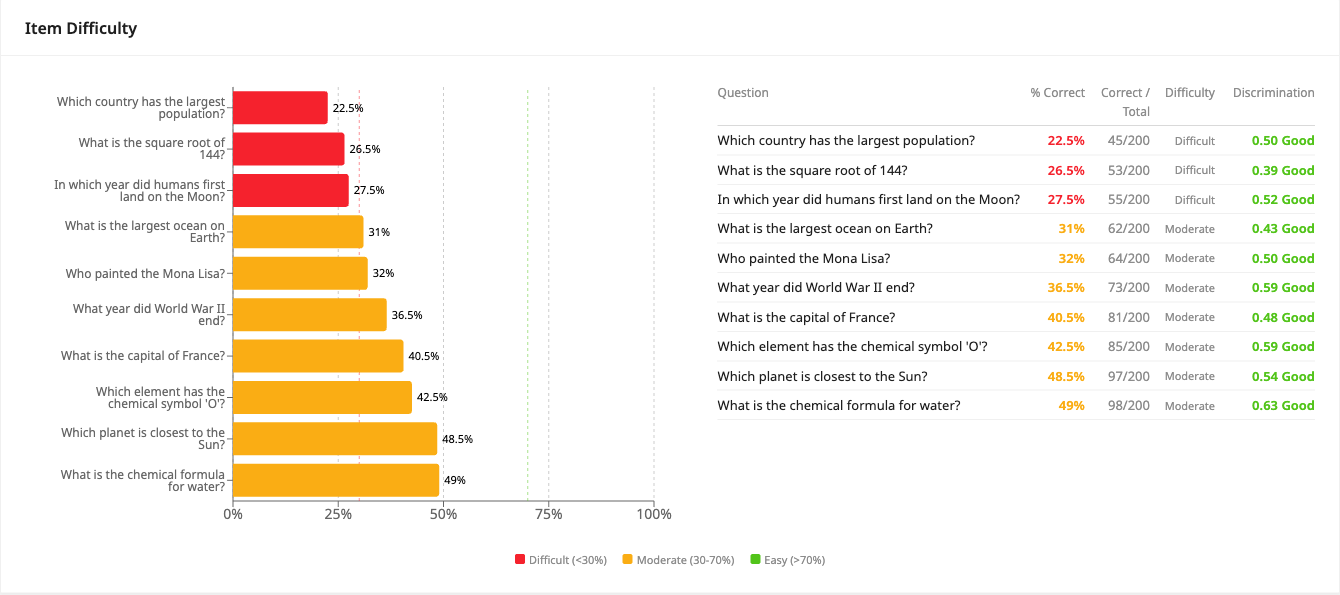
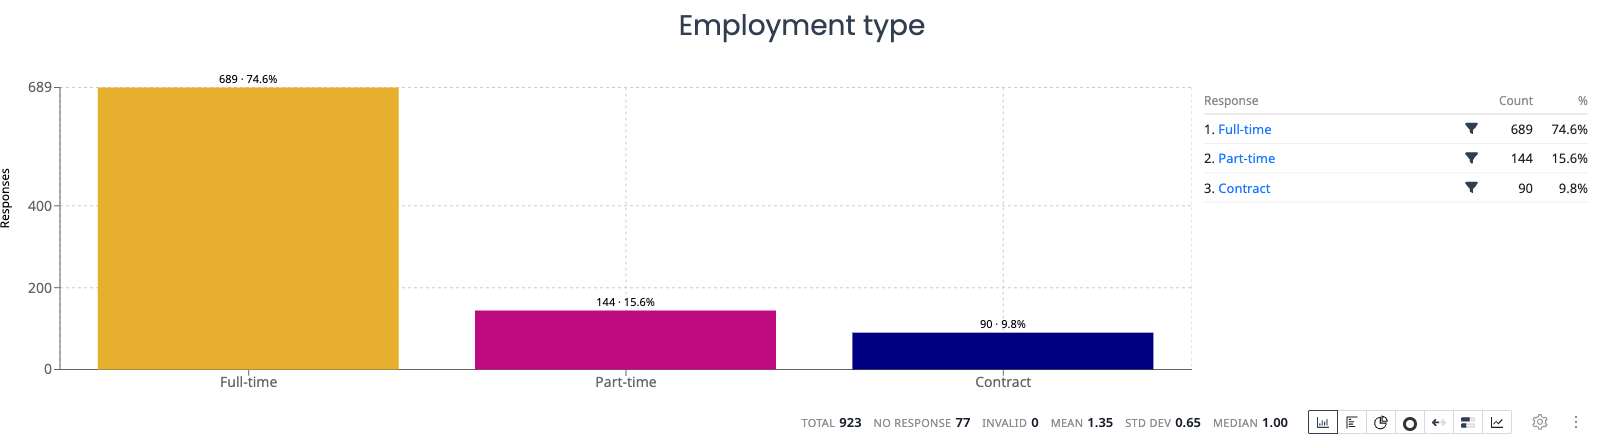
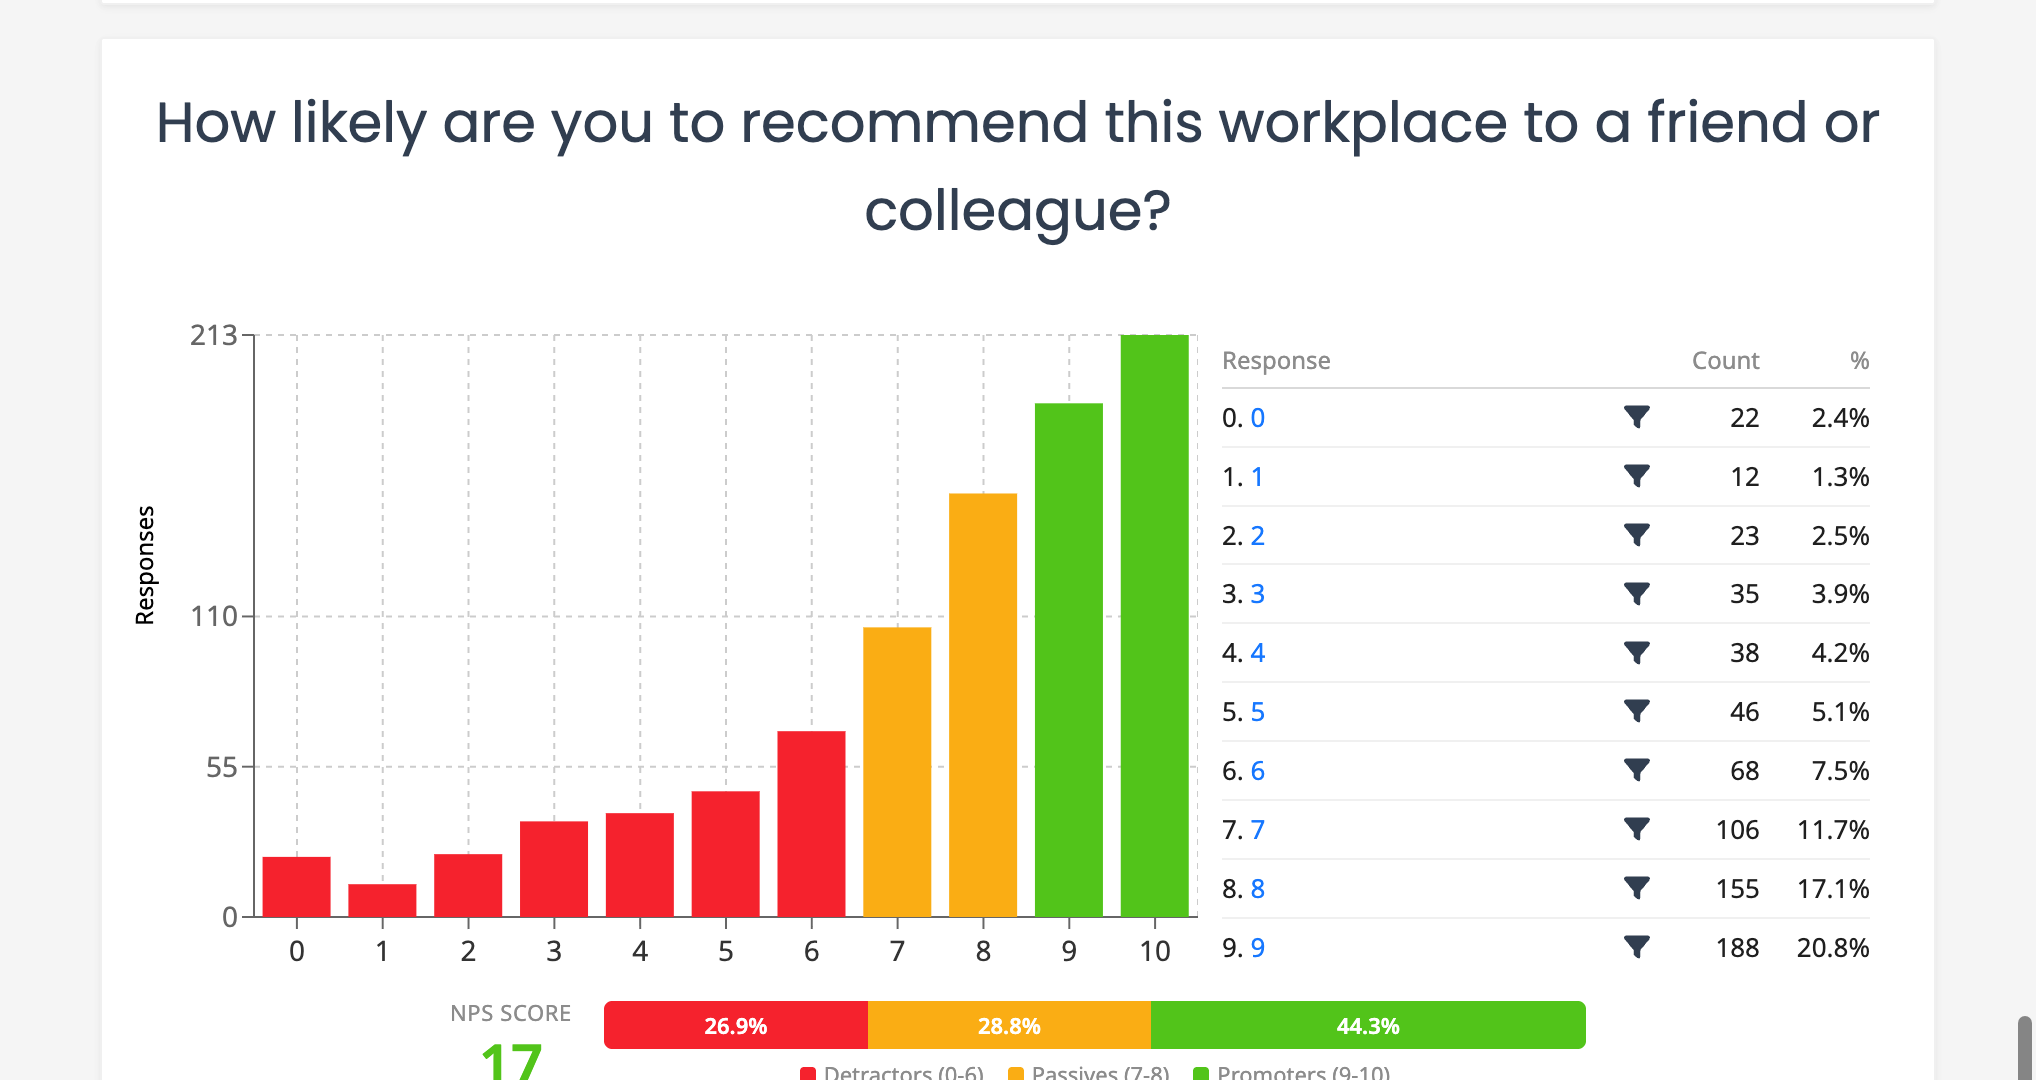
Modern exam processing platforms can export results in formats compatible with standard learning management systems and gradebook software. The data from scanned paper exams, including individual scores, item analysis, and score distributions, is just as analyzable as data from online assessments.</p>
<h2>What This Means for Academic Integrity</h2>
<p>The return to paper exams is part of a broader rethinking of academic integrity in the age of AI. Universities are recognizing that the integrity of an assessment depends not just on honor codes and detection tools, but on the conditions under which the assessment takes place.</p>
<p>Paper exams in supervised environments provide those conditions. They ensure that the work a student submits is the work that student produced, using the knowledge and skills they actually possess.</p>
<p>This does not mean AI should be banned from education. Many universities are simultaneously integrating AI into their teaching, encouraging students to use these tools for learning, research, and creative work. The distinction is between formative use (learning with AI) and summative assessment (demonstrating what you have learned without AI).</p>
<p>Paper exams serve the summative function. They answer the question that matters most for credentialing: can this student do this work on their own?</p>
<h2>Looking Forward</h2>
<p>The trend toward paper exams is likely to accelerate as AI capabilities continue to advance. Each new generation of language models makes digital assessment harder to secure. Meanwhile, the tools for processing paper exams at scale continue to improve, making the logistical objections less significant.</p>
<p>Universities that plan ahead, investing in exam design templates, scanning infrastructure, and processing workflows now, will be better positioned than those that scramble to react when the next AI advancement renders their current assessment methods obsolete.</p>
<p>The pen and paper exam is not a step backward. It is a pragmatic response to a genuine problem, supported by technology that makes it work at the scale modern institutions require. For any university grappling with AI and academic integrity, paper exams deserve serious consideration as part of the assessment portfolio.</p>
<p>If your institution is exploring paper-based exams and needs a scalable way to process them, <a href="https://www.papersurvey.io">PaperSurvey.io</a> provides the tools to design, scan, and grade paper assessments efficiently. You can focus on exam integrity while the platform handles the logistics.</p>]]>
            </summary>
                                    <updated>2026-04-26T08:45:23+00:00</updated>
        </entry>
            <entry>
            <title><![CDATA[AI-Generated Survey Responses: How Bots Are Corrupting Online Survey Data]]></title>
            <link rel="alternate" href="https://www.papersurvey.io/blog/ai-generated-survey-responses-corrupting-data" />
            <id>https://www.papersurvey.io/27</id>
            <author>
                <name><![CDATA[PaperSurvey.io]]></name>
            </author>
            <summary type="html">
                <![CDATA[<p>Online surveys have a growing credibility problem. AI-powered bots can now complete survey forms at scale, generating responses that are increasingly difficult to distinguish from genuine human answers. For researchers, market analysts, and anyone who depends on survey data for decision-making, this is not a theoretical concern. It is actively undermining data quality right now.</p>
<p>The problem extends beyond simple spam bots filling in random answers. Modern AI can read survey questions, understand context, generate plausible open-ended responses, and maintain internal consistency across a multi-page questionnaire. The result is datasets contaminated with fabricated responses that pass traditional quality checks.</p>
<h2>The Scale of the Problem</h2>
<h3>Bot Farms and GPT-Powered Form Fillers</h3>
<p>The barrier to generating fake survey responses has dropped to near zero. Anyone with basic programming skills can use a large language model API to read survey questions and generate contextually appropriate answers. Open-source tools for automating web form submission have existed for years, and adding AI-generated content to those tools is trivial.</p>
<p>On platforms like Amazon Mechanical Turk (MTurk) and Prolific, which researchers have long used to recruit survey participants, the problem has become acute. Studies published in 2023 and 2024 documented alarming rates of suspected bot responses on these platforms.</p>
<p>A study by Veselovsky, Ribeiro, and West (2023) estimated that between 33% and 46% of workers on MTurk may be using large language models to complete tasks, including surveys. The researchers found that traditional attention checks and quality filters failed to catch most of these AI-assisted responses.</p>
<p>Webb and Tangney (2023) found similar patterns, noting that AI-generated survey responses on crowdsourcing platforms were internally consistent, contextually appropriate, and often indistinguishable from human responses when evaluated by trained reviewers.</p>
<h3>Google Forms and Public Surveys</h3>
<p>The problem is not limited to research platforms. Any publicly accessible online survey is a target. Google Forms, SurveyMonkey, Typeform, and similar tools have no built-in mechanism to verify that a respondent is a real person providing genuine answers.</p>
<p>Organizations running customer feedback surveys, event evaluations, or public consultations are discovering that a meaningful portion of their responses may be fabricated. A municipal government running a public input survey might receive hundreds of AI-generated responses designed to skew results toward a particular outcome. A company running a product feedback survey might find that competitors or disgruntled parties have automated submissions to distort the data.</p>
<h3>Incentive-Driven Fraud</h3>
<p>When surveys offer compensation, whether gift cards, cash, or raffle entries, the incentive structure attracts automated responses. A $5 payment for a 10-minute survey becomes profitable to automate at scale. A single operator running AI-powered bots across hundreds of survey opportunities can generate significant income from fabricated responses.</p>
<p>This is not new. Survey fraud existed before AI. But AI has made the fraud far more sophisticated and far harder to detect. Previously, bot responses were often obvious: random selections, gibberish text, impossible completion times. Now, AI produces responses that look thoughtful, coherent, and human.</p>
<h2>Why Traditional Quality Checks Are Failing</h2>
<p>Survey researchers have developed numerous techniques for identifying low-quality or fraudulent responses. Most of these techniques were designed for a pre-AI world and are no longer sufficient.</p>
<h3>Attention Checks</h3>
<p>Attention checks, such as "Select 'Strongly Agree' for this question," are easily passed by AI that reads and understands the question text. These checks were designed to catch inattentive humans, not intelligent bots. An AI completing a survey will always pass attention checks because it processes every question fully.</p>
<h3>Completion Time Filters</h3>
<p>Researchers commonly flag responses completed in unusually short times. The assumption is that a genuine respondent cannot read and answer 30 questions in 90 seconds. But AI-powered form fillers can be configured to introduce realistic delays between questions, simulating human completion times. A well-designed bot completes a 15-minute survey in 12-18 minutes, falling well within the expected range.</p>
<h3>Straight-Line Detection</h3>
<p>Straight-lining, selecting the same response option for every Likert-scale question, is a classic indicator of low-quality data. AI does not straight-line. It generates varied, contextually appropriate responses that mirror realistic response patterns, including the natural variation that researchers look for as evidence of genuine engagement.</p>
<h3>Open-Ended Response Analysis</h3>
<p>Open-ended questions were once considered a reliable safeguard against bots. A question like "Describe a time when you experienced excellent customer service" would receive gibberish from a simple bot. AI, however, generates fluent, specific, and plausible narratives. It can describe a fictional experience at a fictional restaurant with enough detail and emotional nuance to pass human review.</p>
<p>Some researchers have attempted to use AI detection tools to identify AI-generated open-ended responses. These tools have the same reliability problems in survey contexts as they do in academic settings: high false-positive rates, inconsistent accuracy, and vulnerability to paraphrasing techniques.</p>
<h3>CAPTCHA and reCAPTCHA</h3>
<p>CAPTCHA systems add friction but do not solve the problem. CAPTCHA-solving services are cheap and widely available. More fundamentally, CAPTCHA verifies that a human (or a human-assisted service) is submitting the form. It does not verify that the human is providing genuine, thoughtful answers rather than AI-generated text.</p>
<h2>Why This Matters</h2>
<h3>Academic Research Validity</h3>
<p>Survey-based research is foundational in psychology, sociology, political science, public health, education, and marketing. If a meaningful fraction of responses in a study are AI-generated, the findings may be wrong.</p>
<p>Consider a psychology study examining attitudes toward climate change. If 15% of responses are AI-generated, and the AI's responses reflect the patterns in its training data rather than the attitudes of the target population, the study's conclusions are compromised. The researcher may not know this. The contaminated data may pass all standard quality checks. The paper may be published, cited, and used to inform policy.</p>
<p>This is not hypothetical. Researchers are increasingly expressing concern about the replicability of survey-based findings collected through online platforms after 2022.</p>
<h3>Market Research and Business Decisions</h3>
<p>Companies spend billions annually on survey-based market research. Product decisions, pricing strategies, brand positioning, and marketing campaigns are informed by survey data. If that data includes a significant share of AI-generated responses, the insights derived from it may be misleading.</p>
<p>A company testing a new product concept through an online survey might conclude that the concept has strong appeal when, in reality, the positive responses came from bots attracted by the survey incentive. The product launches, fails, and the company wonders why the research was wrong.</p>
<h3>Public Policy and Governance</h3>
<p>Government agencies and public institutions increasingly use online surveys for public consultation, needs assessments, and program evaluation. AI-generated responses can distort these processes, amplifying certain viewpoints artificially or obscuring genuine public opinion.</p>
<h2>How Paper Surveys Prevent AI Contamination</h2>
<p>Paper surveys have a natural defense against AI-generated responses: physical presence.</p>
<h3>Physical Presence Required</h3>
<p>A paper survey requires someone to physically hold a pen, read the questions, and write or mark their answers on paper. There is no API to automate this. There is no way to script a bot to fill in a paper form from a remote location. The respondent must be present, and their response is a physical artifact of their engagement.</p>
<p>This is not a technological solution layered on top of an inherently vulnerable process. It is an inherent property of the medium. Paper surveys are immune to AI-generated responses by their nature.</p>
<h3>Handwritten Responses Are Authentic</h3>
<p>When a respondent writes an open-ended answer by hand, the response carries markers of authenticity that typed text does not. Handwriting is individual. It shows hesitation, correction, emphasis, and the physical traces of thought. These characteristics are extremely difficult to fabricate at scale.</p>
<p>A researcher reviewing handwritten responses can be confident that each response was produced by a human being who was physically present and engaged with the question. This level of confidence is no longer available for online survey responses.</p>
<h3>No Incentive for Automation</h3>
<p>The economics of survey fraud depend on automation. A bot operator profits by submitting hundreds of responses per hour. Paper surveys cannot be automated. Each response requires physical effort, making large-scale fraud economically unviable. Even if someone wanted to submit fake paper responses, they would need to physically fill in and submit each form individually.</p>
<h3>Controlled Distribution</h3>
<p>Paper surveys can be distributed in controlled environments: classrooms, clinics, workplaces, community meetings, field research sites. The researcher knows who received a form and under what conditions. This contrasts with online surveys, where the researcher has limited visibility into who is actually completing the form and under what circumstances.</p>
<h2>A Balanced Approach</h2>
<p>This does not mean that every survey should be on paper. Online surveys remain appropriate for many applications, particularly when the population is geographically dispersed, the topic is low-stakes, and the risk of AI contamination is manageable.</p>
<p>But for research where data integrity is paramount, where findings will inform important decisions, or where the incentive structure creates a risk of automated fraud, paper surveys offer a level of data quality assurance that online surveys can no longer guarantee.</p>
<p>The practical barriers that once made paper surveys burdensome, such as manual data entry, physical storage, and slow processing, have been largely eliminated by modern scanning and recognition technology. Platforms like <a href="https://www.papersurvey.io">PaperSurvey.io</a> allow researchers to design paper surveys, distribute them, scan completed forms in bulk, and extract data automatically using OMR and OCR. The data ends up in the same digital format as online survey data, ready for analysis in SPSS, Excel, R, or any other statistical tool.</p>
<h2>Practical Recommendations</h2>
<p>If you are concerned about AI contamination in your survey data, consider the following:</p>
<p><strong>For high-stakes research,</strong> use paper surveys administered in controlled environments. This is the most reliable way to ensure data authenticity.</p>
<p><strong>For mixed-mode studies,</strong> combine paper and online data collection. Administer paper surveys to accessible populations and use online surveys for remote participants. Compare response patterns between modes to identify potential quality differences.</p>
<p><strong>For online surveys you cannot replace,</strong> layer multiple quality measures. Use a combination of open-ended questions, behavioral analysis, IP and geolocation checks, and post-hoc statistical screening. Accept that none of these measures are foolproof and report your data quality procedures transparently.</p>
<p><strong>For organizational surveys,</strong> such as employee engagement, patient satisfaction, or student evaluations, consider paper administration in controlled settings. The physical presence requirement ensures that the person completing the survey is a member of the target population.</p>
<h2>The Bigger Picture</h2>
<p>The rise of AI-generated survey responses is part of a broader challenge: maintaining trust in data collected through digital channels. As AI becomes more capable, the distinction between human-generated and machine-generated content will continue to blur in digital contexts.</p>
<p>Paper is not a complete solution to this challenge, but it is a remarkably effective one for survey research. The physical nature of the medium provides an authenticity guarantee that no amount of digital verification can match. For researchers and organizations that need to be confident in their data, paper surveys deserve serious consideration.</p>
<p><a href="https://www.papersurvey.io">PaperSurvey.io</a> makes paper-based data collection practical at any scale, with automated scanning, recognition, and export that eliminates the traditional downsides of paper. When data integrity matters, the medium matters too.</p>]]>
            </summary>
                                    <updated>2026-04-26T08:45:22+00:00</updated>
        </entry>
            <entry>
            <title><![CDATA[The Science of Questionnaire Layout: How Form Design Affects Response Quality]]></title>
            <link rel="alternate" href="https://www.papersurvey.io/blog/questionnaire-layout-design-affects-response-quality" />
            <id>https://www.papersurvey.io/35</id>
            <author>
                <name><![CDATA[PaperSurvey.io]]></name>
            </author>
            <summary type="html">
                <![CDATA[<p>Two surveys with identical questions can produce different data if they are laid out differently. This is not a theoretical concern. Decades of research in survey methodology demonstrate that visual design, spacing, question order, and formatting choices measurably affect how respondents interpret and answer questions.</p>
<p>Don Dillman and colleagues have documented these effects across multiple editions of their <em>Tailored Design Method</em>, and experimental studies in journals like <em>Public Opinion Quarterly</em>, <em>Field Methods</em>, and the <em>Journal of Survey Statistics and Methodology</em> have replicated them. The evidence is clear: questionnaire layout is not cosmetic. It is methodological.</p>
<h3>Visual Design Principles from Research</h3>
<p>Tourangeau, Couper, and Conrad (2004), in a widely cited paper in <em>Public Opinion Quarterly</em>, identified three heuristic principles that respondents use to interpret visual features of survey questions:</p>
<ol>
<li>
<p><strong>Middle means typical.</strong> Respondents interpret the visual midpoint of a scale as the "normal" or "average" response. If your scale is visually off-center due to uneven spacing, you will shift responses.</p>
</li>
<li>
<p><strong>Left and top mean first.</strong> In left-to-right reading cultures, the first option listed (top or left) receives a slight primacy advantage. Respondents are marginally more likely to choose options they encounter first.</p>
</li>
<li>
<p><strong>Near means related.</strong> Items placed close together are perceived as conceptually related. Items separated by white space or visual dividers are perceived as distinct.</p>
</li>
</ol>
<p>These principles apply to both paper and web surveys, but they are easier to control on paper because every respondent sees the same fixed layout. On web surveys, screen size, browser zoom, and responsive design can alter the visual relationships you intended.</p>
<h3>Spacing and White Space</h3>
<p>Dillman, Smyth, and Christian (2014) demonstrated experimentally that the amount of space between response options affects how respondents use rating scales. When response categories are evenly spaced, respondents treat the intervals as equal. When spacing is uneven, respondents infer that closer options are more similar and distant options are more different.</p>
<p>This finding has practical implications for paper form design. If your checkboxes for a 5-point satisfaction scale are not evenly spaced (perhaps because you compressed the layout to fit more questions on a page), you may introduce systematic measurement error.</p>
<p>Christian, Parsons, and Dillman (2009) tested the effect of visual spacing in open-ended questions. Larger answer boxes on paper forms elicited longer responses. Respondents used the size of the answer space as a cue for how much detail was expected. A small box suggests a brief answer. A large box suggests a detailed one.</p>
<p>For paper surveys, this means you can influence response length by design. If you want detailed qualitative feedback, allocate generous space for the answer. If you want a short factual response, use a smaller field.</p>
<h3>Font Size, Typeface, and Readability</h3>
<p>Research on form design consistently shows that readability affects completion rates and data quality.</p>
<p>Dillman et al. (2014) recommend a minimum font size of 10 points for body text and 12 points for older respondent populations. Fonts below 8 points increase item non-response (questions skipped by the respondent) and form abandonment.</p>
<p>For paper surveys specifically, serif fonts (like Times New Roman) and sans-serif fonts (like Arial or Helvetica) perform equivalently in readability studies, but consistency matters more than the specific choice. Mixing fonts within a questionnaire creates visual noise and reduces the professional appearance that encourages completion.</p>
<p>Bold and italic formatting should be used sparingly and consistently. Bold is effective for question stems. Italic works for response instructions ("Please mark one"). Using both randomly undermines the visual hierarchy that helps respondents navigate the form.</p>
<h3>Question Order Effects</h3>
<p>The sequence in which questions appear affects responses. This is among the most robust findings in survey methodology.</p>
<p>Schuman and Presser (1981), in their foundational work <em>Questions and Answers in Attitude Surveys</em>, documented multiple types of order effects:</p>
<ul>
<li><strong>Contrast effects.</strong> Rating a mediocre product after an excellent one produces lower ratings than rating the same mediocre product first.</li>
<li><strong>Consistency effects.</strong> After answering one question in a certain direction, respondents tend to answer related questions consistently.</li>
<li><strong>Saliency effects.</strong> Earlier questions prime concepts that influence how later questions are interpreted.</li>
</ul>
<p>The practical recommendation from Dillman et al. (2014) is to place easy, non-threatening questions first to build engagement, group related questions together, and place sensitive or demographic questions at the end. This sequencing reduces break-off rates and primes respondents positively for the survey experience.</p>
<p>On paper forms, question order is fixed for all respondents. This eliminates the randomization option available in web surveys but also eliminates the confound of different respondents seeing different sequences.</p>
<h3>Checkbox Design and Mark Recognition</h3>
<p>For paper surveys processed by OMR (Optical Mark Recognition), the design of checkboxes and response areas directly affects both the respondent experience and the accuracy of automated processing.</p>
<p>Research from the U.S. Census Bureau's questionnaire design studies (Dillman, 2000) established several principles:</p>
<ul>
<li><strong>Checkbox size matters.</strong> Larger checkboxes (4mm+) are easier for respondents to mark accurately, especially for older adults or respondents filling out forms on unstable surfaces.</li>
<li><strong>Shape consistency.</strong> Use circles for single-choice questions and squares for multiple-choice questions. This visual convention helps respondents understand whether they can select one or many options.</li>
<li><strong>Alignment.</strong> Vertically aligned response options with left-aligned checkboxes are easier to scan and complete than horizontal layouts for questions with more than four options.</li>
<li><strong>Spacing between options.</strong> Adequate vertical spacing between checkboxes reduces the risk of ambiguous marks that fall between two options.</li>
</ul>
<p>PaperSurvey.io generates forms with OMR-optimized checkbox sizing and spacing. Each form includes alignment markers and QR codes that the processing engine uses to locate response fields precisely, even when scans are slightly skewed or off-center.</p>
<h3>Grid (Matrix) Questions: Use With Caution</h3>
<p>Grid questions (matrices where multiple items share the same response scale) are space-efficient and visually organized. They are also prone to specific quality problems.</p>
<p>Couper, Traugott, and Lamias (2001) found that grid questions produce more straight-lining (selecting the same response for every item) compared to the same items presented as individual questions. Respondents process grids faster and less carefully.</p>
<p>Tourangeau, Couper, and Conrad (2013) confirmed that grid layouts encourage satisficing behavior, particularly when the grid is long (more than 7-8 rows). Respondents develop a rhythm of marking the same column repeatedly rather than reading each item carefully.</p>
<p><strong>The practical recommendation</strong>: Use grids for up to 5-7 items when the items are clearly distinct and respondents are motivated. For longer batteries, break them into smaller grids separated by other question types. Avoid grids entirely for critical measurement items where response quality is paramount.</p>
<p>On paper forms, grids have an additional advantage: they are visually anchored. The column headers are always visible because the page does not scroll. This eliminates the web survey problem where respondents in a long grid lose sight of which column corresponds to which response label.</p>
<h3>Page Breaks and Visual Flow</h3>
<p>For multi-page paper surveys, where you break the page affects how respondents process the questionnaire.</p>
<p>Dillman et al. (2014) recommend never splitting a question across two pages. If a question and its response options cannot fit on the current page, move the entire question to the next page. Split questions increase skip rates and confuse respondents.</p>
<p>Similarly, a grid question should never be split across pages. If your matrix does not fit on one page, reduce the number of items or use a smaller layout.</p>
<p>Page numbering and section headers help respondents track their progress, which research shows reduces abandonment. A respondent who can see they are on "Page 3 of 4" or "Section 2: Your Experience" is more likely to continue than one who has no sense of how much remains.</p>
<h3>Color and Shading</h3>
<p>Dillman (2000) found that alternating row shading in grid questions improved tracking accuracy. Respondents were less likely to mark the wrong row when alternating light and white backgrounds distinguished adjacent items.</p>
<p>Color can also be used functionally: a light background color for instruction text distinguishes it from question text. However, heavy use of color on paper forms increases printing costs and can cause problems with OCR processing if dark backgrounds reduce the contrast between marks and the form surface.</p>
<p>For forms that will be processed by OMR, use color sparingly and ensure that response areas maintain high contrast (dark marks on a light background).</p>
<h3>The Cumulative Effect</h3>
<p>No single design choice will make or break your survey. But the cumulative effect of many small decisions, spacing, fonts, checkbox size, question order, grid length, page breaks, adds up. A well-designed questionnaire that follows evidence-based principles will produce measurably better data than one thrown together without attention to layout.</p>
<p>PaperSurvey.io applies many of these principles automatically. Forms generated by the platform use consistent spacing, properly sized checkboxes, clear section headers, and OMR-optimized layouts. You focus on the questions. The platform handles the visual design.</p>
<p><img src="/images/blog/screenshot-pdf-preview.png" alt="Printable paper survey form with properly designed layout" /></p>
<h3>References</h3>
<ul>
<li>Christian, L. M., Parsons, N. L., &amp; Dillman, D. A. (2009). Designing scalar questions for web surveys. <em>Sociological Methods &amp; Research</em>, 37(3), 393-425.</li>
<li>Couper, M. P., Traugott, M. W., &amp; Lamias, M. J. (2001). Web survey design and administration. <em>Public Opinion Quarterly</em>, 65(2), 230-253.</li>
<li>Dillman, D. A. (2000). <em>Mail and Internet Surveys: The Tailored Design Method</em> (2nd ed.). Wiley.</li>
<li>Dillman, D. A., Smyth, J. D., &amp; Christian, L. M. (2014). <em>Internet, Phone, Mail, and Mixed-Mode Surveys: The Tailored Design Method</em> (4th ed.). Wiley.</li>
<li>Schuman, H., &amp; Presser, S. (1981). <em>Questions and Answers in Attitude Surveys: Experiments on Question Form, Wording, and Context</em>. Academic Press.</li>
<li>Tourangeau, R., Couper, M. P., &amp; Conrad, F. (2004). Spacing, position, and order: Interpretive heuristics for visual features of survey questions. <em>Public Opinion Quarterly</em>, 68(3), 368-393.</li>
<li>Tourangeau, R., Couper, M. P., &amp; Conrad, F. (2013). "Up means good": The effect of screen position on evaluative ratings in web surveys. <em>Public Opinion Quarterly</em>, 77(S1), 69-88.</li>
</ul>
<p><a href="https://www.papersurvey.io/app/auth/register">Start your free trial</a> and design a professionally formatted paper survey in minutes.</p>]]>
            </summary>
                                    <updated>2026-04-26T08:45:23+00:00</updated>
        </entry>
            <entry>
            <title><![CDATA[Surveying Hard-to-Reach Populations: Methods That Work]]></title>
            <link rel="alternate" href="https://www.papersurvey.io/blog/surveying-hard-to-reach-populations" />
            <id>https://www.papersurvey.io/38</id>
            <author>
                <name><![CDATA[PaperSurvey.io]]></name>
            </author>
            <summary type="html">
                <![CDATA[<p>A national health survey conducted exclusively online will miss the populations most affected by health disparities: older adults without smartphones, rural residents without broadband, low-income families without reliable internet, and people experiencing homelessness with no fixed address for email invitations. These are not edge cases. They represent hundreds of millions of people worldwide.</p>
<p>The term "hard-to-reach" in survey methodology refers to populations that are difficult to sample, contact, or engage using standard survey approaches. For online surveys, any population without consistent internet access is hard to reach by definition. The consequences for data quality are severe: coverage bias that no statistical adjustment can fully correct.</p>
<p>Here is what published research and field practice say about reaching these populations effectively.</p>
<h3>Who Gets Missed by Online Surveys</h3>
<p>The Pew Research Center (2024) reports that approximately 6% of U.S. adults do not use the internet at all. This rises to 13% among adults aged 65 and older and 17% among adults with less than a high school education. Among adults in households earning less than $30,000 per year, 12% are offline entirely.</p>
<p>Globally, the International Telecommunication Union (2023) estimates that 2.6 billion people lack internet access. In sub-Saharan Africa, internet penetration is approximately 36%. In South Asia, it is approximately 48%.</p>
<p>These are not evenly distributed gaps. The populations excluded by online-only surveys differ systematically from those included. They are older, poorer, less educated, more rural, and more likely to belong to racial and ethnic minorities. When your survey misses these groups, your data does not just have a smaller sample. It has a biased sample.</p>
<p>Groves (2006), in a foundational article published in <em>Public Opinion Quarterly</em>, demonstrated that nonresponse bias is a function not just of who fails to respond but of how nonrespondents differ from respondents on the variables being measured. If health surveys miss the unhealthiest populations, the bias is directly on the outcome of interest.</p>
<h3>Older Adults and Residential Care Populations</h3>
<p>Survey research with older adults consistently shows higher response rates with paper-based methods. Jorm et al. (2015), in a study of adults aged 65 and older, found that mailed paper surveys achieved response rates 15 to 25 percentage points higher than equivalent online surveys in this age group.</p>
<p>For residents of care facilities, assisted living communities, and nursing homes, paper is often the only feasible option. These settings typically lack individual internet access for residents. Staff-assisted paper survey administration is the standard methodology used by organizations including the Centers for Medicare and Medicaid Services for the CAHPS surveys.</p>
<p>The CAHPS (Consumer Assessment of Healthcare Providers and Systems) program, run by the Agency for Healthcare Research and Quality, uses mailed paper surveys as the primary mode for surveying Medicare beneficiaries. Their methodological research found that paper-only and paper-first mixed-mode designs produced the highest response rates among older enrollees (Elliott et al., 2009).</p>
<h3>Rural and Remote Communities</h3>
<p>In rural areas of both developing and developed countries, internet access is inconsistent, mobile signal is unreliable, and the nearest survey administration site may be hours away.</p>
<p>The WHO's STEPS survey methodology (WHO, 2017) for chronic disease risk factor surveillance in low- and middle-income countries uses paper-based data collection as the primary method. Trained enumerators visit households, administer structured questionnaires on paper, and transport completed forms to central processing sites.</p>
<p>UNICEF's Multiple Indicator Cluster Surveys (MICS), which have been conducted in over 100 countries since 1995, use paper questionnaires administered by trained interviewers. The program has collected data from more than 300 surveys, reaching some of the most remote communities in the world.</p>
<p>In developed countries, the U.S. Census Bureau maintains a paper option for the decennial census specifically because online-only collection would miss rural, elderly, and low-connectivity households. The 2020 Census allowed internet response but sent paper questionnaires to all non-responding households as follow-up (U.S. Census Bureau, 2021).</p>
<h3>Refugee and Displaced Populations</h3>
<p>Surveying refugee populations presents challenges that are qualitatively different from standard survey research. Respondents may not have fixed addresses, stable phone numbers, or any internet access. They may not speak the language of the host country. They may be wary of providing personal information to organizations they do not trust.</p>
<p>Jacobsen and Landau (2003), writing in the <em>Journal of Refugee Studies</em>, outlined the methodological challenges of refugee research and recommended community-based sampling with in-person paper survey administration. Digital alternatives assume infrastructure and trust that may not exist.</p>
<p>Paper surveys administered by community health workers or trusted local organizations can navigate these barriers. Questionnaires printed in the respondent's language, administered face-to-face by a trained enumerator, and collected in sealed envelopes preserve both accessibility and confidentiality.</p>
<p><a href="https://www.papersurvey.io">PaperSurvey.io</a> supports over 30 languages for form content, making it possible to create survey instruments in Arabic, Dari, Somali, Ukrainian, or any other language needed for refugee populations. All language versions can feed into a single dataset for unified analysis.</p>
<h3>Incarcerated Populations</h3>
<p>Correctional facilities generally prohibit internet-connected devices for inmates. Survey research with incarcerated populations, which is essential for criminal justice reform, health services research, and reentry program evaluation, must use paper.</p>
<p>The Bureau of Justice Statistics' National Inmate Survey uses paper-based self-administered questionnaires for sensitive topics and interviewer-administered paper instruments for other sections (BJS, 2018). The choice of paper is not preference but necessity.</p>
<p>Confidentiality is particularly important in correctional settings. Paper surveys placed in sealed envelopes by respondents provide a level of perceived privacy that is difficult to replicate with digital tools in a supervised environment.</p>
<h3>People Experiencing Homelessness</h3>
<p>Point-in-time counts and needs assessments for people experiencing homelessness rely almost entirely on in-person, paper-based survey administration. The U.S. Department of Housing and Urban Development's Annual Homeless Assessment Report methodology uses street-level enumeration with paper forms (HUD, 2023).</p>
<p>These surveys are typically conducted by trained volunteers who approach individuals at shelters, soup kitchens, and known encampment areas. A paper form and a clipboard are the standard tools. There is no email invitation to send, no web link to share, and no assumption of device ownership.</p>
<h3>Children and Adolescents in School Settings</h3>
<p>For research involving children and adolescents, school-based paper survey administration remains the most effective method. The CDC's Youth Risk Behavior Surveillance System (YRBSS) uses paper-and-pencil self-administered questionnaires in classrooms, achieving response rates above 60% consistently (Brener et al., 2013).</p>
<p>The classroom setting provides a controlled environment where surveys can be administered to large groups simultaneously. Students complete the questionnaire during a class period, place it in an unmarked envelope, and return it to the administrator. This procedure maintains anonymity while achieving near-complete participation among attendees.</p>
<p>Online alternatives administered outside of class time typically achieve response rates of 20-40% for the same populations, creating both response rate and representativeness problems.</p>
<h3>Workers Without Desk Jobs</h3>
<p>Manufacturing workers, agricultural laborers, construction crews, warehouse staff, delivery drivers, and other non-desk workers are systematically underrepresented in online employee surveys. They may not have company email addresses, dedicated workstations, or time during the workday to access web surveys.</p>
<p>Paper surveys distributed during shift meetings, training sessions, or break periods reach these workers where they are. Completion rates for paper surveys administered in workplace group settings consistently exceed those for email-distributed online surveys in the same organizations (Baruch &amp; Holtom, 2008).</p>
<h3>The Paper Workflow for Hard-to-Reach Populations</h3>
<p>The challenge with paper survey research in hard-to-reach populations has never been the data collection. It has been getting the data from paper into a usable digital format. Modern OCR eliminates this bottleneck.</p>
<p>With PaperSurvey.io:</p>
<ol>
<li><strong>Design</strong> your instrument in the online builder with support for multiple question types and 30+ languages</li>
<li><strong>Print</strong> on any paper, with any printer, in any quantity</li>
<li><strong>Distribute</strong> to enumerators, field teams, community workers, or mail directly to respondents</li>
<li><strong>Collect</strong> completed forms at field sites, no electricity or internet needed during collection</li>
<li><strong>Scan</strong> completed forms with any scanner or phone camera when connectivity is available</li>
<li><strong>Upload</strong> via browser, email, or Dropbox for automatic processing</li>
<li><strong>Export</strong> structured data to Excel, CSV, or SPSS for analysis</li>
</ol>
<p>The technology handles the data entry. Your field team focuses on reaching the people who matter.</p>
<h3>References</h3>
<ul>
<li>Baruch, Y., &amp; Holtom, B. C. (2008). Survey response rate levels and trends in organizational research. <em>Human Relations</em>, 61(8), 1139-1160.</li>
<li>Brener, N. D., Kann, L., Shanklin, S., et al. (2013). Methodology of the Youth Risk Behavior Surveillance System. <em>Morbidity and Mortality Weekly Report</em>, 62(RR-1), 1-20.</li>
<li>Bureau of Justice Statistics. (2018). <em>National Inmate Survey: Survey Methodology</em>. U.S. Department of Justice.</li>
<li>Elliott, M. N., Zaslavsky, A. M., Goldstein, E., et al. (2009). Effects of survey mode, patient mix, and nonresponse on CAHPS hospital survey scores. <em>Health Services Research</em>, 44(2p1), 501-518.</li>
<li>Groves, R. M. (2006). Nonresponse rates and nonresponse bias in household surveys. <em>Public Opinion Quarterly</em>, 70(5), 646-675.</li>
<li>HUD. (2023). <em>Annual Homeless Assessment Report to Congress</em>. U.S. Department of Housing and Urban Development.</li>
<li>International Telecommunication Union. (2023). <em>Facts and Figures: Focus on Least Developed Countries</em>.</li>
<li>Jacobsen, K., &amp; Landau, L. B. (2003). The dual imperative in refugee research. <em>Journal of Refugee Studies</em>, 16(2), 185-205.</li>
<li>Jorm, L. R., et al. (2015). Participation in health surveys by older adults. <em>BMC Medical Research Methodology</em>, 15, 104.</li>
<li>Pew Research Center. (2024). <em>Internet/Broadband Fact Sheet</em>.</li>
<li>U.S. Census Bureau. (2021). <em>2020 Census Operational Quality Metrics</em>.</li>
<li>WHO. (2017). <em>STEPwise Approach to NCD Risk Factor Surveillance (STEPS)</em>. World Health Organization.</li>
</ul>
<p><a href="https://www.papersurvey.io/app/auth/register">Start your free trial</a> and design a multilingual survey for your next field project.</p>]]>
            </summary>
                                    <updated>2026-04-30T14:15:48+00:00</updated>
        </entry>
            <entry>
            <title><![CDATA[Likert Scales: Designing Rating Questions That Produce Reliable Data]]></title>
            <link rel="alternate" href="https://www.papersurvey.io/blog/likert-scales-designing-rating-questions" />
            <id>https://www.papersurvey.io/32</id>
            <author>
                <name><![CDATA[PaperSurvey.io]]></name>
            </author>
            <summary type="html">
                <![CDATA[<p>Rensis Likert introduced the summated rating scale in 1932. Nearly a century later, the Likert scale remains the most widely used question format in survey research. You have filled them out hundreds of times: "On a scale of 1 to 5, how satisfied are you with our service?"</p>
<p>But the simplicity of the format hides real design decisions that affect the quality of your data. The number of points, the labels you use, whether you include a midpoint, and how you lay out the scale on the page all influence how respondents answer and how reliable those answers are.</p>
<p>The good news is that these questions have been studied extensively. Here is what the psychometric research says about designing Likert scales that produce accurate, reliable data.</p>
<h3>How Many Points? The 5 vs 7 Debate</h3>
<p>The most common Likert scale lengths are 5 and 7 points. Researchers have tested scales ranging from 2 points to 11 points and beyond. The evidence is clear on some things and nuanced on others.</p>
<p>Preston and Colman (2000), published in <em>Educational and Psychological Measurement</em>, tested scales with 2, 3, 4, 5, 6, 7, 8, 9, and 10 response categories. They found that scales with fewer than 5 points produced lower reliability and validity. Scales with 7 to 10 points performed best on measures of reliability, validity, and respondent preference. But the gains beyond 7 points were marginal.</p>
<p>Krosnick and Presser (2010), in the <em>Handbook of Survey Research</em>, reviewed a large body of evidence and concluded that 5-point and 7-point scales are generally optimal. Scales with fewer points lose information. Scales with more points create cognitive burden without proportional gains in measurement precision.</p>
<p>Simms, Zelazny, Williams, and Bernstein (2019) found that 6-point scales (with no midpoint) produced slightly higher reliability than 5-point scales in personality measurement, but the practical difference was small.</p>
<p><strong>The practical recommendation</strong>: Use 5 points for simple evaluations where respondents need to answer quickly (customer feedback, event ratings, classroom evaluations). Use 7 points when you need finer discrimination and your respondents have time and motivation to distinguish between levels (academic research, psychometric instruments, organizational surveys).</p>
<h3>To Include a Midpoint or Not</h3>
<p>A 5-point scale has a midpoint (typically labeled "Neutral" or "Neither agree nor disagree"). A 4-point or 6-point scale forces respondents to lean one direction or the other.</p>
<p>The argument for removing the midpoint is that it reduces "fence-sitting," where respondents choose the middle option to avoid committing to a position. The argument for including it is that some respondents genuinely hold neutral opinions, and forcing them to choose a side introduces measurement error.</p>
<p>Kulas and Stachowski (2009), published in the <em>Journal of Research in Personality</em>, found that including a midpoint did not significantly reduce the reliability of scales. Respondents who selected the midpoint were genuinely less extreme in their attitudes, not simply avoiding the question.</p>
<p>Krosnick (1991) documented a phenomenon called "satisficing," where respondents choose the easiest acceptable answer rather than the most accurate one. Midpoints can attract satisficers who use it as a shortcut. However, removing the midpoint does not eliminate satisficing; it just forces it into adjacent categories.</p>
<p>Nadler, Weston, and Voyles (2015) found that scales with midpoints produced equivalent reliability to scales without them, and respondents reported a slight preference for scales that included a neutral option.</p>
<p><strong>The practical recommendation</strong>: Include a midpoint for most surveys. Remove it only when you specifically need to force a directional response and your respondents understand why.</p>
<h3>Label Every Point or Just the Endpoints</h3>
<p>Some scales label only the two endpoints ("Very dissatisfied" to "Very satisfied"). Others label every point. The research favors full labeling.</p>
<p>Krosnick and Presser (2010) found that fully labeled scales produce higher reliability than partially labeled ones. When only endpoints are labeled, respondents must infer what the intermediate points mean. Different respondents make different inferences, introducing noise.</p>
<p>Menold, Kaczmirek, Lenzner, and Neusar (2014) confirmed that fully labeled scales reduced measurement error compared to endpoint-only labeled scales, particularly for respondents with lower educational attainment.</p>
<p>On paper surveys, fully labeling each point also has a practical advantage: it makes the form self-explanatory. A respondent does not need to mentally interpolate between "Strongly agree" and "Strongly disagree" to figure out what a "3" means.</p>
<p><img src="/images/blog/chart-type-likert.png" alt="Likert scale analysis showing structured survey results" /></p>
<p><strong>The practical recommendation</strong>: Label every point. Use clear, unambiguous labels that form a logical progression. Avoid labels that respondents might interpret inconsistently.</p>
<h3>Scale Direction and Visual Layout</h3>
<p>Should your scale go from negative to positive (1 = Strongly disagree, 5 = Strongly agree) or positive to negative? Does it matter whether the positive end is on the left or right?</p>
<p>Hartley and Betts (2010) found a modest primacy effect in Likert scales: respondents are slightly more likely to select options presented earlier in the visual sequence. For left-to-right readers, this means the leftmost option gets a small advantage.</p>
<p>For paper surveys, this has a design implication. If you place the positive option on the left and the negative on the right, you may get slightly inflated positive responses compared to the reverse layout. The effect is small but measurable in large samples.</p>
<p>Tourangeau, Couper, and Conrad (2004) found that visual design features like spacing, alignment, and grouping affected how respondents interpreted and used rating scales. Scales where options were evenly spaced produced more reliable data than scales with uneven visual spacing.</p>
<p><strong>The practical recommendation</strong>: Be consistent within your survey. If "Strongly agree" is on the left for one question, keep it on the left for all questions. Ensure even visual spacing between all points. For paper forms, use checkboxes or circles of equal size with equal spacing.</p>
<h3>Agree/Disagree vs Item-Specific Scales</h3>
<p>The most common Likert format asks respondents to agree or disagree with a statement: "The training was useful" (Strongly disagree to Strongly agree). An alternative approach uses item-specific scales: "How useful was the training?" (Not at all useful to Extremely useful).</p>
<p>Saris, Revilla, Krosnick, and Shaeffer (2010) found that agree/disagree scales are more susceptible to acquiescence bias, the tendency for some respondents to agree with statements regardless of content. This bias is stronger among respondents with lower education and in cultures where deference to authority is valued.</p>
<p>Krosnick (1999) recommended item-specific scales as the default because they reduce acquiescence bias and produce higher validity. Instead of "Our customer service is excellent" (agree/disagree), use "How would you rate our customer service?" (Poor to Excellent).</p>
<p><strong>The practical recommendation</strong>: Use item-specific scales when possible. Reserve agree/disagree formats for statements where agreement is the natural response dimension (attitudes, beliefs, opinions).</p>
<h3>Paper vs Screen: Does the Medium Affect Responses?</h3>
<p>Research comparing Likert scale responses on paper versus screen has generally found equivalence in the data produced, with some notable differences in how respondents interact with the scales.</p>
<p>Denniston, Brener, Kann, Smith, and Lowry (2010) compared paper and computer-based administration of health behavior questionnaires and found no significant differences in response distributions for Likert-type items.</p>
<p>However, Tourangeau et al. (2004) found that visual presentation matters more on screen, where respondents may see different layouts depending on device and screen size. A scale that looks balanced on a desktop may appear lopsided on a phone. Paper scales are visually fixed: every respondent sees exactly the same layout.</p>
<p>For mixed-mode surveys where you collect responses on both paper and web, keeping the visual layout as similar as possible between modes reduces measurement differences. <a href="https://www.papersurvey.io">PaperSurvey.io</a> supports both paper and web responses for the same survey, allowing you to design one instrument that works across both modes.</p>
<h3>Common Mistakes in Likert Scale Design</h3>
<p>Psychometric research identifies several common errors:</p>
<p><strong>Double-barreled items.</strong> "The instructor was knowledgeable and engaging" asks about two things at once. A respondent who thinks the instructor was knowledgeable but not engaging cannot answer accurately. Ask one question per item.</p>
<p><strong>Leading wording.</strong> "Don't you agree that our service is excellent?" biases toward agreement. Use neutral wording: "How would you rate our service?"</p>
<p><strong>Inconsistent scale direction.</strong> Mixing scales where 1 = best and 1 = worst within the same survey confuses respondents and increases error rates (Weijters, Cabooter, &amp; Schillewaert, 2010).</p>
<p><strong>Too many items measuring the same construct.</strong> Survey fatigue increases with length. Cronbach's alpha (a measure of internal consistency) can be acceptable with as few as 3-4 well-designed items per construct. Adding more items produces diminishing returns in reliability while increasing respondent burden (Streiner, 2003).</p>
<p><strong>Using scales for factual questions.</strong> "How many times did you visit the doctor this year?" should not be answered on a Likert scale. Use specific response options or open numeric fields for factual questions.</p>
<h3>Designing Likert Scales for Paper Forms</h3>
<p>Paper forms have specific constraints that affect Likert scale design:</p>
<ul>
<li><strong>Space is limited.</strong> A 7-point scale with full labels takes more horizontal space than a 5-point scale. If your form has many Likert items, a 5-point scale may fit better without cramping the layout.</li>
<li><strong>Checkbox alignment matters.</strong> On paper, respondents mark boxes or circles with a writing instrument. Larger, well-spaced checkboxes reduce ambiguous marks that require manual verification during processing.</li>
<li><strong>Grid layouts save space.</strong> When you have multiple items on the same scale, a grid (matrix) layout with items as rows and scale points as columns is both space-efficient and easy for respondents to complete.</li>
<li><strong>Instruction clarity.</strong> Include a brief instruction above the scale: "Please mark one box per row." On paper, you cannot enforce this with form validation, so clear instructions reduce double-marking.</li>
</ul>
<p>PaperSurvey.io supports single-choice grids (Likert matrices) that print with properly spaced checkboxes and process automatically via OMR. Each response is read from the scanned form without manual data entry.</p>
<h3>References</h3>
<ul>
<li>Denniston, M. M., Brener, N. D., Kann, L., Smith, G., &amp; Lowry, R. (2010). Comparison of paper-and-pencil versus web administration of the Youth Risk Behavior Survey. <em>Journal of Adolescent Health</em>, 47(4), 424-428.</li>
<li>Hartley, J., &amp; Betts, L. R. (2010). Four layouts and a finding: The effects of changes in the order of the verbal labels and numerical values on Likert-type scales. <em>International Journal of Social Research Methodology</em>, 13(1), 17-27.</li>
<li>Krosnick, J. A. (1991). Response strategies for coping with the cognitive demands of attitude measures in surveys. <em>Applied Cognitive Psychology</em>, 5(3), 213-236.</li>
<li>Krosnick, J. A. (1999). Survey research. <em>Annual Review of Psychology</em>, 50, 537-567.</li>
<li>Krosnick, J. A., &amp; Presser, S. (2010). Question and questionnaire design. In P. V. Marsden &amp; J. D. Wright (Eds.), <em>Handbook of Survey Research</em> (2nd ed.). Emerald.</li>
<li>Kulas, J. T., &amp; Stachowski, A. A. (2009). Middle category endorsement in odd-numbered Likert response scales. <em>Journal of Research in Personality</em>, 43(3), 489-493.</li>
<li>Likert, R. (1932). A technique for the measurement of attitudes. <em>Archives of Psychology</em>, 22(140), 1-55.</li>
<li>Menold, N., Kaczmirek, L., Lenzner, T., &amp; Neusar, A. (2014). How do respondents attend to verbal labels in rating scales? <em>Field Methods</em>, 26(1), 21-39.</li>
<li>Nadler, J. T., Weston, R., &amp; Voyles, E. C. (2015). Stuck in the middle: The use and interpretation of mid-points in items on questionnaires. <em>Journal of General Psychology</em>, 142(2), 71-89.</li>
<li>Preston, C. C., &amp; Colman, A. M. (2000). Optimal number of response categories in rating scales. <em>Acta Psychologica</em>, 104(1), 1-15.</li>
<li>Saris, W. E., Revilla, M., Krosnick, J. A., &amp; Shaeffer, E. M. (2010). Comparing questions with agree/disagree response options to questions with item-specific response options. <em>Survey Research Methods</em>, 4(1), 61-79.</li>
<li>Simms, L. J., Zelazny, K., Williams, T. F., &amp; Bernstein, L. (2019). Does the number of response options matter? <em>Psychological Assessment</em>, 31(4), 557-566.</li>
<li>Streiner, D. L. (2003). Starting at the beginning: An introduction to coefficient alpha and internal consistency. <em>Journal of Personality Assessment</em>, 80(1), 99-103.</li>
<li>Tourangeau, R., Couper, M. P., &amp; Conrad, F. (2004). Spacing, position, and order: Interpretive heuristics for visual features of survey questions. <em>Public Opinion Quarterly</em>, 68(3), 368-393.</li>
<li>Weijters, B., Cabooter, E., &amp; Schillewaert, N. (2010). The effect of rating scale format on response styles. <em>International Journal of Research in Marketing</em>, 27(3), 236-247.</li>
</ul>
<p><a href="https://www.papersurvey.io/app/auth/register">Start your free trial</a> and design your first Likert scale survey for paper or web.</p>]]>
            </summary>
                                    <updated>2026-04-26T08:45:23+00:00</updated>
        </entry>
            <entry>
            <title><![CDATA[A Guide to Optical Mark Recognition (OMR) for Schools and Universities]]></title>
            <link rel="alternate" href="https://www.papersurvey.io/blog/guide-to-optical-mark-recognition-omr-for-schools-and-universities" />
            <id>https://www.papersurvey.io/25</id>
            <author>
                <name><![CDATA[PaperSurvey.io]]></name>
            </author>
            <summary type="html">
                <![CDATA[<p>Schools and universities process enormous volumes of paper forms every year. Exam answer sheets, course evaluations, enrollment forms, feedback surveys, and attendance records all generate stacks of paper that someone has to turn into usable data.</p>
<p>Optical Mark Recognition (OMR) automates this process by reading marks on paper, such as filled bubbles, checkboxes, and handwritten responses, and converting them into structured digital data. This guide covers how educational institutions can use OMR effectively, what to look for in a solution, and how to get started.</p>
<h3>What is OMR and How Does It Work?</h3>
<p>OMR technology detects the presence or absence of marks in predefined areas of a printed form. When a student fills in a bubble on an answer sheet, darkens a checkbox on an evaluation form, or writes a response in a designated field, the OMR system reads the scanned image and records the result.</p>
<p>Traditional OMR required specialized hardware, dedicated scanners with optical sensors, and pre-printed forms on specific paper stock. Modern cloud-based OMR works differently. You design your form in a web application, print it on standard paper, scan completed forms with any scanner or smartphone, and upload the images for processing. The software handles the rest.</p>
<h3>Common OMR Use Cases in Education</h3>
<h4>Exam Grading</h4>
<p>Multiple-choice and true/false exams are the most common application. Students mark their answers on a printed sheet, teachers collect and scan the forms, and the system grades every response automatically. Results can be exported to a spreadsheet or grade book within minutes, even for hundreds of students.</p>
<p>This is particularly valuable for large lecture courses where manual grading would take days. A single upload can process an entire class worth of exams in under a minute.</p>
<h4>Course Evaluations</h4>
<p>End-of-semester course evaluations are a fixture of higher education. Paper-based evaluations consistently achieve higher response rates than emailed survey links, often 80% or higher compared to 30-40% for online alternatives. Students complete the form in class before the final lecture ends, and the entire cohort is captured.</p>
<p>OMR processes Likert-scale ratings, multiple-choice questions, and even open-ended comments (via handwriting capture or designated text fields). Results are anonymized and aggregated automatically.</p>
<h4>Enrollment and Registration Forms</h4>
<p>Admissions offices, registrars, and student services departments handle thousands of forms during enrollment periods. Application forms, course registration sheets, and housing preference forms can all be designed for OMR processing, eliminating manual data entry and reducing transcription errors.</p>
<h4>Attendance Tracking</h4>
<p>Some institutions use OMR-scannable attendance sheets where students mark their ID number and section. This is common in large lecture halls where digital check-in systems are impractical or where internet connectivity is unreliable.</p>
<h4>Institutional Research and Surveys</h4>
<p>Student satisfaction surveys, campus climate assessments, and alumni questionnaires all benefit from paper distribution. OMR allows institutional research offices to gather representative data from populations that may not respond to email surveys.</p>
<h3>What to Look for in an OMR Solution for Education</h3>
<h4>No Special Paper or Hardware Required</h4>
<p>Legacy OMR systems required proprietary bubble sheets and dedicated scanners. Modern solutions work with standard A4 or Letter paper and any flatbed scanner, document feeder, or even a smartphone camera. This dramatically reduces cost and eliminates vendor lock-in.</p>
<h4>Flexible Form Design</h4>
<p>You need more than just bubbles. Look for support for multiple question types: multiple choice, checkboxes (select all that apply), Likert scales, short text fields, and open-ended responses. The ability to add instructions, headers, and section breaks makes forms clearer for students.</p>
<h4>Batch Processing</h4>
<p>Education generates volume. A solution needs to handle hundreds of scanned pages in a single upload without slowing down or requiring page-by-page processing.</p>
<h4>Verification and Error Handling</h4>
<p>No scanning system is perfect. Look for built-in verification that flags unclear marks, double selections, or poor scan quality. The ability for staff to review and correct flagged responses before finalizing results saves time and improves accuracy.</p>
<h4>Export Flexibility</h4>
<p>Grading data needs to go into your LMS or grade book. Survey data needs to go into your analytics tools. Look for export options including Excel, CSV, and SPSS. Integration with Google Sheets or a REST API adds automation possibilities.</p>
<h3>Getting Started with OMR at Your Institution</h3>
<p>The process is straightforward:</p>
<ol>
<li>
<p><strong>Design your form.</strong> Use an online form builder to create your exam, evaluation, or survey. Add the question types you need and arrange them on the page.</p>
</li>
<li>
<p><strong>Print.</strong> Print copies on standard paper using any printer. For exams, you can generate unique identifiers on each sheet to match responses to students.</p>
</li>
<li>
<p><strong>Distribute and collect.</strong> Hand out forms in class, mail them to alumni, or leave them at service desks. Collect completed forms as you normally would.</p>
</li>
<li>
<p><strong>Scan.</strong> Feed completed forms through a document scanner, or photograph them with a phone. Most flatbed scanners with an automatic document feeder can process a stack of 50 pages in under two minutes.</p>
</li>
<li>
<p><strong>Upload and process.</strong> Upload your scans to the OMR platform. Processing happens automatically. Review any flagged responses and approve the results.</p>
</li>
<li>
<p><strong>Export.</strong> Download your data in the format you need, or sync it directly to Google Sheets for real-time access.</p>
</li>
</ol>
<h3>Cost Considerations</h3>
<p>Paper-based OMR is remarkably cost-effective for education. The primary costs are printing (pennies per page on standard paper) and scanning time (minutes per batch). There are no proprietary bubble sheets to purchase and no dedicated hardware to maintain.</p>
<p>Compare this to dedicated scantron systems, which require ongoing purchases of branded answer sheets, or to manual data entry, which requires hours of staff time per batch. Cloud-based OMR pays for itself quickly, especially at scale.</p>
<h3>Privacy and Data Security</h3>
<p>Student data is protected by regulations like FERPA in the United States and GDPR in Europe. When selecting an OMR provider, verify that data is encrypted in transit and at rest, that processing servers are located in appropriate jurisdictions, and that the provider offers data deletion capabilities.</p>
<p>Paper forms themselves can be stored, archived, or shredded according to your institution's records retention policy, providing a clear chain of custody.</p>
<h3>Getting Started</h3>
<p><a href="https://www.papersurvey.io">PaperSurvey.io</a> provides a complete OMR workflow for educational institutions: design forms, print on standard paper, scan with any scanner, and export clean data to Excel, CSV, SPSS, or Google Sheets. Verification tools let staff review unclear responses before finalizing.</p>
<p>For universities that need bulk user accounts with shared page pools, <a href="https://www.papersurvey.io/universities">PaperSurvey for Universities</a> offers institutional plans starting from $7.96 per user per month, with support for multiple departments, SSO authentication, and volume pricing.</p>
<p><a href="https://www.papersurvey.io/app/auth/register">Start your free trial</a> to see how OMR can save your department hours of manual data entry every semester. No credit card required.</p>]]>
            </summary>
                                    <updated>2026-04-30T14:15:48+00:00</updated>
        </entry>
            <entry>
            <title><![CDATA[How Survey Incentives Affect Response Rates: A Research Summary]]></title>
            <link rel="alternate" href="https://www.papersurvey.io/blog/how-survey-incentives-affect-response-rates" />
            <id>https://www.papersurvey.io/31</id>
            <author>
                <name><![CDATA[PaperSurvey.io]]></name>
            </author>
            <summary type="html">
                <![CDATA[<p>If you want more people to complete your survey, should you offer an incentive? The short answer from decades of research is yes. The longer answer is that the type of incentive, when you offer it, and how you deliver it matter far more than the dollar amount.</p>
<p>This is not guesswork. Survey incentive effects are among the most studied topics in research methodology. Multiple meta-analyses covering hundreds of experiments give us clear, replicable findings on what works and what does not.</p>
<h3>The Core Finding: Incentives Increase Response Rates</h3>
<p>Church (1993) published one of the earliest comprehensive meta-analyses of incentive effects, reviewing 38 experimental studies. The finding was unambiguous: monetary incentives significantly increased mail survey response rates, with an average improvement of 19.1 percentage points.</p>
<p>Singer, Van Hoewyk, Gebler, Raghunathan, and McGonagle (1999) extended this work and found similar effects. Across their review, incentives of any kind improved response rates compared to no-incentive controls.</p>
<p>The most comprehensive meta-analysis to date is Singer and Ye (2013), published in the <em>Public Opinion Quarterly</em>. They reviewed over 40 years of experimental evidence and confirmed that incentives reliably increase survey response rates across virtually all survey modes, populations, and contexts.</p>
<p>This is not a contested finding. The question is not whether incentives work but which incentive strategies produce the best return.</p>
<h3>Prepaid vs Promised: The Most Important Distinction</h3>
<p>The single most consistent finding in incentive research is that prepaid incentives outperform promised incentives by a wide margin.</p>
<p>A prepaid incentive is delivered with the survey invitation, before the respondent decides whether to participate. A promised incentive is offered as a reward for completing the survey.</p>
<p>Church (1993) found that prepaid monetary incentives increased response rates by an average of 19.1 percentage points, while promised incentives increased response rates by only 3.8 percentage points. That is a five-to-one difference in effectiveness.</p>
<p>Singer and Ye (2013) confirmed this gap across a much larger body of evidence. Prepaid incentives consistently produced response rate improvements two to three times larger than equivalent promised incentives.</p>
<p>The mechanism is reciprocity. When someone receives something of value before being asked to act, they feel a social obligation to reciprocate. This is a well-documented psychological principle (Cialdini, 2009) that operates below conscious awareness. A dollar bill enclosed in an envelope triggers reciprocity. A promise of a gift card after completion does not.</p>
<h3>Cash Outperforms Non-Cash Incentives</h3>
<p>Church (1993) found that monetary incentives (cash) produced larger response rate gains than non-monetary incentives (pens, keychains, lottery entries, donation pledges). This finding has been replicated consistently.</p>
<p>Mercer, Caporaso, Cantor, and Townsend (2015), in a study for the Bureau of Labor Statistics, found that cash incentives outperformed equivalent-value non-cash alternatives across multiple survey types.</p>
<p>The exception is when the non-cash incentive has specific relevance to the respondent. A study offering a free health screening as an incentive for a health survey may perform well because the incentive is directly related to the survey topic. But for general-purpose surveys, cash is the most reliable choice.</p>
<p>For mailed paper surveys, this creates a practical advantage. You can enclose a small denomination bill or coin with the survey. The respondent holds something tangible before they even read the first question. This physical, prepaid incentive is the most effective combination the research supports.</p>
<h3>How Much Is Enough?</h3>
<p>The relationship between incentive size and response rate is not linear. Doubling the incentive does not double the response gain.</p>
<p>Singer and Ye (2013) found that increasing incentive amounts produced diminishing returns. Moving from $0 to $1 produced a larger marginal effect than moving from $1 to $5, which in turn produced a larger effect than moving from $5 to $10.</p>
<p>Mercer et al. (2015) found that for the American Community Survey, a $5 prepaid incentive was nearly as effective as higher amounts. The act of receiving something mattered more than the dollar value.</p>
<p>For most research and institutional surveys, $1 to $5 prepaid is the practical sweet spot. The cost per additional completed survey is lowest in this range. Higher incentives produce marginally better response rates but at a disproportionately higher total cost.</p>
<h3>Paper Surveys Have a Built-In Incentive Advantage</h3>
<p>The incentive research has a clear implication for survey mode choice. Mailed paper surveys are uniquely well-suited to the most effective incentive strategy: prepaid cash enclosed with the invitation.</p>
<p>You cannot enclose a dollar bill in an email. Digital survey invitations can promise lottery entries, gift card codes, or charitable donations, but these are all promised incentives, not prepaid ones. The research consistently shows promised incentives are far less effective.</p>
<p>Dillman, Smyth, and Christian (2014) specifically recommend enclosing a small cash incentive with mailed questionnaires as part of their Tailored Design Method. Their experimental data shows that this combination, a well-designed paper questionnaire with a prepaid cash incentive, produces response rates that online-only approaches struggle to match.</p>
<p>This does not mean every paper survey needs an incentive. Many surveys achieve adequate response rates without them, particularly those administered in group settings like classrooms or events. But when you need to maximize participation from a distributed population contacted by mail, prepaid cash is the most evidence-based strategy available, and it only works with paper.</p>
<h3>Conditional vs Unconditional Incentives</h3>
<p>A related distinction is between conditional incentives (given only to respondents who meet certain criteria or complete specific sections) and unconditional incentives (given to everyone who receives the survey).</p>
<p>Research from Göritz (2006) on web surveys found that unconditional promised incentives slightly outperformed conditional ones. The explanation follows the same reciprocity logic: a gift freely given creates more obligation than a transactional reward.</p>
<p>For paper surveys, all prepaid incentives are inherently unconditional, since the money arrives with the questionnaire regardless of whether the respondent completes it. This is the optimal configuration according to the research.</p>
<h3>Incentive Effects Across Populations</h3>
<p>Incentive effects are not uniform across demographics. Several studies have found that incentives have the largest impact on groups that are otherwise least likely to respond:</p>
<ul>
<li><strong>Low-income respondents</strong> show larger response increases from monetary incentives (Singer et al., 1999)</li>
<li><strong>Young adults</strong> who typically have the lowest survey response rates show above-average incentive effects (Mercer et al., 2015)</li>
<li><strong>Minority populations</strong> underrepresented in survey samples show greater responsiveness to incentives (Groves et al., 2006)</li>
</ul>
<p>This means incentives do not just increase overall response rates. They can also reduce nonresponse bias by bringing underrepresented groups into the sample. For researchers concerned about sample representativeness, this is a significant methodological benefit.</p>
<h3>What Does Not Work</h3>
<p>The research also identifies incentive strategies with weak or no effects:</p>
<ul>
<li><strong>Lottery or prize draw entries</strong> produce minimal response rate improvement. The expected value is too low and the reward is too uncertain (Singer &amp; Ye, 2013).</li>
<li><strong>Charitable donations on behalf of the respondent</strong> have inconsistent effects and generally underperform direct cash incentives (Warriner, Goyder, Gjertsen, Hohner, &amp; McSpurren, 1996).</li>
<li><strong>Non-monetary tokens</strong> (pens, magnets, stickers) have small positive effects but are much less effective than equivalent-value cash (Church, 1993).</li>
<li><strong>Very large promised incentives</strong> ($50+) can sometimes backfire by creating suspicion about the survey's legitimacy (Singer &amp; Couper, 2008).</li>
</ul>
<h3>Practical Recommendations</h3>
<p>Based on the research:</p>
<ol>
<li><strong>Use prepaid incentives</strong> rather than promised rewards whenever your budget and delivery method allow.</li>
<li><strong>Use cash</strong> rather than non-monetary alternatives for the most reliable effect.</li>
<li><strong>Keep amounts modest</strong> ($1 to $5 for most surveys). Diminishing returns set in quickly.</li>
<li><strong>Combine incentives with good survey design.</strong> An incentive improves response rates, but a poorly designed survey with an incentive still underperforms a well-designed survey with the same incentive.</li>
<li><strong>Consider paper delivery</strong> for surveys where incentive-driven response maximization matters. The prepaid cash strategy is only practical with physical mail.</li>
</ol>
<h3>From Paper to Data</h3>
<p><a href="https://www.papersurvey.io">PaperSurvey.io</a> supports the full mailed survey workflow. Design your questionnaire in the online builder, print and mail it with your enclosed incentive, and process returned forms automatically when they come back. Upload scanned responses via browser, email, or Dropbox, and export clean data to Excel, CSV, or SPSS.</p>
<p>The incentive gets people to respond. The technology gets their responses into your dataset without manual data entry.</p>
<p><img src="/images/blog/blog-quiz-score-distribution.png" alt="Score distribution showing survey results processed automatically" /></p>
<h3>References</h3>
<ul>
<li>Church, A. H. (1993). Estimating the effect of incentives on mail survey response rates: A meta-analysis. <em>Public Opinion Quarterly</em>, 57(1), 62-79.</li>
<li>Cialdini, R. B. (2009). <em>Influence: Science and Practice</em> (5th ed.). Pearson.</li>
<li>Dillman, D. A., Smyth, J. D., &amp; Christian, L. M. (2014). <em>Internet, Phone, Mail, and Mixed-Mode Surveys: The Tailored Design Method</em> (4th ed.). Wiley.</li>
<li>Göritz, A. S. (2006). Incentives in web studies: Methodological issues and a review. <em>International Journal of Internet Science</em>, 1(1), 58-70.</li>
<li>Groves, R. M., Singer, E., &amp; Corning, A. (2006). Leverage-saliency theory of survey participation. <em>Public Opinion Quarterly</em>, 64(3), 299-308.</li>
<li>Mercer, A., Caporaso, A., Cantor, D., &amp; Townsend, R. (2015). How much gets you how much? Monetary incentives and response rates in household surveys. <em>Public Opinion Quarterly</em>, 79(1), 105-129.</li>
<li>Singer, E., &amp; Couper, M. P. (2008). Do incentives exert undue influence on survey participation? <em>Journal of Empirical Research on Human Research Ethics</em>, 3(3), 49-56.</li>
<li>Singer, E., Van Hoewyk, J., Gebler, N., Raghunathan, T., &amp; McGonagle, K. (1999). The effect of incentives on response rates in interviewer-mediated surveys. <em>Journal of Official Statistics</em>, 15(2), 217-230.</li>
<li>Singer, E., &amp; Ye, C. (2013). The use and effects of incentives in surveys. <em>Annals of the American Academy of Political and Social Science</em>, 645(1), 112-141.</li>
<li>Warriner, K., Goyder, J., Gjertsen, H., Hohner, P., &amp; McSpurren, K. (1996). Charities, no; lotteries, no; cash, yes. <em>Public Opinion Quarterly</em>, 60(4), 542-562.</li>
</ul>
<p><a href="https://www.papersurvey.io/app/auth/register">Start your free trial</a> and design your first survey in minutes.</p>]]>
            </summary>
                                    <updated>2026-04-26T08:45:22+00:00</updated>
        </entry>
            <entry>
            <title><![CDATA[Akindi Alternatives for Universities and Research Teams]]></title>
            <link rel="alternate" href="https://www.papersurvey.io/blog/akindi-alternative" />
            <id>https://www.papersurvey.io/28</id>
            <author>
                <name><![CDATA[PaperSurvey.io]]></name>
            </author>
            <summary type="html">
                <![CDATA[<p>Akindi has built a solid reputation in higher education as a modern Scantron alternative. Upload a scan of your bubble sheet answer forms, and Akindi grades them and syncs scores to your LMS. For straightforward multiple-choice exams, it works well.</p>
<p>But universities and research institutions do more than grade multiple-choice tests. They run course evaluations, conduct research surveys, collect institutional data, and work in multiple languages. That is where Akindi's scope runs out and where <a href="https://www.papersurvey.io">PaperSurvey.io</a> offers a more complete solution.</p>
<h3>When Akindi Falls Short</h3>
<p>Akindi is designed around a specific workflow: create a bubble sheet, print it, have students fill it in, scan it, and get scores. This is great for mid-term exams and final tests. But it does not extend to:</p>
<ul>
<li><strong>Open-ended questions</strong> where respondents write free-text answers</li>
<li><strong>Multi-page survey instruments</strong> used in academic research</li>
<li><strong>Course evaluations</strong> with Likert scales and written feedback sections</li>
<li><strong>Non-English forms</strong> for international student populations or cross-cultural research</li>
<li><strong>Institutional surveys</strong> like employee satisfaction, alumni feedback, or accreditation data collection</li>
</ul>
<p>If your work goes beyond grading exams, you need a platform that goes beyond bubble sheets.</p>
<h3>Beyond Bubble Sheets: Open-Ended and Handwriting Recognition</h3>
<p>Akindi reads filled bubbles. If you need to capture anything else on paper, you need a different tool.</p>
<p>PaperSurvey.io includes AI-powered handwriting recognition as a core feature. Add open-ended text fields to any form, and the platform reads handwritten responses automatically. Every recognized answer is shown alongside the original scan image for verification.</p>
<p>This is essential for course evaluations, where students provide qualitative feedback that matters as much as numerical ratings. It is equally important for research surveys, where open-ended questions capture insights that checkboxes cannot.</p>
<p><img src="/images/blog/blog-quiz-planet-sun.png" alt="Quiz results for &quot;Which planet is closest to the Sun?&quot; with correct answer highlighted" /></p>
<h3>Research-Grade Data Exports</h3>
<p>Akindi exports grades. PaperSurvey.io exports datasets.</p>
<p>For researchers, the difference matters. PaperSurvey.io supports:</p>
<ul>
<li><strong>SPSS export</strong> with variable names, value labels, and coded responses ready for statistical analysis</li>
<li><strong>Excel export</strong> with formatted columns and structured data</li>
<li><strong>CSV export</strong> for maximum compatibility</li>
<li><strong>Google Sheets</strong> integration for collaborative analysis</li>
</ul>
<p>If you have ever spent hours manually preparing an SPSS dataset from exported gradebook data, you know why this matters. PaperSurvey.io builds the labeled dataset for you, so you can move directly from data collection to analysis.</p>
<h3>Multi-Language Surveys for International Research</h3>
<p>Akindi's forms and interface are English-only. For universities with international student populations, or research teams running cross-cultural studies, this is a significant limitation.</p>
<p>PaperSurvey.io supports over 30 languages for form content. You can create survey instruments in English, Spanish, Arabic, Mandarin, Hindi, or any other supported language. The same survey can be printed in different languages for different respondent groups, with all responses collected in a single dataset.</p>
<p>For institutions that serve diverse populations or researchers working across borders, multilingual support is not a nice-to-have. It is a requirement.</p>
<p><img src="/images/blog/blog-quiz-chemical-o.png" alt="Quiz results for &quot;Which element has the chemical symbol &#039;O&#039;?&quot; with response breakdown" /></p>
<h3>Team Collaboration for Departments</h3>
<p>Academic departments need shared access to survey data. A department chair should be able to see course evaluation results across all sections. A research PI should be able to give co-investigators access to the same study.</p>
<p>PaperSurvey.io is built around team workspaces. Every team member can access shared surveys, view results, and export data. Role-based permissions ensure the right people see the right information. There is no need to export data from one person's account and email it to another.</p>
<h3>Hybrid Paper and Web Collection</h3>
<p>Not every respondent needs a paper form. PaperSurvey.io supports both paper and web responses for the same survey. Distribute printed forms in lecture halls and share a web link for online respondents. All responses are merged into a single dataset.</p>
<p>This is particularly useful for course evaluations, where some students are in the classroom and others are remote. It also works well for research studies that combine in-person interviews with mailed questionnaires and online follow-ups.</p>
<p><img src="/images/blog/blog-quiz-water-formula.png" alt="Quiz results for &quot;What is the chemical formula for water?&quot; with answer distribution" /></p>
<h3>No Proprietary Answer Sheets</h3>
<p>Akindi uses its own answer sheet format. PaperSurvey.io generates machine-readable forms from whatever survey you design. There are no proprietary bubble sheets to order. Just design your form, print it on plain paper with any printer, and scan the completed forms with any scanner.</p>
<p>Your forms can include your institution's logo, custom colors, and your own fonts. They look professional and match your branding, not a generic test answer sheet.</p>
<h3>Try It Free</h3>
<p>If your university or research team needs more than exam grading, PaperSurvey.io gives you handwriting recognition, multi-language forms, SPSS exports, team collaboration, and hybrid paper-web collection in a single platform.</p>
<p><a href="https://www.papersurvey.io/app/auth/register">Start your free trial</a> and see how it fits your institutional workflow.</p>]]>
            </summary>
                                    <updated>2026-04-26T08:45:22+00:00</updated>
        </entry>
            <entry>
            <title><![CDATA[GradeCam Alternatives: Cloud OMR Without the Per-Teacher Subscription]]></title>
            <link rel="alternate" href="https://www.papersurvey.io/blog/gradecam-alternative" />
            <id>https://www.papersurvey.io/30</id>
            <author>
                <name><![CDATA[PaperSurvey.io]]></name>
            </author>
            <summary type="html">
                <![CDATA[<p>GradeCam (now Gradient, part of GoGuardian) has been a go-to paper grading tool for K-12 teachers. You print a bubble sheet, students fill it in, and GradeCam reads the results through a document camera or phone. It works. But the economics and the feature set have shifted since GoGuardian acquired the product, and many schools and districts are looking for alternatives.</p>
<p>If rising per-teacher costs or K-12-only limitations are pushing you to explore other options, <a href="https://www.papersurvey.io">PaperSurvey.io</a> offers cloud-based OMR with flat team pricing and a feature set that extends well beyond classroom grading.</p>
<h3>What Changed After the Acquisition</h3>
<p>GoGuardian acquired GradeCam and rebranded it as Gradient. With the acquisition came changes to pricing, packaging, and product direction. Schools that previously used GradeCam as a standalone grading tool now face bundled pricing structures tied to the broader GoGuardian suite.</p>
<p>For schools that only need paper-based grading and do not use GoGuardian's other products, this can mean paying more for features they never use. Districts on tight budgets feel the squeeze, and individual teachers who previously used GradeCam's free tier have fewer options.</p>
<h3>Per-Teacher Pricing vs Per-Team Pricing</h3>
<p>GradeCam's pricing model charges per teacher. A school with 50 teachers pays 50 times the per-seat rate. A district with hundreds of teachers across multiple schools faces a significant line item.</p>
<p>PaperSurvey.io uses team-based pricing. One subscription covers your entire team, whether that is five people or fifty. Add instructors, teaching assistants, or administrative staff to your team workspace without increasing your bill. This makes budgeting predictable and scaling painless.</p>
<h3>Beyond K-12: Higher-Ed, Research, and Multilingual Surveys</h3>
<p>GradeCam is built for K-12 classrooms. Its templates, workflows, and integrations are designed around elementary and secondary school grading. If you work in higher education, run research projects, or need to collect data outside a K-12 context, GradeCam does not have much to offer.</p>
<p>PaperSurvey.io serves a broader audience:</p>
<ul>
<li><strong>Universities</strong> use it for course evaluations, entrance assessments, and faculty surveys</li>
<li><strong>Research teams</strong> use it for structured data collection with multi-page survey instruments</li>
<li><strong>NGOs and public health organizations</strong> use it for field surveys in areas without reliable internet</li>
<li><strong>Corporate training departments</strong> use it for employee assessments and feedback forms</li>
</ul>
<p>The platform supports over 30 languages, making it suitable for international research projects and multilingual institutions. GradeCam's interface and forms are English-only.</p>
<p><img src="/images/blog/blog-quiz-capital-france.png" alt="Quiz question results showing correct answer and response distribution for &quot;What is the capital of France?&quot;" /></p>
<h3>Cloud OMR on Any Device</h3>
<p>GradeCam traditionally relied on document cameras connected to classroom computers. While they have added mobile scanning, the workflow still centers on the classroom setup.</p>
<p>PaperSurvey.io is cloud-native. Design your survey in the browser on any device. Print your forms. Scan completed forms with any scanner, multi-function printer, or phone camera. Upload via drag-and-drop, email, or Dropbox. Processing happens in the cloud, and results are available immediately from any browser.</p>
<p>There is no software to install, no document camera to set up, and no dependency on classroom hardware. Your team can access surveys and results from anywhere.</p>
<h3>Handwriting Recognition Beyond Bubble Sheets</h3>
<p>GradeCam reads bubble marks. If you want students or respondents to write open-ended answers, you are on your own.</p>
<p>PaperSurvey.io includes AI-powered handwriting recognition. Add open-ended text fields to any survey, and the platform reads and digitizes handwritten responses automatically. This is critical for:</p>
<ul>
<li>Course evaluations where students provide written feedback</li>
<li>Research surveys with qualitative questions</li>
<li>Application and registration forms with name and address fields</li>
<li>Feedback forms where free-text responses carry the most value</li>
</ul>
<p>Every recognized response is paired with the original scan image, so you can verify any answer against what the respondent actually wrote.</p>
<p><img src="/images/blog/blog-quiz-mona-lisa.png" alt="Quiz results for &quot;Who painted the Mona Lisa?&quot; with correct answer highlighted" /></p>
<h3>Integrations: Zapier, API, and Webhooks</h3>
<p>GradeCam integrates primarily with learning management systems used in K-12 schools. If you need to send data to other platforms, options are limited.</p>
<p>PaperSurvey.io connects to thousands of applications through Zapier. Set up automations to push survey results to Google Sheets, Slack, Salesforce, or any other tool your team uses. For custom integrations, a REST API and real-time webhooks let you build exactly the data pipeline you need.</p>
<p><img src="/images/blog/screenshot-integrations.png" alt="Connect with Zapier, email upload, and Dropbox" /></p>
<h3>Flexible Data Export</h3>
<p>PaperSurvey.io exports data in CSV, Excel, SPSS, and Google Sheets formats. For researchers needing labeled datasets with variable names and value labels, the SPSS export eliminates hours of manual data preparation. GradeCam's export options are limited to gradebook-style reports designed for classroom use.</p>
<h3>Try It Free</h3>
<p>If GradeCam's pricing model or K-12 focus no longer fits your needs, PaperSurvey.io offers team-based pricing, cloud OMR on any device, handwriting recognition, multilingual forms, and exports built for research and institutional use.</p>
<p><a href="https://www.papersurvey.io/app/auth/register">Start your free trial</a> and process your first batch of forms in minutes.</p>]]>
            </summary>
                                    <updated>2026-04-26T08:45:22+00:00</updated>
        </entry>
            <entry>
            <title><![CDATA[ZipGrade Alternatives for Teams and Institutions]]></title>
            <link rel="alternate" href="https://www.papersurvey.io/blog/zipgrade-alternative" />
            <id>https://www.papersurvey.io/41</id>
            <author>
                <name><![CDATA[PaperSurvey.io]]></name>
            </author>
            <summary type="html">
                <![CDATA[<p>ZipGrade is a popular mobile grading app that lets individual teachers scan multiple-choice answer sheets with a phone camera. For a single classroom, it does the job. But once you move beyond one teacher grading one class, the limitations become clear.</p>
<p>If you are a school administrator, a university department, or a research team looking for something that scales, <a href="https://www.papersurvey.io">PaperSurvey.io</a> offers a cloud-based alternative built for institutional workflows.</p>
<h3>Why Teams Outgrow ZipGrade</h3>
<p>ZipGrade is designed for individual teachers. Each teacher manages their own account, their own classes, and their own data. There is no shared workspace, no team-level reporting, and no way for a department head or principal to see results across classrooms.</p>
<p>For a single teacher running weekly quizzes, this is fine. For a school running standardized assessments across grade levels, or a university department coordinating course evaluations, it creates data silos. Every teacher exports their own spreadsheet. Nobody has the full picture.</p>
<p>Institutions need shared access to survey data, consistent form design, and a single place where results from every classroom or research site come together. ZipGrade was not built for that.</p>
<h3>Phone Camera vs Cloud Processing at Scale</h3>
<p>ZipGrade processes scans on the phone itself. The teacher holds the phone over each answer sheet, one at a time. For 30 papers, this works. For 300 or 3,000, it becomes a bottleneck.</p>
<p>PaperSurvey.io uses cloud-based processing. You scan all your forms with any flatbed scanner, multi-function printer, or document scanner. Upload the entire batch as a single PDF or a folder of images. The platform processes everything automatically and returns structured results.</p>
<p>This means a department can process thousands of answer sheets in a single upload, without anyone standing over a desk pointing a phone camera at paper.</p>
<p><img src="/images/blog/blog-quiz-score-distribution.png" alt="Score distribution histogram showing exam performance across 200 respondents" /></p>
<h3>Team Collaboration and Shared Results</h3>
<p>PaperSurvey.io is built around teams. Every member of your team can access shared surveys, view results, and export data from the same workspace. Role-based access ensures the right people see the right data.</p>
<p>A school can set up one team for the whole institution. A university department can give every instructor access to shared course evaluations. A research group can collaborate on a single study with everyone working from the same dataset.</p>
<p>There is no need to email spreadsheets back and forth or manually combine data from individual teacher accounts.</p>
<p><img src="/images/blog/blog-quiz-test-summary.png" alt="Test summary showing average score, frequently missed questions, and pass rates" /></p>
<h3>Beyond Grading: Surveys, Evaluations, and Research</h3>
<p>ZipGrade is a grading tool. It handles multiple-choice answer sheets and that is where it stops.</p>
<p>PaperSurvey.io supports a much wider range of use cases:</p>
<ul>
<li><strong>Course evaluations</strong> with Likert scales, open-ended questions, and structured feedback</li>
<li><strong>Research surveys</strong> with multi-page instruments and respondent identifiers</li>
<li><strong>Attendance tracking</strong> with scannable rosters</li>
<li><strong>Application and registration forms</strong> with handwriting recognition</li>
<li><strong>Institutional assessments</strong> across departments and campuses</li>
</ul>
<p>If your needs go beyond grading quizzes, you need a platform that goes beyond bubble sheets.</p>
<h3>Multi-Page Surveys and Handwriting Recognition</h3>
<p>ZipGrade is limited to single-page, multiple-choice answer sheets. PaperSurvey.io supports multi-page surveys with automatic page matching. Each page carries a unique QR identifier, so pages are linked to the correct respondent even if they get separated during scanning.</p>
<p>Open-ended questions are supported with AI-powered handwriting recognition. Respondents can write free-text answers on paper, and the platform reads and digitizes their handwriting automatically. This is essential for course evaluations, feedback forms, and qualitative research.</p>
<h3>Data Export for Analysis</h3>
<p>ZipGrade exports basic CSV files from each individual teacher's account. PaperSurvey.io offers structured exports in multiple formats:</p>
<ul>
<li><strong>CSV</strong> for spreadsheets and general use</li>
<li><strong>Excel</strong> with formatted columns and labels</li>
<li><strong>SPSS</strong> for statistical analysis in research workflows</li>
<li><strong>Google Sheets</strong> integration for real-time collaboration</li>
</ul>
<p>For researchers and institutional analysts, SPSS export with labeled variables and value labels saves hours of data preparation. This is the kind of export format that individual grading apps simply do not offer.</p>
<p><img src="/images/blog/blog-quiz-item-difficulty.png" alt="Item difficulty analysis with discrimination indices across all questions" /></p>
<h3>Simple Team Pricing</h3>
<p>ZipGrade charges per teacher. As your team grows, your costs multiply. PaperSurvey.io uses team-based pricing. Your whole department or institution shares one subscription, and you add team members without paying per seat.</p>
<p>Need the platform for one semester? Subscribe monthly and cancel when the term ends. Need it year-round? Annual billing gives you a lower rate. There are no enterprise contracts, no per-teacher fees, and no hidden charges for features like handwriting recognition or SPSS export.</p>
<h3>Try It Free</h3>
<p>If your team has outgrown ZipGrade's individual teacher model, PaperSurvey.io gives you shared workspaces, cloud processing, multi-page surveys, handwriting recognition, and research-grade data exports, all in one platform.</p>
<p><a href="https://www.papersurvey.io/app/auth/register">Start your free trial</a> and see the difference a team-first platform makes.</p>]]>
            </summary>
                                    <updated>2026-04-26T08:45:23+00:00</updated>
        </entry>
            <entry>
            <title><![CDATA[Trade-Show and Event Feedback: Why Paper Beats QR Codes (and How to Process It Fast)]]></title>
            <link rel="alternate" href="https://www.papersurvey.io/blog/trade-show-event-feedback-paper-beats-qr-codes" />
            <id>https://www.papersurvey.io/39</id>
            <author>
                <name><![CDATA[PaperSurvey.io]]></name>
            </author>
            <summary type="html">
                <![CDATA[<p>You have seen the setup at every trade show and conference: a QR code on a table tent, a sign that says "Scan to give us your feedback," and a URL printed on the back of a badge. The assumption is that attendees will scan the code, open the survey on their phone, and complete it later.</p>
<p>They will not. Most will not even start.</p>
<p>QR-to-online-survey completion rates at events are notoriously low. Industry data from event platforms puts typical completion rates between 2% and 8% of attendees who actually scan the code. The rest get distracted, forget, or close the browser tab when a notification pops up.</p>
<p>Paper feedback forms handed out at a booth or session get filled in on the spot. Completion rates of 40% to 60% are normal because the respondent is already there, already engaged, and the form takes 60 seconds to complete with a pen.</p>
<p>The objection to paper has always been the same: "But then we have to type it all in." That objection no longer holds. Modern OMR platforms process a stack of paper forms into a structured spreadsheet in minutes. Here is how.</p>
<h3>Why Paper Converts Better on the Show Floor</h3>
<p>Event attendees are in motion. They move between booths, sessions, and networking areas. Their attention is fragmented and their phone is full of notifications, emails, and messages from colleagues back at the office.</p>
<p>Asking someone to complete an online survey in that environment is asking them to stop, focus on a screen, and type on a small keyboard while standing in a crowd. Most people will say "I'll do it later" and never do.</p>
<p>A paper form works differently. Hand someone a half-page feedback card and a pen at your booth. They fill it in while standing right there. It takes less than a minute. They hand it back. Done.</p>
<p>The key factors that make paper outperform digital at events:</p>
<ul>
<li><strong>Immediate completion</strong>: The respondent fills it in now, not "later"</li>
<li><strong>No device friction</strong>: No QR scanning, no app loading, no form rendering on a small screen</li>
<li><strong>Tangible commitment</strong>: Holding a physical form creates a small social obligation to complete it</li>
<li><strong>No connectivity dependency</strong>: Conference WiFi is famously unreliable</li>
<li><strong>No distraction risk</strong>: The respondent is not pulled away by phone notifications mid-survey</li>
</ul>
<h3>Designing a One-Page Event Feedback Form</h3>
<p>The best event feedback forms are short. One page, one side, completable in under two minutes. Keep it focused:</p>
<ul>
<li>3-5 multiple-choice or rating scale questions about the event, session, or product demo</li>
<li>1 open-ended question for comments or specific interests</li>
<li>Contact fields (name, email, company) for lead capture</li>
<li>Your branding: logo, colors, and booth or session identifier</li>
</ul>
<p>Avoid long instruments at events. If you need detailed feedback, send a follow-up survey by email after the event using the contact information you collected on the paper form.</p>
<p><a href="https://www.papersurvey.io">PaperSurvey.io</a> lets you design branded feedback forms in the online builder, print them on any printer, and generate as many copies as you need. Each form includes machine-readable markers so the platform can process responses automatically after scanning.</p>
<h3>Branded Forms That Match Your Booth</h3>
<p>Generic forms look generic. If your booth has a polished design with custom graphics and brand colors, your feedback form should match.</p>
<p>PaperSurvey.io lets you upload your logo, set custom colors, and choose fonts that align with your brand identity. The result is a professional feedback form that looks like it belongs at your booth, not a photocopied sheet from a generic template.</p>
<p>For conferences with multiple sessions, you can create separate forms for each session with the session name and speaker pre-printed. This eliminates the "which session is this about?" confusion and lets you analyze feedback by session automatically.</p>
<h3>Processing Hundreds of Forms the Morning After</h3>
<p>The event is over. You have a stack of 200, 500, or 1,000 completed feedback forms. In the old world, someone would sit at a desk and type every response into a spreadsheet. That job would take days.</p>
<p>With PaperSurvey.io:</p>
<ol>
<li><strong>Scan</strong> the entire stack using any document scanner. A standard office scanner with an automatic document feeder processes a hundred pages in minutes.</li>
<li><strong>Upload</strong> the scanned PDF to PaperSurvey.io via browser, email, or Dropbox.</li>
<li><strong>Process</strong>: The platform reads every checkbox, rating scale, and handwritten response automatically.</li>
<li><strong>Review</strong>: Any responses flagged as ambiguous are shown alongside the original scan image for quick human verification.</li>
<li><strong>Export</strong>: Download the complete dataset as Excel, CSV, or push it to other tools via Zapier.</li>
</ol>
<p>A stack of 500 forms can go from paper to structured spreadsheet before lunch on the first day back at the office.</p>
<h3>Getting Leads Into Your CRM</h3>
<p>For trade shows, the feedback form doubles as a lead capture tool. Names, email addresses, company names, and product interests collected on paper need to reach your sales team fast while the leads are still warm.</p>
<p>PaperSurvey.io integrates with Zapier, connecting your survey results to Salesforce, HubSpot, Mailchimp, Google Sheets, Slack, and thousands of other platforms. Set up a Zapier automation once, and every processed response flows directly into your CRM or marketing platform.</p>
<p><img src="/images/blog/screenshot-integrations.png" alt="Connect with Zapier, email upload, and Dropbox" /></p>
<p>For custom integrations, webhooks deliver real-time notifications as soon as responses are processed, and a REST API provides full programmatic access to your data.</p>
<p>Your sales team can start follow-up emails and calls within hours of the event ending, not days.</p>
<h3>From Paper Stack to Dashboard in Hours</h3>
<p>The complete event feedback workflow with PaperSurvey.io:</p>
<ul>
<li><strong>Before the event</strong>: Design and print branded feedback forms</li>
<li><strong>During the event</strong>: Hand out forms at your booth or session. Collect completed forms in a box.</li>
<li><strong>After the event</strong>: Scan the stack, upload, and process. Review flagged responses.</li>
<li><strong>Same day or next morning</strong>: Export to Excel, push to CRM via Zapier, share results with the team.</li>
</ul>
<p>No manual data entry. No hiring temps to type in responses. No waiting weeks for results while leads go cold.</p>
<h3>Try It Free</h3>
<p>If you are collecting feedback at trade shows, conferences, workshops, or corporate events, paper forms get higher completion rates than QR codes and PaperSurvey.io gets you from paper to data in hours.</p>
<p><a href="https://www.papersurvey.io/app/auth/register">Start your free trial</a> and design your first event feedback form before your next show.</p>]]>
            </summary>
                                    <updated>2026-04-26T08:45:23+00:00</updated>
        </entry>
            <entry>
            <title><![CDATA[Remark Office OMR Alternatives: Cloud-Based OMR for Any Device]]></title>
            <link rel="alternate" href="https://www.papersurvey.io/blog/remark-office-omr-alternative" />
            <id>https://www.papersurvey.io/6</id>
            <author>
                <name><![CDATA[PaperSurvey.io]]></name>
            </author>
            <summary type="html">
                <![CDATA[<p>Remark Office OMR by Gravic is one of the longest-running optical mark recognition products on the market. It has been a reliable choice for organizations processing paper forms on Windows workstations for over two decades. But the product reflects the era it was built in: desktop software, Windows-only, per-seat licensing, and a workflow that ties you to specific machines.</p>
<p>If you need OMR that works across platforms, includes handwriting recognition, and does not require software installation, <a href="https://www.papersurvey.io">PaperSurvey.io</a> is a modern cloud-based alternative.</p>
<h3>What Remark Office OMR Offers (and Where It Stops)</h3>
<p>Remark Office OMR is a capable product for its intended use case. You design a form template, configure the recognition zones manually, scan your forms on a connected scanner, and the software reads the marked bubbles. It supports batch processing and offers basic data export.</p>
<p>The limitations emerge when you look at how teams actually work today:</p>
<ul>
<li>It runs only on Windows. Mac and Linux users cannot use it.</li>
<li>Each installation requires a per-seat license. Scaling to a team means buying multiple licenses.</li>
<li>Form templates must be configured manually, defining each recognition zone by hand.</li>
<li>It reads filled bubbles but does not include handwriting recognition for open-ended responses.</li>
<li>Results live on the local machine where the scan was processed. Sharing data requires exporting and sending files manually.</li>
<li>Software updates and maintenance fall on your IT team.</li>
</ul>
<p>For a single operator processing forms at a dedicated workstation, these constraints are manageable. For teams, departments, and multi-site organizations, they create friction.</p>
<h3>Windows-Only vs Cloud: Any Device, Any OS</h3>
<p>Remark Office OMR requires a Windows PC with the software installed. PaperSurvey.io runs in any web browser on any operating system. Design forms, upload scans, review results, and export data from Windows, Mac, Linux, a tablet, or a phone.</p>
<p>There is nothing to install, nothing to configure, and nothing for your IT department to maintain. Your team can access the platform from anywhere with an internet connection.</p>
<p><img src="/images/blog/chart-type-bar.png" alt="Survey results bar chart showing employment type distribution with statistics" /></p>
<h3>Desktop Licensing vs Simple Subscription</h3>
<p>Remark sells perpetual licenses per seat, with optional annual maintenance fees for updates and support. Scaling from one user to five means purchasing five licenses. If you need access at multiple locations, you need licenses at each one.</p>
<p>PaperSurvey.io uses subscription pricing with the full team sharing one plan. Add team members to your workspace without per-seat charges. Subscribe monthly or annually. Cancel if you no longer need it. There are no perpetual license fees, no maintenance contracts, and no upgrade pricing.</p>
<h3>Handwriting Recognition Included</h3>
<p>Remark Office OMR reads filled bubbles and marks. If your form includes open-ended text fields where respondents write by hand, Remark cannot read them. You would need a separate ICR or HTR tool, or manual data entry.</p>
<p>PaperSurvey.io includes AI-powered handwriting recognition as a standard feature. Add open-ended text fields to any form, and the platform reads handwritten responses automatically. Each recognized answer is displayed alongside the original scan image, so you can verify accuracy at a glance.</p>
<p>This makes PaperSurvey.io suitable for surveys, evaluations, and feedback forms where free-text responses are as important as checkbox answers.</p>
<h3>No Form Design Constraints</h3>
<p>Remark Office OMR requires you to manually define recognition zones on your form template. This means configuring the exact position of every checkbox, every bubble area, and every text region. If your form layout changes, you reconfigure the template.</p>
<p>PaperSurvey.io generates machine-readable forms automatically from whatever survey you design in the online builder. Every form includes QR codes and alignment markers that the platform uses to locate answer fields. There is no manual zone configuration. Add a question, and the form is ready to print and process.</p>
<p>You can customize your forms with your own logo, colors, and fonts. The platform handles the machine-readability automatically.</p>
<h3>Upload From Anywhere: Scanner, Email, Phone, Dropbox</h3>
<p>Remark processes scans from a directly connected scanner. PaperSurvey.io accepts uploads through multiple channels:</p>
<ul>
<li><strong>Browser upload</strong>: Drag and drop PDF or image files directly into your dashboard</li>
<li><strong>Email</strong>: Send scans to your dedicated project email address for automatic processing</li>
<li><strong>Phone camera</strong>: Snap photos of completed forms and upload from your mobile device</li>
<li><strong>Dropbox</strong>: Place files in a connected Dropbox folder and they are processed automatically</li>
</ul>
<p>This flexibility means you are not tied to a single scanning station. Field teams can photograph forms and upload them from the road. Regional offices can email scans to a central project. IT does not need to set up scanner drivers on specific machines.</p>
<h3>Team Access and Collaboration</h3>
<p>Remark stores results on the local machine where the scan was processed. Sharing data means exporting files and distributing them manually.</p>
<p>PaperSurvey.io stores everything in the cloud. Every team member with access to the workspace can view surveys, review results, and export data. Role-based permissions control who can do what. There is no file shuffling and no version confusion.</p>
<h3>Zapier and Webhook Integrations</h3>
<p>Remark Office OMR exports data to files. PaperSurvey.io exports data and pushes it to other systems automatically. Zapier integration connects your survey results to thousands of applications. Webhooks deliver real-time notifications when new responses are processed. A REST API gives you full programmatic access.</p>
<p>For organizations that need survey data to flow into CRMs, databases, analytics platforms, or notification systems, this integration layer eliminates manual data transfer.</p>
<p><img src="/images/blog/screenshot-integrations.png" alt="Connect with Zapier, email upload, and Dropbox" /></p>
<h3>Try It Free</h3>
<p>If Remark Office OMR's desktop-only model no longer fits how your team works, PaperSurvey.io offers cloud-based OMR with handwriting recognition, team collaboration, flexible upload options, and modern integrations.</p>
<p><a href="https://www.papersurvey.io/app/auth/register">Start your free trial</a> and process your first forms without installing any software.</p>]]>
            </summary>
                                    <updated>2026-04-26T08:45:23+00:00</updated>
        </entry>
            <entry>
            <title><![CDATA[Running Paper Surveys in Low-Connectivity Field Research]]></title>
            <link rel="alternate" href="https://www.papersurvey.io/blog/running-paper-surveys-in-low-connectivity-field-research" />
            <id>https://www.papersurvey.io/36</id>
            <author>
                <name><![CDATA[PaperSurvey.io]]></name>
            </author>
            <summary type="html">
                <![CDATA[<p>A research coordinator for a maternal health study in rural Malawi described her data collection setup: a stack of printed questionnaires, a box of pens, and a bag of zip-lock pouches to protect the forms from dust and rain. No tablets. No WiFi hotspots. No generator-powered charging stations. At the end of each week, the completed forms traveled by motorbike to a district office with a flatbed scanner and an internet connection. Within hours of uploading, the data appeared in the project dashboard, cleaned and structured.</p>
<p>This is not a workaround. For thousands of research projects, public health programs, and humanitarian assessments around the world, paper-based data collection in the field is the most reliable method available. The challenge has never been collecting the data on paper. It has been getting that data into a digital system efficiently. Modern OCR platforms have solved that problem.</p>
<h3>The Connectivity Problem in Field Research</h3>
<p>Digital survey tools like ODK, KoBoToolbox, and SurveyCTO assume some level of device availability and eventual connectivity. They work well in many field settings. But they break down when:</p>
<ul>
<li>Power is unreliable and devices cannot be charged consistently</li>
<li>Tablets or phones are too expensive or too fragile for the field conditions</li>
<li>Enumerators are community health workers with limited digital literacy</li>
<li>Security concerns make carrying electronic devices risky</li>
<li>Institutional review boards require paper consent forms regardless of digital data collection</li>
</ul>
<p>In these situations, digital-first is not practical. Paper-first is not a concession. It is a deliberate design choice that prioritizes data reliability over technological convenience.</p>
<h3>Why Offline-First Matters for Data Integrity</h3>
<p>When a digital survey tool loses connectivity mid-interview, the app queues responses locally and syncs later. This works most of the time. But field researchers have seen the failure modes: corrupted local databases after app crashes, duplicate submissions after unreliable sync, lost interviews after a device is damaged or stolen.</p>
<p>Paper has none of these failure modes. A completed paper questionnaire is a physical artifact. It does not crash. It does not lose sync. It can be photocopied for backup. It can be reviewed by a supervisor before it leaves the field site. If a page gets damaged, the rest of the form is still intact.</p>
<p>For studies where every response matters, where sample sizes are small and replacement interviews are impossible, the physical durability of paper is a feature, not a limitation.</p>
<h3>Paper as the Original Offline Survey Tool</h3>
<p>Paper-based data collection has been the backbone of epidemiological research, census work, and social science fieldwork for over a century. The WHO's Expanded Programme on Immunization coverage surveys, UNICEF's Multiple Indicator Cluster Surveys, and countless academic research projects have relied on printed questionnaires administered by trained enumerators.</p>
<p>What made paper difficult in the past was not the collection. It was the data entry. Hiring teams of data entry clerks, double-entering every form for accuracy, and spending weeks cleaning the resulting dataset. This is where modern technology has changed the equation.</p>
<h3>The Modern Workflow: Collect, Scan, Upload, Done</h3>
<p><a href="https://www.papersurvey.io">PaperSurvey.io</a> eliminates manual data entry from paper-based field research. The workflow is:</p>
<ol>
<li><strong>Design</strong> your survey instrument online, with any combination of multiple-choice, single-choice, Likert scale, and open-ended questions</li>
<li><strong>Print</strong> the required number of copies on any printer, on plain paper</li>
<li><strong>Distribute</strong> printed forms to field teams and enumerators</li>
<li><strong>Collect</strong> completed forms at the field site, no electricity or connectivity needed</li>
<li><strong>Transport</strong> forms to any location with a scanner and internet access</li>
<li><strong>Scan</strong> all forms in batch using a flatbed scanner, document scanner, or even a phone camera</li>
<li><strong>Upload</strong> the scanned files via browser, email, or Dropbox</li>
<li><strong>Process</strong> automatically: the platform reads checkboxes, radio buttons, and handwritten text using OCR and AI</li>
</ol>
<p>Results appear in your dashboard within minutes of upload. Export to Excel, CSV, or SPSS for analysis.</p>
<p><img src="/images/blog/screenshot-upload.png" alt="Upload scanned forms via drag-and-drop, email, or Dropbox" /></p>
<h3>Designing Field-Ready Forms</h3>
<p>Forms used in field research face conditions that office surveys never encounter. Dust, humidity, rain, uneven writing surfaces, and respondents who may be completing the form while standing or sitting on the ground.</p>
<p>Practical design choices that improve field performance:</p>
<ul>
<li><strong>Larger checkboxes and text fields</strong> make forms easier to complete with a pen on an unstable surface</li>
<li><strong>Clear section headers and numbering</strong> help enumerators navigate the form during interviews</li>
<li><strong>Printed respondent identifiers</strong> (pre-filled IDs or barcodes) reduce transcription errors</li>
<li><strong>Multi-language forms</strong> serve multilingual field sites without requiring separate instruments</li>
<li><strong>Single-sided printing</strong> prevents bleed-through from affecting recognition on the reverse</li>
</ul>
<p>PaperSurvey.io supports all of these design choices. Forms can be printed in over 30 languages, and the platform generates unique identifiers for each copy to track individual respondents across multi-page instruments.</p>
<h3>Data Quality in Challenging Conditions</h3>
<p>Scanned forms from the field are not always pristine. Pages get folded. Ink smudges. A respondent marks outside the checkbox. A supervisor writes a note in the margin.</p>
<p>PaperSurvey.io's recognition engine handles imperfect scans. When a mark is ambiguous, the platform flags it for human review rather than guessing. You see the original scan image alongside the recognized response and can correct any errors in seconds.</p>
<p>This human-in-the-loop verification gives you the speed of automated processing with the accuracy of manual review, but only where it is needed.</p>
<h3>From a Rural Clinic to a Research Database</h3>
<p>Consider a practical scenario. A public health team is running a household survey across 40 villages in a rural district. Each village has a trained community health worker conducting interviews. The survey instrument is four pages with 35 questions covering demographics, health behaviors, and service utilization.</p>
<p>With paper and PaperSurvey.io:</p>
<ul>
<li><strong>Day 1-10</strong>: Community health workers conduct interviews using printed forms. No devices, no charging, no connectivity needed.</li>
<li><strong>Day 11</strong>: A project vehicle collects completed forms from collection points across the district.</li>
<li><strong>Day 12</strong>: Forms are scanned at the district office (a standard document scanner processes hundreds of pages per hour). Scanned files are uploaded to PaperSurvey.io.</li>
<li><strong>Day 12, afternoon</strong>: The research team in the capital city opens their dashboard and finds structured, exportable data from all 40 villages. Flagged responses are reviewed and corrected.</li>
<li><strong>Day 13</strong>: The cleaned dataset is exported to SPSS for analysis.</li>
</ul>
<p><img src="/images/blog/chart-type-likert.png" alt="Likert scale analysis showing structured survey results" /></p>
<p>Total time from field collection to analysis-ready data: three days, with no manual data entry.</p>
<h3>Try It Free</h3>
<p>If your research takes you to places where internet access is unreliable, PaperSurvey.io lets you collect data on paper and convert it to structured digital data as soon as you reach a scanner. No tablets, no connectivity in the field, no manual data entry.</p>
<p><a href="https://www.papersurvey.io/app/auth/register">Start your free trial</a> and design your first field survey instrument in minutes.</p>]]>
            </summary>
                                    <updated>2026-04-30T14:15:48+00:00</updated>
        </entry>
            <entry>
            <title><![CDATA[Scantron Alternatives: Modern OMR Without Proprietary Forms or Hardware]]></title>
            <link rel="alternate" href="https://www.papersurvey.io/blog/scantron-alternative" />
            <id>https://www.papersurvey.io/37</id>
            <author>
                <name><![CDATA[PaperSurvey.io]]></name>
            </author>
            <summary type="html">
                <![CDATA[<p>Scantron has been synonymous with bubble-sheet testing for decades. If you went to school in the United States, you probably filled in Scantron answer sheets with a No. 2 pencil. The technology works, but the business model behind it was designed for a different era.</p>
<p>Scantron requires proprietary answer sheets, proprietary scanning hardware, and enterprise-level contracts. For institutions looking for a modern, flexible alternative, <a href="https://www.papersurvey.io">PaperSurvey.io</a> offers cloud-based OMR that runs on plain paper, works with any scanner, and bills monthly.</p>
<h3>The Scantron Model: Proprietary Everything</h3>
<p>The traditional Scantron workflow locks you into a closed ecosystem:</p>
<ul>
<li><strong>Proprietary answer sheets</strong> that you must purchase from Scantron or authorized distributors</li>
<li><strong>Dedicated scanning hardware</strong> that only reads Scantron-formatted forms</li>
<li><strong>On-premise software</strong> that runs on specific machines</li>
<li><strong>Enterprise contracts</strong> with annual commitments and volume pricing negotiations</li>
</ul>
<p>Every part of the pipeline is controlled by a single vendor. If your scanner breaks, you wait for Scantron support. If you run out of answer sheets, you place an order and wait for delivery. If your contract renews, you negotiate again.</p>
<p>This model made sense before cloud computing existed. It does not make sense now.</p>
<h3>Plain Paper OMR: No Special Forms Needed</h3>
<p>PaperSurvey.io generates machine-readable forms from whatever survey you design in the online builder. Print these forms on plain paper using any standard printer. There are no proprietary sheets to order, no inventory to manage, and no risk of running out before an exam.</p>
<p>Each printed form includes QR codes and alignment markers that the platform uses to identify pages, match multi-page forms to the correct respondent, and locate every answer field automatically. The forms are designed by you, not dictated by a hardware vendor.</p>
<p>Want to add your institution's logo? Change the font? Include open-ended text fields alongside multiple-choice questions? You can. The form is yours to design.</p>
<p><img src="/images/blog/screenshot-pdf-preview.png" alt="Printable paper survey form with multiple question types" /></p>
<h3>Any Scanner, Any Phone Camera</h3>
<p>Scantron requires dedicated scanning hardware. PaperSurvey.io works with whatever scanning equipment you already have:</p>
<ul>
<li><strong>Flatbed scanners</strong> and multi-function printers found in every office</li>
<li><strong>Document scanners</strong> for high-volume batch processing</li>
<li><strong>Phone cameras</strong> for quick scans on the go</li>
<li><strong>Email upload</strong> by sending scans directly to your project email address</li>
<li><strong>Dropbox integration</strong> for automatic processing of uploaded files</li>
</ul>
<p>There is no hardware to purchase, no maintenance contracts, and no dependency on a single vendor's equipment.</p>
<p><img src="/images/blog/blog-quiz-wwii.png" alt="Quiz results for &quot;What year did World War II end?&quot; with answer distribution" /></p>
<h3>Cloud Processing: No Hardware to Maintain</h3>
<p>Scantron's on-premise model means someone in your IT department manages the scanning software, applies updates, and troubleshoots problems. PaperSurvey.io is entirely cloud-based.</p>
<p>Upload your scanned forms through the browser, by email, or via Dropbox. Processing happens on our servers and results appear in your dashboard within minutes. There is nothing to install, nothing to update, and nothing for your IT team to support.</p>
<p>Access your surveys and results from any device, any browser, anywhere. Multiple team members can work simultaneously without competing for access to a single scanning station.</p>
<h3>From Enterprise Contracts to Monthly Billing</h3>
<p>Scantron's pricing typically involves annual contracts negotiated through sales representatives. Getting a quote requires a meeting. Changing your plan requires another meeting.</p>
<p>PaperSurvey.io offers transparent monthly and annual plans published on the website. Subscribe when you need it, cancel when you do not. Scale up for assessment season and scale back down afterward. There are no multi-year commitments, no volume negotiations, and no surprises.</p>
<p>Your entire team shares one subscription. Add users to your workspace without paying per seat.</p>
<h3>Features Scantron Never Built</h3>
<p>The world has moved beyond fill-in-the-bubble answer sheets. PaperSurvey.io includes capabilities that the Scantron model was never designed to handle:</p>
<ul>
<li><strong>Handwriting recognition</strong>: Add open-ended text fields and let AI read handwritten responses automatically</li>
<li><strong>Web surveys</strong>: Collect responses online and on paper using the same survey, with all data merged in one dataset</li>
<li><strong>Multi-language forms</strong>: Create surveys in over 30 languages for diverse student populations and international research</li>
<li><strong>API and webhooks</strong>: Push results to external systems automatically as soon as forms are processed</li>
<li><strong>Zapier integration</strong>: Connect to thousands of apps without writing code</li>
<li><strong>SPSS export</strong>: Generate labeled datasets ready for statistical analysis</li>
</ul>
<p>These are not add-ons or premium features. They are part of the platform.</p>
<h3>Institution-Ready, Not Enterprise-Priced</h3>
<p>PaperSurvey.io is used by universities, school districts, research organizations, and government agencies. It handles the same core job as Scantron, reading marks from paper forms and turning them into structured data, but without the proprietary lock-in and enterprise pricing.</p>
<p>If your institution is re-evaluating its Scantron contract, or if you are setting up paper-based assessment for the first time and want to avoid the proprietary trap entirely, PaperSurvey.io gives you a modern alternative.</p>
<h3>Try It Free</h3>
<p><a href="https://www.papersurvey.io/app/auth/register">Start your free trial</a> and process your first batch of answer sheets on plain paper, with any scanner, in minutes.</p>]]>
            </summary>
                                    <updated>2026-04-26T08:45:23+00:00</updated>
        </entry>
            <entry>
            <title><![CDATA[Paper vs Online Surveys: When Paper Still Wins (with Data)]]></title>
            <link rel="alternate" href="https://www.papersurvey.io/blog/paper-surveys-vs-digital-surveys-when-paper-still-wins" />
            <id>https://www.papersurvey.io/26</id>
            <author>
                <name><![CDATA[PaperSurvey.io]]></name>
            </author>
            <summary type="html">
                <![CDATA[<p>Online surveys are cheaper to distribute, faster to deploy, and easier to analyze. For many use cases, they are the right choice. But a persistent finding across decades of research is that paper surveys achieve higher response rates than online alternatives in a wide range of populations and settings.</p>
<p>This is not nostalgia for a pre-digital era. It is what the published evidence shows. Here is the data, what it means for research design, and how modern OCR technology eliminates the old argument against paper.</p>
<h3>The Response Rate Gap: What the Research Shows</h3>
<p>The most frequently cited study on paper versus online response rates in higher education is Nulty (2008), published in <em>Assessment &amp; Evaluation in Higher Education</em>. Nulty reviewed multiple studies comparing paper and online course evaluation response rates and found that paper consistently outperformed online, often by 20 percentage points or more. Across the studies reviewed, paper response rates averaged around 56%, while online rates averaged around 33%.</p>
<p>Nulty's finding has been replicated in different contexts:</p>
<ul>
<li>
<p>Dommeyer et al. (2004) compared paper and online course evaluations across multiple semesters at a US university. Paper evaluations achieved response rates of 75%, while online evaluations achieved 29%. That is a gap of 46 percentage points.</p>
</li>
<li>
<p>A meta-analysis published in the <em>American Journal of Epidemiology</em> (Manfreda et al., 2008) examined 45 studies comparing web and other survey modes. Web surveys had response rates that were on average 11 percentage points lower than other modes, including mail (paper) surveys.</p>
</li>
<li>
<p>Dillman, Smyth, and Christian (2014) in <em>Internet, Phone, Mail, and Mixed-Mode Surveys</em> documented that mail surveys continued to achieve competitive or superior response rates compared to web surveys, particularly when combined with design best practices like pre-notification letters, follow-up mailings, and respondent-friendly formatting.</p>
</li>
<li>
<p>Fan and Yan (2010) reviewed 39 experimental comparisons of web and mail surveys and found that mail surveys had significantly higher response rates in 27 of them. The average advantage for mail was 10 to 12 percentage points.</p>
</li>
</ul>
<p>These are not small differences. In research contexts where response rate directly affects the validity and generalizability of findings, a 10 to 40 point gap is substantial.</p>
<h3>Why Paper Gets Higher Response Rates</h3>
<p>Several mechanisms explain the persistent advantage of paper:</p>
<p><strong>Physical salience.</strong> A paper questionnaire on a desk is harder to ignore than an email in a crowded inbox. It occupies physical space and creates a sense of presence. Email survey invitations compete with hundreds of other messages and are easily deleted, filtered, or forgotten.</p>
<p><strong>Perceived effort and obligation.</strong> Receiving a printed questionnaire signals that someone invested effort in reaching you. This triggers a reciprocity effect: the respondent feels a greater sense of obligation to respond than they do to an email link. Research on survey methodology has documented this effect across multiple populations.</p>
<p><strong>Lower survey fatigue.</strong> Email inboxes are saturated with survey requests. Employees, customers, students, and research participants receive multiple online survey invitations per week. Paper surveys stand out precisely because they are uncommon. There is less "paper survey fatigue" than digital survey fatigue.</p>
<p><strong>Accessibility.</strong> Paper does not require a device, an internet connection, or digital literacy. It reaches populations that web surveys systematically exclude: older adults who are less comfortable with technology, people without reliable internet access, residents of care facilities, incarcerated populations, and communities in developing countries.</p>
<p><strong>Fewer abandonment triggers.</strong> A respondent filling in a paper form has no browser tabs competing for attention, no push notifications interrupting them, and no form that times out if they pause. Paper surveys have lower abandonment rates because the medium itself removes the distractions that cause people to leave online surveys incomplete.</p>
<h3>Demographics Where Paper Dominates</h3>
<p>The response rate advantage of paper is not uniform. It is strongest in specific populations:</p>
<ul>
<li><strong>Older adults (65+)</strong>: Multiple studies show paper response rates two to three times higher than online among older populations. A study of Medicare beneficiaries found paper response rates of 44% compared to 16% for online (Couper et al., 2007).</li>
<li><strong>Rural populations</strong>: Communities with limited broadband access respond at much higher rates to mailed paper surveys than to web invitations they may never receive or be able to complete.</li>
<li><strong>Healthcare patients</strong>: Patient satisfaction surveys, clinical trial questionnaires, and health behavior studies consistently achieve higher response rates on paper, particularly among older and lower-income patients.</li>
<li><strong>Students in classroom settings</strong>: When course evaluations are administered on paper during class time, completion rates reach 70-90%. The same evaluations administered online after class typically achieve 30-40%.</li>
<li><strong>Employees in non-desk roles</strong>: Factory workers, field staff, warehouse employees, and others who do not sit at computers all day respond at higher rates to paper surveys distributed during work breaks or meetings.</li>
</ul>
<h3>Coverage Bias in Online-Only Surveys</h3>
<p>Response rate is only part of the picture. Coverage bias, the systematic exclusion of certain groups from the survey population, is a more serious concern.</p>
<p>An online-only survey excludes anyone without internet access, without a device, or without the digital skills to complete a web form. This introduces a bias that no amount of weighting or statistical adjustment can fully correct, because the excluded groups may differ from the included groups in ways that are directly relevant to the survey topic.</p>
<p>The World Bank estimates that approximately 2.6 billion people worldwide lack internet access. Even in high-income countries, internet adoption is not universal. In the United States, approximately 6% of adults do not use the internet at all (Pew Research Center, 2024), with non-adoption concentrated among older adults, lower-income households, and rural communities.</p>
<p>For public health research, government surveys, and social science studies where representative sampling is essential, paper surveys provide coverage that online methods cannot.</p>
<h3>Data Quality: Longer, More Thoughtful Responses</h3>
<p>Research from the <em>Journal of Mixed Methods Research</em> (Denscombe, 2009) found that paper respondents provide longer and more detailed open-ended responses compared to online respondents. Online respondents are more likely to skip open-ended questions entirely or write minimal answers.</p>
<p>This finding has been attributed to the different cognitive environments of paper and screen. Paper respondents are less rushed, less distracted, and more willing to take time with qualitative questions. For researchers who rely on open-ended data for thematic analysis, this difference in response quality can be as important as the difference in response rate.</p>
<h3>Compliance, Legal, and Institutional Requirements</h3>
<p>Some data collection must happen on paper regardless of preference:</p>
<ul>
<li><strong>Clinical trials</strong> in many jurisdictions require paper-based consent forms and data collection instruments as part of regulatory compliance</li>
<li><strong>Government census and survey programs</strong> maintain paper options to ensure coverage of all population groups</li>
<li><strong>Workplace safety audits</strong> and compliance assessments in regulated industries often require physical documentation</li>
<li><strong>Election processes</strong> use paper ballots as the primary or backup record</li>
<li><strong>Institutional review boards</strong> may require paper consent forms even when data collection is digital</li>
</ul>
<p>For organizations working in these contexts, paper is not optional. The question is how efficiently the data gets from paper into a digital system.</p>
<h3>The Old Weakness of Paper, Now Solved</h3>
<p>The historical argument against paper surveys was always the same: manual data entry. Hiring people to key in responses from hundreds or thousands of forms is slow, expensive, and introduces transcription errors.</p>
<p>Modern OCR (Optical Character Recognition) and OMR (Optical Mark Recognition) technology has eliminated this bottleneck. <a href="https://www.papersurvey.io">PaperSurvey.io</a> allows you to:</p>
<ul>
<li><strong>Design</strong> your survey with an online form builder supporting multiple question types</li>
<li><strong>Print</strong> forms on plain paper with any standard printer</li>
<li><strong>Scan</strong> completed forms with any flatbed scanner, document scanner, or phone camera</li>
<li><strong>Upload</strong> scans via browser, email, or Dropbox</li>
<li><strong>Process</strong> responses automatically, including handwritten text via AI-powered recognition</li>
<li><strong>Export</strong> clean data to Excel, CSV, SPSS, or Google Sheets</li>
</ul>
<p>The entire workflow from a stack of paper forms to an analysis-ready dataset takes minutes, not days. There is no manual data entry involved. Ambiguous responses are flagged for quick human review, combining the speed of automation with the accuracy of human oversight.</p>
<p><img src="/images/blog/chart-type-nps.png" alt="NPS score analysis with response distribution and promoter breakdown" /></p>
<h3>When to Choose Paper</h3>
<p>Paper surveys are the stronger choice when:</p>
<ul>
<li>Your target population includes older adults, rural communities, or groups with limited internet access</li>
<li>You need representative sampling across demographic groups and cannot afford coverage bias</li>
<li>You are working in environments without reliable connectivity (field research, remote sites, developing regions)</li>
<li>Your survey is administered in a group setting (classrooms, meetings, workshops, events)</li>
<li>Regulatory or institutional requirements mandate physical forms</li>
<li>You want higher response rates for postal or in-person distribution</li>
<li>Your instrument includes open-ended questions where response quality matters</li>
</ul>
<h3>When Digital Makes More Sense</h3>
<p>Online surveys remain the better choice when:</p>
<ul>
<li>Your audience is young, urban, and digitally engaged</li>
<li>You need rapid turnaround and real-time results</li>
<li>You are running short, simple surveys with large online audiences</li>
<li>Budget constraints rule out printing and postage</li>
<li>You need complex branching logic that adapts in real time</li>
<li>Geographic distribution makes paper logistics impractical</li>
</ul>
<h3>The Hybrid Approach</h3>
<p>Many organizations find that the best strategy is not paper or digital, but both. PaperSurvey.io supports paper and web responses for the same survey. Distribute printed forms to the populations that respond better on paper. Share a web link for respondents who prefer digital. All responses are merged into a single dataset for analysis.</p>
<p>This mixed-mode approach, well-documented in Dillman's research as a strategy for maximizing response rates and minimizing coverage bias, gives you the strengths of both methods without the limitations of either.</p>
<h3>References</h3>
<ul>
<li>Couper, M. P., Kapteyn, A., Schonlau, M., &amp; Winter, J. (2007). Noncoverage and nonresponse in an Internet survey. <em>Social Science Research</em>, 36(1), 131-148.</li>
<li>Denscombe, M. (2009). Item non-response rates: A comparison of online and paper questionnaires. <em>International Journal of Social Research Methodology</em>, 12(4), 281-291.</li>
<li>Dillman, D. A., Smyth, J. D., &amp; Christian, L. M. (2014). <em>Internet, Phone, Mail, and Mixed-Mode Surveys: The Tailored Design Method</em> (4th ed.). Wiley.</li>
<li>Dommeyer, C. J., Baum, P., Hanna, R. W., &amp; Chapman, K. S. (2004). Gathering faculty teaching evaluations by in-class and online surveys. <em>Assessment &amp; Evaluation in Higher Education</em>, 29(5), 611-623.</li>
<li>Fan, W., &amp; Yan, Z. (2010). Factors affecting response rates of the web survey: A systematic review. <em>Computers in Human Behavior</em>, 26(2), 132-139.</li>
<li>Manfreda, K. L., Bosnjak, M., Berzelak, J., Haas, I., &amp; Vehovar, V. (2008). Web surveys versus other survey modes: A meta-analysis comparing response rates. <em>International Journal of Market Research</em>, 50(1), 79-104.</li>
<li>Nulty, D. D. (2008). The adequacy of response rates to online and paper surveys: What can be done? <em>Assessment &amp; Evaluation in Higher Education</em>, 33(3), 301-314.</li>
<li>Pew Research Center. (2024). Internet/Broadband Fact Sheet.</li>
</ul>
<p><a href="https://www.papersurvey.io/app/auth/register">Start your free trial</a> and see how paper and digital can work together.</p>]]>
            </summary>
                                    <updated>2026-04-26T08:45:23+00:00</updated>
        </entry>
            <entry>
            <title><![CDATA[How to write good survey questions]]></title>
            <link rel="alternate" href="https://www.papersurvey.io/blog/how-to-write-good-survey-questions" />
            <id>https://www.papersurvey.io/24</id>
            <author>
                <name><![CDATA[PaperSurvey.io]]></name>
            </author>
            <summary type="html">
                <![CDATA[<h1>How to write good survey questions</h1>
<p><img src="/images/blog/opinion-poll.png" alt="Senior" /></p>
<p>Surveys are a valuable tool for gathering information and opinions from a large number of people. Whether you're conducting market research, gathering feedback from customers, or trying to understand the attitudes and preferences of your target audience, surveys can provide valuable insights. However, the success of your survey depends heavily on the quality of the questions you ask. If your questions are unclear, leading, or irrelevant, you may not get the information you need, or worse, you may get inaccurate or biased information.</p>
<p>Writing effective survey questions requires careful consideration and planning. You need to know what information you're trying to gather, how you want to gather it, and who you want to gather it from. You also need to be mindful of the way you phrase your questions and the type of questions you ask. A well-designed survey will have clear, concise, and relevant questions that are easy for respondents to answer.</p>
<p>In this article, we'll explore some best practices for writing good survey questions. We'll cover the types of questions to use, how to avoid common pitfalls, and tips for making your questions effective and engaging for your respondents.</p>
<h2>Types of questions</h2>
<p>There are several types of survey questions you can use, each with its own strengths and weaknesses. Some of the most common types of questions include:</p>
<ul>
<li>
<p><strong>Multiple choice questions:</strong> These questions offer a set of pre-determined response options, allowing respondents to select one or more answers. This type of question is useful for gathering basic information or data that can be easily categorized.</p>
</li>
<li>
<p><strong>Open-ended questions:</strong> These questions allow respondents to provide a free-form answer in their own words. This type of question is useful for gathering in-depth information or exploring complex topics.</p>
</li>
<li>
<p><strong>Rating scale questions:</strong> These questions ask respondents to rate a statement or item on a scale, such as 1 to 5 or 1 to 10. This type of question is useful for measuring opinions, attitudes, or levels of satisfaction.</p>
</li>
<li>
<p><strong>Likert scale questions:</strong> These questions are a type of rating scale question that ask respondents to indicate their level of agreement or disagreement with a statement.</p>
</li>
<li>
<p><strong>Ranking questions:</strong> These questions ask respondents to rank a set of items in order of preference or importance. This type of question is useful for exploring preferences and priorities.</p>
</li>
<li>
<p><strong>Demographic questions:</strong> These questions ask respondents to provide information about their background, such as age, gender, education level, or income.</p>
</li>
</ul>
<h2>How to Avoid Common Pitfalls:</h2>
<p>When writing survey questions, it's important to avoid common pitfalls that can skew the results or make your questions ineffective. Some of the most common pitfalls to watch out for include:</p>
<ul>
<li>
<p><strong>Leading questions:</strong> Leading questions are questions that suggest a particular answer or bias the respondent towards a particular answer. For example, “Do you think our company should focus more on profits or on social responsibility?” is a leading question. Avoid leading questions in order to get the most accurate data possible.</p>
</li>
<li>
<p><strong>Double-barreled questions:</strong> Double-barreled questions are questions that ask about two or more topics in one question. For example, “Do you like our company’s products and services?” This type of question can be confusing for respondents and may lead to inaccurate data.</p>
</li>
<li>
<p><strong>Overly complex questions:</strong> Avoid using jargon or overly complex language in your questions. Make sure each question is easy to understand and straightforward.</p>
</li>
<li>
<p><strong>Personal information:</strong> Avoid asking for personal information that is not necessary to the survey. This includes sensitive information such as social security numbers, financial information, and private health information.</p>
</li>
</ul>
<h2>Tips for Making Your Questions Effective and Engaging:</h2>
<p>In order to make your questions effective and engaging for your respondents, consider the following tips:</p>
<ul>
<li>
<p><strong>Know your purpose:</strong> Before writing any questions, it’s important to understand why you are conducting the survey. What information are you hoping to gather? Knowing the purpose of the survey will guide you in creating questions that are relevant and useful.</p>
</li>
<li>
<p><strong>Keep questions clear and concise:</strong> Avoid using jargon or overly complex language. Make sure each question is easy to understand and straightforward.</p>
</li>
<li>
<p><strong>Avoid leading questions:</strong> Leading questions are those that suggest a particular answer or bias the respondent towards a particular answer. For example, “Do you think our company should focus more on profits or on social responsibility?” is a leading question. Avoid leading questions in order to get the most accurate data possible.</p>
</li>
<li>
<p><strong>Use appropriate question types:</strong> Choose the type of question that best suits the information you are trying to gather.</p>
</li>
<li>
<p><strong>Be specific:</strong> When asking questions, be as specific as possible. For example, instead of asking “Are you happy with our company?”, ask “On a scale of 1 to 10, how satisfied are you with our company’s products/services?”.</p>
</li>
<li>
<p><strong>Make questions relevant:</strong> Make sure each question is relevant to the survey and the information you are trying to gather. Avoid including questions that are not necessary or relevant to the survey’s purpose.</p>
</li>
<li>
<p><strong>Pilot test your questions:</strong> Before distributing the survey, test it out on a small group of people to see if the questions are clear and elicit the information you are looking for. This can also help you identify any potential issues or biases in your questions.</p>
</li>
</ul>
<h2>Conclusion</h2>
<p>In conclusion, writing effective survey questions is crucial to getting the information you need to make informed decisions. By using the right type of question, avoiding common pitfalls, and making questions clear, concise, and relevant, you can ensure that your surveys get results. Whether you're conducting market research, gathering feedback from customers, or exploring the attitudes and preferences of your target audience, a well-designed survey can provide valuable insights. However, it's important to remember that the success of your survey ultimately depends on the quality of the questions you ask. With careful planning, consideration, and attention to detail, you can create surveys that get results and provide valuable insights into the needs, opinions, and preferences of your target audience.</p>]]>
            </summary>
                                    <updated>2026-04-30T14:15:48+00:00</updated>
        </entry>
            <entry>
            <title><![CDATA[Postal Surveys]]></title>
            <link rel="alternate" href="https://www.papersurvey.io/blog/post-mailing-paper-surveys" />
            <id>https://www.papersurvey.io/23</id>
            <author>
                <name><![CDATA[PaperSurvey.io]]></name>
            </author>
            <summary type="html">
                <![CDATA[<h1>Postal Surveys</h1>
<img src="/images/blog/mail.jpg" />
<p><br /></p>
<p>The advancements in technology have had a profound impact on the methods used for conducting surveys and collecting data. While online surveys have become a preferred option for collecting information due to their ease, efficiency, and cost-effectiveness, postal surveying continues to play a vital role in the field of surveying.</p>
<p>Postal surveying allows researchers to reach populations that cannot be accessed through online or telephone methods, particularly in cases where the target audience lacks access to technology or has a low response rate. It also offers a more personal and tangible experience for participants, as they receive a physical survey in the mail, which they can complete at their own pace and return in a pre-paid envelope.</p>
<p>Despite the higher costs and longer timelines associated with postal surveying, it remains an essential tool for researchers. It provides a means of reaching populations that cannot be reached through other methods and offers a personal touch that is difficult to achieve through online methods.</p>
<h2>Improving Mail Survey Response Rate</h2>
<p>A mail survey response rate refers to the percentage of people who respond to a survey that was sent via mail. The response rate is a crucial metric for evaluating the success of a survey and ensuring that the data collected is representative of the target population. Here's how:</p>
<ul>
<li>
<p><strong>Personalization:</strong> Add a personal touch to the survey by addressing the recipient by name and tailoring the content to their interests.</p>
</li>
<li>
<p><strong>Incentives:</strong> Offer an incentive for completing the survey, such as a chance to win a prize or a discount on future purchases.</p>
</li>
<li>
<p><strong>Clear Communication:</strong> Provide clear instructions on how to complete the survey and the purpose behind it.</p>
</li>
<li>
<p><strong>Timing:</strong> Choose an appropriate time to send out the survey, when recipients are most likely to have the time to complete it.</p>
</li>
<li>
<p><strong>Follow-up:</strong> Send a follow-up email or letter to remind recipients of the survey and encourage them to complete it.</p>
</li>
<li>
<p><strong>Simplicity:</strong> Keep the survey as short and simple as possible, to minimize the time it takes to complete and increase the likelihood of response.</p>
</li>
<li>
<p><strong>Trust:</strong> Ensure the confidentiality and security of the recipient's personal information, to build trust and increase response rates.</p>
</li>
<li>
<p><strong>Diversity:</strong> Offer a variety of ways to complete the survey, such as online or by mail, to accommodate different preferences and increase response rates.</p>
</li>
</ul>
<p>In addition to these strategies, it is also important to ensure that the mailing list is accurate and up-to-date, and to send the survey to a large enough sample size to ensure that the results are statistically significant.</p>
<p>In conclusion, the response rate is an important aspect of a successful mail survey, and it's important to carefully consider and monitor it throughout the process. With the right strategies in place, mail surveys can provide valuable information and reach populations that other methods can't.</p>]]>
            </summary>
                                    <updated>2026-04-30T14:15:48+00:00</updated>
        </entry>
            <entry>
            <title><![CDATA[Comparing online and paper survey response rates]]></title>
            <link rel="alternate" href="https://www.papersurvey.io/blog/comparing-online-and-paper-surveys-response-rates" />
            <id>https://www.papersurvey.io/22</id>
            <author>
                <name><![CDATA[PaperSurvey.io]]></name>
            </author>
            <summary type="html">
                <![CDATA[<h1>Comparing online and paper survey response rates</h1>
<p align="center">
<img style="height: 320px; margin-bottom: 40px;" src="/images/blog/paper-survey.png" />
</p>
<p>Surveys are an essential tool in collecting data and gathering information from a large population. They can be conducted in various forms, including online surveys and paper surveys. In this article, we will compare the response rates of both types of surveys and highlight their respective advantages and disadvantages.</p>
<h2>Online Surveys</h2>
<p>Online surveys are becoming increasingly popular due to their ease of use and cost-effectiveness. Participants can complete an online survey from the comfort of their own homes, and the data collected is immediately processed and analyzed. Online surveys are also more convenient for the surveyor, as they do not need to spend time and resources printing and distributing paper surveys.</p>
<p>One of the main advantages of online surveys is their high response rate. Participants are more likely to complete an online survey, as it is quick and straightforward. Online surveys can be distributed to a large number of participants, and the results can be collected in real-time. This means that surveyors can receive a high volume of responses in a short period, making online surveys an efficient method of data collection.</p>
<p>However, online surveys also have some disadvantages. The first is the issue of response bias. Online surveys are susceptible to bias, as participants may not be truthful in their answers. This can lead to inaccurate results and negatively impact the validity of the survey.</p>
<p>Another disadvantage of online surveys is that they are not suitable for individuals who do not have access to the internet. These individuals are likely to be excluded from the survey, leading to a biased sample. Furthermore, some participants may not feel comfortable completing an online survey, as they may not be confident in their ability to use technology.</p>
<h2>Paper Surveys</h2>
<p>Paper surveys are traditional methods of data collection and have been used for many years. Participants receive a paper survey in the post, and they complete it by hand and return it to the surveyor. Paper surveys are a convenient method of data collection, as they do not require access to the internet.</p>
<p>One of the main advantages of paper surveys is that they reduce the risk of response bias. Participants are more likely to be truthful in their answers when completing a paper survey, as they are not influenced by the technology. Additionally, participants may feel more comfortable completing a paper survey, as they are not required to use technology.</p>
<p>However, paper surveys have a lower response rate compared to online surveys. Participants may not complete the survey or return it to the surveyor, leading to a lower response rate. Furthermore, paper surveys are more time-consuming and costly for the surveyor, as they need to print and distribute the surveys.</p>
<p>Another disadvantage of paper surveys is that they are less efficient. The surveyor must wait for the participants to return the surveys, and the data must be manually processed and analyzed. This can lead to a longer turnaround time for the results, and the data may not be as up-to-date as that collected from an online survey.</p>
<h2>Conclusion</h2>
<p>In conclusion, both online and paper surveys have their respective advantages and disadvantages. Online surveys have a high response rate, are convenient for the surveyor, and the results can be collected in real-time. However, online surveys are susceptible to response bias and not suitable for individuals without internet access.</p>
<p>Paper surveys are less susceptible to response bias and are suitable for individuals without internet access. However, they have a lower response rate, are time-consuming and costly, and the data is not as up-to-date as that collected from an online survey.</p>
<p>When choosing between online and paper surveys, surveyors must consider the purpose of the survey and the target audience. If the survey is aimed at a tech-savvy population and a high response rate is desired, then an online survey may be the preferred method. However, if the survey is aimed at individuals without internet access or if the accuracy of the responses is a concern, then a paper survey may be a better option.</p>
<p>In summary, both online and paper surveys have their benefits and limitations, and the choice between the two will depend on the specific needs of the survey. Surveyors should carefully consider their target audience, the purpose of the survey, and the desired outcome before making a decision. Regardless of the chosen method, it is essential to ensure that the survey is designed and implemented in a manner that is ethical, valid, and reliable.</p>
<p>If you are looking to conduct a paper survey, consider using papersurvey.io, a platform that makes it easy and convenient to create, distribute, and manage paper surveys. With papersurvey.io, you can design your survey and print it without any hassle. The platform also provides tools to process and analyze the results, giving you insights into your data in real-time.</p>]]>
            </summary>
                                    <updated>2026-04-30T14:15:48+00:00</updated>
        </entry>
            <entry>
            <title><![CDATA[Surveying the Ageing Population]]></title>
            <link rel="alternate" href="https://www.papersurvey.io/blog/surveying-aging-population" />
            <id>https://www.papersurvey.io/21</id>
            <author>
                <name><![CDATA[PaperSurvey.io]]></name>
            </author>
            <summary type="html">
                <![CDATA[<h1>Surveying the Ageing Population</h1>
<p><img src="/images/blog/elderly.jpg" alt="Senior" /></p>
<p>As life expectancy continues to increase and birth rates decline, the world's population is growing older at an unprecedented rate. By 2050, it is estimated that one in five people will be over the age of 65. This demographic shift has far-reaching consequences for society, including health, social services, and the economy. To better understand the needs and experiences of the ageing population, surveying is a crucial tool.</p>
<h2>Why survey the ageing population?</h2>
<p>Surveys of the ageing population provide valuable insights into the health, well-being, and attitudes of this demographic. They help policymakers and researchers to identify the specific needs and challenges faced by older people and to develop targeted interventions that address these issues.</p>
<p>In addition to informing policy, surveys can also help to improve services for the ageing population. For example, surveys can be used to assess the quality of healthcare and social services for older people and to identify areas for improvement. Surveys can also provide information about the use of technology by older people, including the adoption of new technologies and the barriers to their use.</p>
<h2>Designing a survey for the ageing population</h2>
<p>When designing a survey for the ageing population, it is important to consider the following factors:</p>
<ul>
<li>
<p><strong>Response rate:</strong> Older people may be less likely to respond to surveys due to physical or cognitive limitations. Therefore, it is important to design a survey that is easy to complete and accessible to all.</p>
</li>
<li>
<p><strong>Question format:</strong> Questions should be simple and straightforward, with clear instructions for answering. Avoid complex questions and technical language that may confuse older respondents.</p>
</li>
<li>
<p><strong>Mode of delivery:</strong> Surveys can be delivered in a variety of ways, including by mail, phone, or online. It is important to consider the preferred mode of delivery for older people, taking into account factors such as accessibility and technological proficiency.</p>
</li>
<li>
<p><strong>Privacy and confidentiality:</strong> Older people may be concerned about privacy and confidentiality when responding to surveys. It is important to ensure that survey responses are anonymous and that personal information is protected.</p>
</li>
</ul>
<h2>How to increase response rates to surveys of older people?</h2>
<h3>High Contrast Colors</h3>
<p>To ensure that surveys are accessible to all individuals, it is important to use high contrast colors. High contrast color combinations, such as black text on a white background, make it easier for participants with visual impairments to distinguish between different elements in the survey. This helps to increase the visibility of questions and answers and makes the survey easier to read. Avoid using light or low contrast color combinations, such as yellow on a light green background, as they can be difficult to distinguish, especially for people with limited vision.</p>
<h3>Large Font Sizes</h3>
<p>The font size used in the survey should be large enough to be easily read by all participants. A minimum font size of 19 pixels (14 points) is recommended to ensure readability, especially for seniors. Smaller font sizes can make the survey difficult to read, causing frustration and reducing response rates. It is important to consider that as people age, their eyesight may deteriorate, making it necessary to use larger font sizes.</p>
<h3>Simple Font Styles</h3>
<p>The font style used in the survey should be simple and easy to read. Avoid using complex or ornate fonts, as they can be challenging for seniors to read. Choosing a font that is legible and commonly used will help to increase the response rate of the survey. A font style that is commonly used, such as Arial or Times New Roman, is a good choice as it will be familiar to participants and easy to read.</p>
<h3>Additional Tips</h3>
<p>To increase response rates to surveys of older individuals, it is important to consider the needs and preferences of this demographic. In addition to using high contrast colors, large font sizes, and simple font styles, other strategies that can be employed include:</p>
<ul>
<li>
<p>Providing clear and simple instructions for completion, including instructions on how to skip questions if necessary.</p>
</li>
<li>
<p>Ensuring privacy and confidentiality, by using secure data collection methods and communicating this to participants.</p>
</li>
<li>
<p>Providing support and assistance, such as having someone available to answer questions and assist with the completion of the survey.</p>
</li>
<li>
<p>Following up with non-responders, either by sending a reminder letter or making a follow-up phone call.</p>
</li>
</ul>
<p>By using these strategies, it is possible to increase response rates to surveys of older individuals, providing valuable insights into the needs and experiences of this demographic.</p>
<h2>Conclusion</h2>
<p>As the world's population grows older, surveying the ageing population is becoming increasingly important. Surveys provide valuable insights into the health, well-being, and attitudes of older people and inform the development of policies and services that address the needs of this demographic. By considering the unique needs and characteristics of older people, it is possible to design surveys that accurately represent the ageing population and provide meaningful insights.</p>]]>
            </summary>
                                    <updated>2026-04-30T14:15:48+00:00</updated>
        </entry>
            <entry>
            <title><![CDATA[Importance of Mental Health Surveys During COVID-19 Pandemic]]></title>
            <link rel="alternate" href="https://www.papersurvey.io/blog/importance-of-mental-health-surveys-during-covid-19-pandemic" />
            <id>https://www.papersurvey.io/20</id>
            <author>
                <name><![CDATA[PaperSurvey.io]]></name>
            </author>
            <summary type="html">
                <![CDATA[<h1>Importance of Mental Health Surveys During COVID-19 Pandemic</h1>
<p><img src="/images/blog/mental-health.jpg" alt="Mental Health" /></p>
<p>The coronavirus (COVID-19) pandemic is having an enormous impact on all the aspects of our lives, and it will have both short and long-lasting effects. Schools and universities are closed down, exams and events postponed, health care services are partially, or completely disrupted, we have to isolate ourselves from family and friends and some of us started to work remotely or even lost our jobs due to the pandemic. However, not everyone can cope with these changes happening so fast. Therefore, many people are facing mental health challenges. Fear about the future, stress, financial uncertainty, depression, and anxiety are some of the problems growing rapidly during the coronavirus pandemic.</p>
<h2>Why mental health surveys are important during the COVID-19 pandemic?</h2>
<h3>Mental Health and Economic recovery</h3>
<p>While all nonessential businesses are shutting down due to the pandemic there were millions of job losses in the U.S. However, essential businesses, which provide groceries, health or financial support, or utilities are still open and some people still have to go to work, even if they are afraid of catching the virus. Sadly not everyone has a choice.</p>
<p>These people are facing various mental health issues including uncertainty about the future, fear, anxiety, depression, and overall reduced quality of life. This leads to lost productivity and profits in the workplace.</p>
<p>Businesses need to ensure employee well-being and conducting employee mental health surveys is the first step to a more healthy and productive population. This will benefit both companies, people, and faster economic recovery.</p>
<h3>Monitoring Behavioral Changes</h3>
<p>Without a doubt, the coronavirus pandemic has created huge chaos in our lives, and our old definition of normal has changed forever. These changes have inevitably lead to a huge rise in mental health problems.</p>
<p>In a <a href="https://www.kff.org/coronavirus-covid-19/report/kff-health-tracking-poll-july-2020/">Health Tracking Poll</a> many adults have reported difficulty sleeping (36%) or eating (32%), increases in alcohol consumption or substance use (12%), and worsening chronic conditions (12%), due to worry and stress over the coronavirus, social isolation, or job loss and income insecurity.</p>
<p>Mental health surveys give insight into the population’s well-being and help to track behavioral changes during the crisis. This data is crucial in reducing mental health problems and monitoring the progress we are making every day.</p>
<h3>Communication with Authorities</h3>
<p>Data gathered on conducting mental health surveys is essential for better communication with authorities. This data will help health care providers, government agencies, scientists, and researchers to understand more about mental issues caused by the pandemic. This will lead to more efficient and faster economic recovery. </p>
<h3>Future Insights</h3>
<p>As mentioned before, our mental well-being has a direct impact on our productivity and performance at work. That is why it is important to monitor the emotional state of every worker, especially during psychologically difficult times. Conducting mental health surveys will help tremendously to businesses, health care systems, and authorities to plan strategies to control COVID-19 and make plans for the future.</p>
<p>Eventually, schools and universities will reopen, and to move forward as efficiently as possible, student mental health screening will be essential. This will help in understanding the impact of the pandemic on children and young adults and what has to be done to support them.</p>
<p>Altogether, mental health surveying will benefit our society greatly, starting from the faster and more efficient economic recovery, ending to better well-being of the population. </p>
<h2>Hard-to-Reach Populations and Mental health Surveying</h2>
<p>It is crucial to not forget about the hard-to-reach populations with limited or no internet access. According to a <a href="https://www.pewresearch.org/fact-tank/2019/04/22/some-americans-dont-use-the-internet-who-are-they/">Research Study</a>, 10% of the U.S. population do not use the Internet. Interestingly, this is not because of the limited Internet access -  according to the <a href="https://broadbandmap.fcc.gov/#/area-comparison?version=dec2017&amp;tech=acfosw&amp;speed=25_3&amp;searchtype=county">Federal Communications Commission</a>, 99.99% of Americans have access to it. Hence, people have decided not to use the Interned on purpose. Reasons could be various such as old age, lifestyle, education level, location, or ethnicity.</p>
<p>Paper surveying is one of the options to conduct surveys on hard-to-reach populations. This data gathered on paper surveys could be vital in understanding how the coronavirus pandemic affects different societies and people groups. </p>]]>
            </summary>
                                    <updated>2026-04-30T14:15:48+00:00</updated>
        </entry>
            <entry>
            <title><![CDATA[Mailing surveys by post]]></title>
            <link rel="alternate" href="https://www.papersurvey.io/blog/postal-survey-page.layout" />
            <id>https://www.papersurvey.io/19</id>
            <author>
                <name><![CDATA[PaperSurvey.io]]></name>
            </author>
            <summary type="html">
                <![CDATA[<h1>Mailing surveys by post</h1>
<p>If you're searching for an efficient and cost-effective way to conduct surveys through postal services, <a href="https://www.papersurvey.io">papersurvey.io</a> offers a premium solution. Our platform provides a user-friendly experience for creating and sending paper-based surveys, enabling you to gather valuable insights from your target audience. With our reliable and convenient approach, you can take advantage of the many benefits that paper-based surveys offer.</p>
<h2>How it works?</h2>
<p>In short, you will create a survey using papersurvey.io, print it and put in an envelope with the prepaid return. Once the respondent returns the survey, you will only need to scan and upload it to papersurvey.io.</p>
<h2>Can I fold pages in half?</h2>
<p><a href="https://www.papersurvey.io/help/recognition/article/can-i-fold-or-staple-paper-surveys">Generally, it is not recommended</a>, but if you have no choice, you can, just please make sure it does not happen to be on the actual question. You could simply leave the area empty, where you expect the folding lines to appear. </p>
<h2>End-to-end mailed surveys</h2>
<p>Generally, we only supply software to create and recognize paper survey questionnaires and you handle the printing/scanning on your own. If you would like to get a quote for printing, shipping, collection and scanning, please <a href="mailto:hello@papersurvey.io">get in touch</a> to discuss your requirements.</p>
<h2>What is more</h2>
<p>We recommend to use <a href="/help/printing/booklet-surveys">booklet survey layout</a> when sending surveys by post. This looks a bit more professional and you can also eliminate the problem of <a href="https://www.papersurvey.io/help/recognition/article/can-i-fold-or-staple-paper-surveys">folding pages</a>.</p>]]>
            </summary>
                                    <updated>2026-04-30T14:15:48+00:00</updated>
        </entry>
            <entry>
            <title><![CDATA[Anonymous Employee Surveys on Paper and Web]]></title>
            <link rel="alternate" href="https://www.papersurvey.io/blog/anonymous-employee-surveys" />
            <id>https://www.papersurvey.io/18</id>
            <author>
                <name><![CDATA[PaperSurvey.io]]></name>
            </author>
            <summary type="html">
                <![CDATA[<h1>Anonymous Employee Surveys on Paper and Web</h1>
<p><img src="/images/blog/surveys.jpg" alt="Anonymous paper surveys" /></p>
<p>Are you looking for a solution on how to collect anonymous feedback from your employees without breaching confidentiality? You have come to the right place.</p>
<p>Our solution allows you to collect responses both on paper and the web. Primarily the software is tailored for paper surveys but you can also access the same survey on the web.</p>
<h2>Truly Anonymous Surveys</h2>
<p>Our software does not track personally identifiable information. With standard survey tools usually you are able to see the Browser, IP, Referrer information using which you can accidentally find out the person behind the submission.</p>
<p>Using PaperSurvey.io software your employees may be confident that their response will remain anonymous and untraceable completing survey on the web. Surveys on paper are not traceable either, especially if you will not include open-response fields. Having open-response fields, you could theoretically find out who wrote the answer by analyzing the handwriting and comparing with other samples but that could be a long and tedious task.</p>
<h2>Easy Setup</h2>
<p>You can set up your survey easily and you do not need any technical or niche knowledge about the paper surveys. We automatically map the question field locations so you would not need to do that manually. Our surveys are automatically optimized for optimal data recognition and you will not need to worry about the scanned forms being not readable. </p>
<p>Finally, if you would also want to collect some of the responses on the web (e.g. to send the survey for remote workers), with a click of a button you can enable the web surveys.</p>
<h2>Higher response rate</h2>
<p>With surveys on paper, you can get much more responses than using web surveys.  Using our survey tool, you will spend a minimal amount of time digitizing the responses.</p>
<h2>Use Letterbox To Collect Responses</h2>
<p>For added anonymity, we recommend telling your employees to put the completed paper survey responses to a letterbox located in common areas. This way, your employees will be more open with their survey responses.</p>
<h2>Employee survey examples</h2>
<p>Looking to find an example survey template for your employee survey? Take a look a our <a href="/templates">survey template gallery</a> and pick a survey to start with.</p>]]>
            </summary>
                                    <updated>2026-04-30T14:15:48+00:00</updated>
        </entry>
            <entry>
            <title><![CDATA[Paper based surveys advantages and disadvantages]]></title>
            <link rel="alternate" href="https://www.papersurvey.io/blog/paper-based-survey-advantages-and-disadvantages" />
            <id>https://www.papersurvey.io/17</id>
            <author>
                <name><![CDATA[PaperSurvey.io]]></name>
            </author>
            <summary type="html">
                <![CDATA[<h1>Paper based surveys advantages and disadvantages</h1>
<p align="center">
<img src="/images/blog/bench-marking-survey.jpg" />
</p>
<p>Unsure which method of data collection to use? Take a look into a list of advantages/disadvantages and decide the optimal method for your research project.</p>
<p>PaperSurvey.io offers mixed (paper and web) survey data collection (self-service) solution. Create a paper survey and print it in minutes. <a href="https://www.papersurvey.io/app/auth/register">Click here to try it 14 days for free</a></p>
<h3>Advantages</h3>
<p>One of the main advantages of paper surveys is that they can generate much higher response rates than web questionnaires. <sup>[1]</sup> Additionally, the majority of respondents often believe that printed surveys are more anonymous than online surveys, which leads to the belief that respondents may be more honest on printed surveys. <sup>[2]</sup> Furthermore, printed surveys have the same formatting. This ensures that all respondents receive the same format and setting survey.</p>
<p><strong>Further advantages compared to web surveys include:</strong></p>
<ul>
<li>Does not require tablets/mobile phones to complete the survey which reduces technological investment needed.</li>
<li>Easy to distribute the survey across large pool of respondents.</li>
<li>Surveys can be mailed by post.</li>
<li>Suitable for respondents that are not technology savvy (e.g. older people, disabled people, children) and surveying people in developing countries where technologies are not widely accessible</li>
</ul>
<h3>Disadvantages</h3>
<p>The primary disadvantage of paper surveys is that it requires higher labor and financial investments. This is especially true if your organization is fully managing the survey process in-house. However, you can avoid this downside by working with reputable survey companies. For example, at Papersurvey.io, we handle the majority of the labor involved and minimize the manual work required - we help you to collect and analyze responses much faster - just create a paper survey online, print it and fill it out. Paper survey responses will be automatically recognized and digitized for you to analyze it further. PaperSurvey.io is self-service software therefore it is low-cost.</p>
<p><strong>Other disadvantages include:</strong></p>
<ul>
<li>Difficult to use logic branches/skip logic based on participant responses as the paper survey can't dynamically change.</li>
<li>Requires human labour to review responses that have low confidence (e.g. illegible handwriting, invalid responses) or responses are not valid based on the set rules.</li>
</ul>
<h2>Mixed paper and web surveys approach</h2>
<p>If you would like to used mixed approach of collecting data by both paper and web surveys, you can do that by using papersurvey.io. Once you create a paper survey, you can activate web survey with just a click of a button and start collecting data using both methods. Web surveys do not require any additional setup and you can see and export both web and paper responses in the same sheet.</p>
<p>This way you can eliminate web/paper disadvantages and use the best collection method as you see it fit. For instance, some employees that work from office may prefer web survey but for some field workers, paper surveys would be better suited.</p>
<h2>Is the paper based data collection is the right choice for your organization?</h2>
<p>This depends on your use case and  if you would like to discuss it with us, you may contact us at hello@papersurvey.io to arrange a call or email conversation.</p>
<h2>How to get started with paper survey data collection?</h2>
<p>PaperSurvey.io offers a paper-based solution for your data collection needs. It is a cloud-based platform where you can design your survey using easy to use interface and print out the copies.</p>
<p>Below is an overview video how our platform works, from designing the survey and printing it to scanning and reviewing the results.</p>
<center><iframe width="560" height="315" src="https://www.youtube.com/embed/0El-1jHOyEU" frameborder="0" allow="accelerometer; autoplay; encrypted-media; gyroscope; picture-in-picture" allowfullscreen></iframe></center>
<p>Would like to try it by yourself and see if it works for you? We offer 14-day trial, no credit card needed.</p>
<hr>    
<p>
    <sup>[1]</sup>
    Nulty, Duncan D. “The adequacy of response rates to online and paper surveys: what can be done?” Assessment & Evaluation in Higher Education: Vol. 33, No. 3, June 2008, 301-314.
</p>
<p>
    <sup>[2]</sup>
    Dommeyer, C.J., P., Baum, K. Chapman, and R.W. Hanna, 2002. Attitudes of business faculty towards two methods of collecting teaching evaluations: paper vs. online. Assessment and Evaluation in Higher Education 27, no. 5: 455–462
</p>]]>
            </summary>
                                    <updated>2026-04-30T14:15:48+00:00</updated>
        </entry>
            <entry>
            <title><![CDATA[What is Optical Mark Recognition (OMR)?]]></title>
            <link rel="alternate" href="https://www.papersurvey.io/blog/what-is-omr" />
            <id>https://www.papersurvey.io/16</id>
            <author>
                <name><![CDATA[PaperSurvey.io]]></name>
            </author>
            <summary type="html">
                <![CDATA[<h1>What is Optical Mark Recognition (OMR)?</h1>
<p>Optical Mark Recognition (OMR) is a technology that enables a machine to recognize marks made on a paper form, such as ticks, bubbles, or checkmarks. OMR is used to quickly and accurately capture information from paper forms, making it ideal for high-volume data collection.</p>
<p>OMR technology works by using a scanner or camera to take an image of the form, and then analyzing the image to identify the marks. Once the marks have been recognized, the information can be automatically transferred to a computer system for processing and analysis.</p>
<p>OMR is commonly used in a variety of applications, including:</p>
<ul>
<li>
<p><strong>Surveys and assessments:</strong> OMR is often used to collect data from large-scale surveys and assessments, such as school exams and employee evaluations.</p>
</li>
<li>
<p><strong>Election ballots:</strong> OMR is used to count votes in many elections, as it allows for quick and accurate vote counting.</p>
</li>
<li>
<p><strong>Job applications:</strong> OMR can be used to quickly collect information from job applications, such as personal details and qualifications.</p>
</li>
<li>
<p><strong>Medical forms:</strong> OMR can be used to capture information from medical forms, such as patient information and treatment records.</p>
</li>
</ul>
<p>OMR is a highly accurate method of data collection, as it reduces the risk of human error and ensures that the data is collected consistently. OMR forms can be designed to automatically check for errors, such as multiple marks in the same field, and can alert the user to any errors.</p>
<p>In addition to its accuracy, OMR is also highly efficient. The technology allows for the rapid capture of large volumes of data, making it ideal for large-scale data collection projects. OMR forms can also be designed to be self-contained, so that the data can be captured on-site, without the need for manual data entry.</p>
<p>One of the main benefits of OMR is that it is a non-intrusive method of data collection. Unlike other data collection methods, such as online surveys or interviews, OMR does not require the respondent to actively participate. This makes it ideal for use with populations that may be difficult to reach, such as children or people with disabilities.</p>
<p>Another benefit of OMR is that it is cost-effective. OMR forms are often less expensive to produce than other forms, as they do not require manual data entry. In addition, the technology can reduce the cost of data collection by reducing the need for manual data entry and reducing the risk of human error.</p>
<h2>Optical Mark Recognition Pros</h2>
<ul>
<li>
<p><strong>High Accuracy:</strong> OMR is a highly accurate method of data collection, as it reduces the risk of human error and ensures consistent data capture.</p>
</li>
<li>
<p><strong>Efficiency:</strong> OMR allows for rapid data capture, making it ideal for large-scale data collection projects.</p>
</li>
<li>
<p><strong>Cost-Effective:</strong> OMR forms are often less expensive to produce than other forms and can reduce the cost of data collection by reducing the need for manual data entry and reducing the risk of human error.</p>
</li>
<li>
<p><strong>Versatile:</strong> OMR can be used for a variety of applications, including surveys and assessments, election ballots, job applications, and medical forms.</p>
</li>
</ul>
<h2>Optical Mark Recognition Cons</h2>
<ul>
<li>
<p><strong>Limited Data Types:</strong> OMR is limited to capturing marks made on a form, and cannot capture other types of data, such as handwritten text.</p>
</li>
<li>
<p><strong>Limited Customization:</strong> OMR forms are limited in their design and customization options, which may not meet the needs of all users.</p>
</li>
</ul>
<p>In conclusion, Optical Mark Recognition (OMR) is a highly accurate and efficient method of data collection that is ideal for high-volume data collection projects. OMR is a non-intrusive method of data collection that is cost-effective and reduces the risk of human error. Whether you are conducting a survey, counting votes, or collecting medical records, OMR is a technology that can help you quickly and accurately capture the information you need.</p>]]>
            </summary>
                                    <updated>2026-04-30T14:15:48+00:00</updated>
        </entry>
            <entry>
            <title><![CDATA[Looking for a ABBYY FlexiCapture Alternative?]]></title>
            <link rel="alternate" href="https://www.papersurvey.io/blog/abby-flexicapture-alternative" />
            <id>https://www.papersurvey.io/15</id>
            <author>
                <name><![CDATA[PaperSurvey.io]]></name>
            </author>
            <summary type="html">
                <![CDATA[<h1>Looking for a ABBYY FlexiCapture Alternative?</h1>
<p><em>Are you are looking for a simpler alternative to ABBYY FlexiCapture? Try PaperSurvey.io.</em></p>
<p>PaperSurvey.io offers an OMR (optical mark recognition) and HTR (handwritten text recognition) recognition software that allows to easily create and read forms generated by our software.</p>
<p>Collect responses from the paper-based forms and automatically extract the data by sending the scanned documents to us. Create research surveys, questionnaires, registration, HR, feedback or application forms, quizzes, tests or anything else you can think of.</p>
<h3>Cloud-based software</h3>
<p>Differently than ABBYY FlexiCapture, PaperSurvey.io is a cloud-based software. Therefore, you may create and process paper forms on any platform.</p>
<p><strong>Do you not need:</strong></p>
<ul>
<li>Install any additional software</li>
<li>Deal with hardware and software updates</li>
<li>Renew licenses</li>
<li>Backup data</li>
<li>Think about scaling issues </li>
</ul>
<h3>No Setup</h3>
<p>Our forms are machine-readable by default and do not require a time-consuming process to set up the survey and configure each checkmark or text field. This is done automatically! You may set up your survey in minutes instead of days.</p>
<h3>Simple pricing</h3>
<p>Only need to use the survey platform just for a few months? Simply cancel when you no longer need it and resubscribe when you want to use it again.</p>
<h3>View Results Online</h3>
<p>You can always check your form Online immediately on any device and browser and always compare recognized information with actual document images. </p>
<h3>Automate &amp; Integrate with other platforms</h3>
<p>Easily integrate papersurvey.io software with your database. You may use a no-code solution — Zapier or code the integration yourself by interacting with Webhooks and API.</p>]]>
            </summary>
                                    <updated>2026-04-30T14:15:48+00:00</updated>
        </entry>
            <entry>
            <title><![CDATA[5 Methods That Innovative Companies Use OCR Survey Software]]></title>
            <link rel="alternate" href="https://www.papersurvey.io/blog/5-methods-that-innovative-companies-use-ocr-software" />
            <id>https://www.papersurvey.io/14</id>
            <author>
                <name><![CDATA[PaperSurvey.io]]></name>
            </author>
            <summary type="html">
                <![CDATA[<h1>5 Methods That Innovative Companies Use OCR Survey Software</h1>
<p>Businesses today, whether big or small, have adopted a data-driven mindset. Many of us believe that the success of an enterprise depends largely on how they analyze and interpret the data available. The problem lies in the amount of data to analyze and digest, which is why the advent of OCR technology has become a welcome addition to companies.</p>
<p>The most well-known use case of OCR technology is converting paper documents into machine-readable text documents. Surveys are one of the marketing tools that OCR technology helped simplify. Instead of manually checking all the paper questionnaires from the survey respondents, with the help of <a href="https://www.papersurvey.io/blog/ocr-surveys-software">OCR survey software</a>, scanning survey forms is easier and not as time-consuming as before. Moreover, it can scan an unlimited number of paper documents, and analyze the results thereafter. </p>
<h2>Advantages of OCR Survey Softwares</h2>
<p>Many businesses are now opting for online surveys because of the rising cost of paper, printing, as well as postage. However, there is a target population that is still not receptive to online surveys, so the dilemma on whether to switch to online surveys or stick to paper surveys continues.</p>
<p>This is where the advantage of paper survey scanning software comes into play. With the advanced features that this software offers, it comes in handy in making the once daunting task of paper survey look easy. When thousands of collected data needs to be processed from thousands of surveys every day, survey scanners can be a lifesaver. </p>
<p>Luckily, surveys are not the only task that OCR survey software can help simplify. There are innovative enterprises, big or small, that use the technology for some other useful purpose, here are some of them:</p>
<p><img src="/images/blog/ocr-survey-software.png" alt="OCR Survey software" /></p>
<h2>Methods That Innovative Companies Use OCR Survey Software</h2>
<h3>1. Document Management</h3>
<p>There was a time when you can see big old filing cabinets filled with paper documents in the office, but that was a thing of the past. Aside from being too much of a burden, manual filing is vulnerable to document losses caused by improper storage and human error. Nowadays, <a href="https://www.papersurvey.io/blog/automated-form-processing-paper-forms">electronic document management</a> is the new trend. Not only is it efficient, but it is cost-effective and can help streamline the operation. Innovative companies use the OCR survey scanning software to simplify and bring unbridled consistency to their filing system.</p>
<h3>2. Personal Identification</h3>
<p>With the OCR <a href="https://financesonline.com/survey-software-comprehensive-guide-benefits-features-types-pricing/">survey</a> software, institutions like the police, airports, department of motor vehicles, and other offices can scan passports, car number plates, driver’s licenses, and all other personal information quickly and more accurately. This can help these offices obtain accurate data and avoid human error. It will likewise reduce the transaction time of each institution.</p>
<h3>3. Preservation of Historical and Cultural Scripts</h3>
<p>Most historical organizations, libraries, and NGOs archive historical books, manuscripts, and cultural documents. They normally process this by copying the paper forms into digital files. Without OCR technology, manually retyping all of them would be next to impossible. With the use of OCR scanning systems, the process is simplified. We will never have to fear to lose our heritage and culture.</p>
<h3>4. Sorting Letters in Post Office</h3>
<p>Just imagine if the United States Postal Service sort their letters manually, with over 493 million letters being processed each day. Delays would be inevitable if the employees are tasked to manually sort each piece of mail. But thanks to the OCR software, they are used to help decode computer-generated labels and zip codes.</p>
<h3>5. Processing Invoices and Other Documents</h3>
<p>Many small businesses are now starting to realize the importance of process automation. Data needed for financial reports, payments, and document exchange needed to be in a digital text rather than paper invoices. Manually entering it into the system is very difficult, often resulting in time wastage, tons of paperwork, and far too many human errors. Software solutions equipped with OCR help simplify the task, making <a rel="nofollow" target="_blank" href="https://innovationmanagement.se/2018/07/11/innovation-and-process-automation-for-small-businesses/">small business process automation</a> achieve optimal efficacy.</p>
<h2>OCR Survey Software for Your Business</h2>
<p>According to a <a rel="nofollow" target="_blank" href="https://www.artsyltech.com/company/PressRelease23112017.html">survey conducted by Paystream Advisors</a>, the majority of the companies in North America, regardless of size, says that manual data entry and inefficient processes are common causes of process pain. Apart from that, the survey also revealed that 62% of small to medium enterprises still struggle with paper invoices.</p>
<p>The OCR survey software helps reduce both problems stated above. Furthermore, it saves time since the automatic digitization of data is much faster than manual processing. It also reduces costs in the long run because it prevents human error and reduces labor costs. The OCR systems will definitely improve your business processes, and eliminate storage problems. Another upside of using the OCR software in your business is that it provides security of your documents, improved customer service, and is good for the environment. With that, you can start exploring various tools such as PaperSurvey to streamline your document management processes.</p>]]>
            </summary>
                                    <updated>2026-04-30T14:15:48+00:00</updated>
        </entry>
            <entry>
            <title><![CDATA[Optical Mark Recognition (OMR) software]]></title>
            <link rel="alternate" href="https://www.papersurvey.io/blog/optical-mark-recognition-software" />
            <id>https://www.papersurvey.io/13</id>
            <author>
                <name><![CDATA[PaperSurvey.io]]></name>
            </author>
            <summary type="html">
                <![CDATA[<h1>Optical Mark Recognition (OMR) software</h1>
<p>Optical mark recognition (OMR in short) is a process to identify and extract data from paper forms by analyzing marked fields such as checkboxes or "bubble" fields. Optical mark recognition dates back to the 1930s where it was first used for test scoring. The software and techniques used for data processing are much improved nowadays and the accuracy and error handling is much better.</p>
<p>The fields may be filled-in, ticked or marked-in to record an answer. Often optical mark recognition is used with other recognition technologies (OCR, ICR, HTR, and others) that allow recording and recognizing data in other formats such as text, handwritten text, machine-printed text, numbers. </p>
<h2>Where is Optical Mark Recognition used?</h2>
<p>Optical mark recognition is widely used in business, education, and research. The forms with optical mark recognition can be used for surveys, tests, quizzes, application forms, evaluations and many other types of forms. Take a look of sample forms generated with papersurvey.io software:</p>
<ul>
<li><a href="https://www.papersurvey.io/templates/feedback/course-feedback-form">Course feedback form</a></li>
<li><a href="https://www.papersurvey.io/templates/event/event-satisfaction-survey">Event satisfaction survey</a></li>
<li><a href="https://www.papersurvey.io/templates/customer-satisfaction/customer-satisfaction-paper-survey">Customer satisfaction survey</a></li>
<li><a href="https://www.papersurvey.io/templates/hotel/resort-evaluation-paper-survey">Resort evaluation survey</a></li>
</ul>
<h2>How to get started?</h2>
<p>Are you looking for a quick and easy way to start a project with optical mark recognition? You may <a href="https://www.papersurvey.io/app/auth/register">register</a> on our platform and create your first form online right now.</p>
<p>Once you feel it is ready, just print it, ask your respondents to answer and upload the scanned sheets to our platform. The generated surveys are automatically optimized for reading the data and you do not need to worry whether your survey layout is suitable for machine recognition.</p>
<h2>How easy it is to use it?</h2>
<p>Setting up paper form with optical mark recognition is easy, fast and does not require. Using our online survey designer you may implement your survey design and get a printable PDF file that you can send to a printing department.</p>
<p>Once you have the forms printed and filled in, you may scan them via </p>
<h2>Different Recognition modes</h2>
<p>Using our paper survey software you are able to choose from two recognition modes:</p>
<ul>
<li><strong>Check or fill the box to respond</strong><ul>
<li>Using this recognition mode both filled-in and checked fields will be recognized as an answer</li>
<li>There is no way to unmark the answer if a person made a mistake, therefore, this mode is not suitable in exam conditions.</li>
</ul>
</li>
<li><strong>Check to respond, fill to unmark</strong><ul>
<li>The checked box will be recognized as an answer.</li>
<li>Filled in teh box will unmark the response, allowing you to choose a correct answer.</li>
</ul>
</li>
</ul>
<h2>Handwritten text recognition</h2>
<p>Additionally, you may add open response fields to your questionnaire. The handwritten text will be automatically read by our software (handwritten text recognition). </p>
<h2>Other recognition types</h2>
<p>Several other recognition methods include:</p>
<ul>
<li><strong>OCR</strong> (Optical character recognition)<ul>
<li>Optical character recognition is used to recognize the machine-printed text. It will not read the handwritten text correctly.</li>
<li>This is best if you are inserting text before printing the forms.</li>
<li>Machine-printed text is much easier to read than OCR.</li>
</ul>
</li>
<li><strong>ICR</strong> (Intelligent character recognition)<ul>
<li>This type of software allows reading handwritten characters. The software can only process one character at the time and requires training to match. ICR is most often used </li>
</ul>
</li>
<li><strong>HTR</strong> (Handwritten text recognition) /  <strong>HWR</strong> (Handwriting recognition)<ul>
<li>The technology to read handwritten responses. The software uses machine learning techniques to recognize the handwritten text. The software is usually trained on millions of labeled handwritten text samples.</li>
<li>As some handwriting is difficult to read, you will require to </li>
</ul>
</li>
</ul>
<p>You may choose to use any recognition technology above to read the answer. By default, handwritten text recognition is used to read the text responses.</p>]]>
            </summary>
                                    <updated>2026-04-30T14:15:48+00:00</updated>
        </entry>
            <entry>
            <title><![CDATA[OCR Survey software]]></title>
            <link rel="alternate" href="https://www.papersurvey.io/blog/ocr-surveys-software" />
            <id>https://www.papersurvey.io/12</id>
            <author>
                <name><![CDATA[PaperSurvey.io]]></name>
            </author>
            <summary type="html">
                <![CDATA[<h1>OCR Survey software</h1>
<p>Are you looking for a modern software solution to capture data from the paper questionnaires? </p>
<p><a href="https://www.papersurvey.io">papersurvey.io</a> provides an easy and cost-effective technology for creating paper-based forms with a checkmark and handwritten text recognition:</p>
<ul>
<li>Scan an unlimited number of documents.</li>
<li>Create surveys with an unlimited number of questions and pages.</li>
<li>Recognize documents from photos, deskew images and automatically rotate pages.</li>
<li>Scan duplex or simplex questionnaires.</li>
<li>Uniquely mark each paper copy to avoid duplicate scans and automatically sort the pages.</li>
</ul>
<h2>Data Entry from paper-based forms</h2>
<p>Setup your questionnaire on <a href="https://www.papersurvey.io">papersurvey.io</a> for collecting data via paper forms. Once you are ready and happy how the survey looks like, just print your survey forms and distribute them to your respondents or the staff. </p>
<p>The data entry is automated. You only need to scan the filled sheets and upload to our cloud platform. Within minutes of uploading, you will be able to analyze the quantitative data.</p>
<p>You may automatically sync responses from your Dropbox folder or use Zapier to handle your specific workflow. Finally, you may just send the scanned sheets over the email. </p>
<h2>Cloud-based software</h2>
<p>Unlike most of the alternatives such as ABBYY OCR or Remark Office OMR, the software is available as a web service and does not require you to install any type of software or buy compatible hardware to scan the surveys. 
This allows you to start creating the survey for your research immediately. </p>
<p>Getting started is easy as you only need to register and create a survey form online and print it. Once you have several responses collected just scan the pages and upload the scanned documents. </p>
<h2>Easy to use survey designer</h2>
<p>We built the survey designer to be as simple as possible for the user to set up their first paper survey. The generated paper layout is automatically optimized for the automatic form processing and includes all required marks to help with image processing and field recognition.</p>
<h2>Handle any scale</h2>
<p>Our data processing software is designed to handle large research projects and we are able to process an unlimited number of pages.</p>
<h2>Online survey collector</h2>
<p>Do you need an ability to collect responses via web surveys? Or would you like to enter the data into the system by typing manually? Web surveys may be optionally enabled allowing you to collect data from multiple sources and store all data in one location.</p>
<h2>Analyzing results online</h2>
<p>You may analyze your results online as soon as you upload and data is processed (Usually within 20 minutes). Exporting results from our platform is simple and fast.</p>
<p>Are you ready to create your first form to automate your data processing? <a href="https://www.papersurvey.io/app/auth/register">Click here</a> to register and try out our data capturing software today.</p>]]>
            </summary>
                                    <updated>2026-04-30T14:15:48+00:00</updated>
        </entry>
            <entry>
            <title><![CDATA[PAPI: Pen-and-Paper Personal Interview Questionnaires]]></title>
            <link rel="alternate" href="https://www.papersurvey.io/blog/papi-pen-and-paper-personal-interviews" />
            <id>https://www.papersurvey.io/11</id>
            <author>
                <name><![CDATA[PaperSurvey.io]]></name>
            </author>
            <summary type="html">
                <![CDATA[<h1>PAPI: Pen-and-Paper Personal Interview Questionnaires</h1>
<p>The Pen-and-Paper Personal Interview (PAPI) approach describes any survey type that uses pen-and-paper rather than digital devices to collect the information. While numerous surveys now often utilize CAPI (Computer-Assisted Personal Interviews), pen-and-paper methods offer several significant advantages over electronic methods that are likely to be important to the researcher.</p>
<h3>Advantages of Pen-and-Paper interviews</h3>
<p>Contrary to computer-aided interviews, pen and paper and methods require almost no technical expertise to be carried out. The implementation of the survey design can be very flexible.</p>
<p>This means that pen and paper surveys can be iterated very quickly on a small scale. It makes them ideal for data collection pilots, where continuous redevelopment or reorganization of surveys is needed. CAPI surveys may cause the whole survey to fail, with even little modification, which means that small iterative changes can take a lot of work.</p>
<p>With Pen-and-Paper questionnaires you are likely able to collect more responses as you won't be limited to a number of tablets/computers you have. You may print as many copies as your research team requires. </p>
<h3>Disadvantages of Pen-and-Paper interviews</h3>
<p>The main disadvantage of Pen-and-Paper interviews is data entry. If the data is being entered manually, it takes a lot of time to enter the data into the sheets or databases. </p>
<p>The majority of the automatic data processing solutions are expensive and require platform-specific software to be installed on the computer, which makes the Pen-and-Paper data collection less convenient.</p>
<h2>Technology-assisted solution for Pen-and-Paper interviews</h2>
<p><a href="https://www.papersurvey.io">papersurvey.io</a> provides technology for creating Pen-and-Paper forms with an automatic checkmark and handwritten text recognition.</p>
<p>As the software is cloud-based, so you may scan and upload your Pen-and-Paper forms to be processed automatically. The results can then be analyzed almost instantly.</p>
<p>Our cost-effective pricing structure is suitable for small to large organizations. Custom solutions are available for enterprise clients to support your data collection requirements by closely working with our experienced research team.  </p>
<p>Read more about <a href="https://www.papersurvey.io">paper form data entry</a> and create your new Pen-and-Paper form in minutes.</p>]]>
            </summary>
                                    <updated>2026-04-30T14:15:48+00:00</updated>
        </entry>
            <entry>
            <title><![CDATA[How to generate barcodes with Microsoft Word Mail Merge in your paper surveys]]></title>
            <link rel="alternate" href="https://www.papersurvey.io/blog/how-to-use-mailmerge-with-paper-surveys" />
            <id>https://www.papersurvey.io/10</id>
            <author>
                <name><![CDATA[PaperSurvey.io]]></name>
            </author>
            <summary type="html">
                <![CDATA[<h1>How to generate barcodes with Microsoft Word Mail Merge in your paper surveys</h1>
<p>For multi-page surveys, created with <a href="https://www.papersurvey.io">papersurvey.io</a> you must have an additional unique barcode on each page bottom-left corner. One-page surveys may also be uniquely marked but only if you would like to include some identification number: </p>
<ul>
<li><em>The barcode on the bottom-left side is used to identify a respondent.</em></li>
<li><em>The barcode on the bottom-right side is used to identify the survey and page.</em> 
<img src="/images/blog/barcodes.png" alt="barcodes" /></li>
</ul>
<p>If you for some reason can't print unique barcodes on each page, you have an ability to disable the barcodes in the survey settings. If you do so, you must upload each copy as a separate PDF file (Suppose you have a survey with three pages and 5 people that have written their responses. You will need to upload 5 pdf files, each having three pages)</p>
<blockquote>
<p>Having unique barcodes on survey pages allows you to simplify paper scanning and ensure the scanned pages are assigned to the correct entry.</p>
</blockquote>
<ul>
<li><em>You will not need to care about the order of scanned pages.</em></li>
<li><em>You may scan all pages from multiple respondents in a single file and simply upload it. We'll take care of it automatically.</em></li>
<li><em>Duplicated scans will not create duplicate responses.</em></li>
</ul>
<h3><strong>Two methods</strong> to insert the barcode at the bottom-left corner:</h3>
<p><img src="/images/blog/print-copies-modal.png" alt="medium" /></p>
<ol>
<li>Automatically<ul>
<li>Useful when you don't need to insert any additional information.</li>
<li>You may provide your list of identifiers to be inserted as the bottom-left barcode.</li>
<li>You may select how many copies you need and we will generate a file with the requested number of copies.</li>
</ul>
</li>
<li>Manually (with Microsoft Word mail merge)<ul>
<li>Useful when you would like to insert the additional information such as names, addresses, print cover pages or generate barcodes by yourself.</li>
<li>Slightly more complicated.</li>
</ul>
</li>
</ol>
<h2>Automatically create.</h2>
<p>As mentioned above, this method is rather easy and simple and you only need to provide the number of copies you need or paste a list of identifiers you would like to use.</p>
<p>If you requested more than 5 copies, we will send the PDF file to your email address. </p>
<p>If you only need 5 or fewer copies, you will be able to download the PDF file instantly.</p>
<h2>Microsoft Word mail merge</h2>
<p>This method is a slightly more advanced method as you will need to follow several steps to finalize your survey setup. Also, it is quite error-prone, so please follow all steps to avoid the errors. </p>
<h3>Download the file</h3>
<p><img src="/images/blog/print-page.png" alt="medium" /></p>
<p>Once you have a survey ready to be printed, go to the "Print" section of your survey and click a green "Print" button. The modal window will open allowing you to download a ZIP file.</p>
<h3>Extract the file.</h3>
<p><img src="/images/blog/mailmerge-download.png" alt="medium" /></p>
<p>You should extract the downloaded ZIP file where you will find three files:</p>
<ol>
<li><strong>README.txt</strong> - a short guide on how to use the mail merge.</li>
<li><strong>document.docx</strong> - Microsoft Word file for the mail merge. </li>
<li><strong>LibreBarcode39Text-Regular.ttf</strong> - Barcode 39 font. </li>
</ol>
<h3>Install the Barcode 39 font</h3>
<p>Open <strong>LibreBarcode39Text-Regular.ttf</strong> file and install this font in your system. This will allow you to generate barcodes with mail merge.</p>
<p><strong>You should restart Microsoft Word after installing the font for it to appear in available fonts.</strong></p>
<h3>Insert a barcode field</h3>
<p><img src="/images/blog/microsoft-word-mailmerge.png" alt="medium" /></p>
<ol>
<li>Open the <strong>document.docx</strong> with Microsoft Word.</li>
<li>Create or import your Recipient list by clicking on the "Edit recipient list".</li>
<li>Click on the "Insert merge field" to insert a barcode.</li>
<li>Position the field at the bottom-left corner of the page:
<img src="/images/blog/identifier.png" alt="small" /></li>
<li>Right-click on the field to change the font:
<img src="/images/blog/change-font.png" alt="small" /></li>
<li>Select "Libre Barcode 39 Text" with 26 font-size:
<img src="/images/blog/select-font.png" alt="small" /></li>
<li>The resulting field should look similar to this:
<img src="/images/blog/selected-font.png" alt="small" /></li>
<li>You may also click "Preview Results" to see how it looks with actual data:
<img src="/images/blog/sample-field.png" alt="small" /></li>
<li>You should copy these fields to all of your pages.</li>
</ol>
<h2>Barcode encoding - The most important part</h2>
<p>The barcode texts must be encoded to generate a valid and recognizable barcode.</p>
<p><strong>Barcode 39</strong> text must be wrapped in asterisks. e.g. <code>123</code>  must be encoded as <code>*123*</code> 
Other barcodes have different encoding requirements. We chose <em>Barcode 39</em> as it is simplest. You may as well use any other barcode type (QR, Codabar, Code 128, EAN-13/UPC-A, UPC-E, EAN-8) if you like. Just do not forget to correctly encode it.</p>
<p><strong>Your ID must start with <code>*</code> and end with <code>*</code></strong></p>
<p>Below are two barcodes. The left one is not-encoded and will not be readable. On the right, a barcode is correctly encoded. 
If your barcode is very short, it is likely you have forgotten to put the asterisks at the start and end.</p>
<p><img src="/images/blog/barcode-invalid.png" alt="small" /></p>
<p>Another common problem is to also apply barcode font to the whitespace characters. Suppose we have text as <code>*123*_</code> (where _ is white space and * is the encoding). As it ends with a trailing space, a barcode will not be recognized:</p>
<p><img src="/images/blog/barcode-with-spaces.png" alt="small" /></p>
<p>To double-check the barcode was generated correctly we would highly recommend you to download a barcode scanner app (e.g. <a href="https://play.google.com/store/apps/details?id=com.google.zxing.client.android">for Android</a>, <a href="https://itunes.apple.com/us/app/qr-code-reader-barcode/id903799541?mt=8">for iOS</a>) on your phone and check if the printed barcode can be read by the app. If it is, your barcode is encoded correctly. </p>
<h3>Finalize</h3>
<p>Add any additional information you need and print the pages!</p>
<p>That's it!</p>
<p>Hope you found this guide useful. If you are having some trouble, feel free to contact us at <a href="mailto:hello@papersurvey.io">hello@papersurvey.io</a>.</p>]]>
            </summary>
                                    <updated>2026-04-30T14:15:48+00:00</updated>
        </entry>
            <entry>
            <title><![CDATA[Paper Surveys with Scanning]]></title>
            <link rel="alternate" href="https://www.papersurvey.io/blog/paper-surveys-with-scanning" />
            <id>https://www.papersurvey.io/9</id>
            <author>
                <name><![CDATA[PaperSurvey.io]]></name>
            </author>
            <summary type="html">
                <![CDATA[<h1>Paper Surveys with Scanning</h1>
<p>Collect data on paper forms to reach your target audience. <a href="https://www.papersurvey.io">PaperSurvey.io</a> specializes solely in paper-based survey questionnaires creation and recognition. </p>
<h2>Data validation &amp; verification</h2>
<p>Mistakes can happen an do happen in manual data entry.</p>
<p><a href="https://www.papersurvey.io">PaperSurvey.io</a> uses advanced algorithms and machine learning to recognize scanned paper surveys. This reduces data entry errors to a minimum level. All checkboxes are recognized with 99.99% accuracy.</p>
<p>However, if the machine is not certain about the correctness of the answer (incorrectly filled, bad scan quality, etc), the response will be flagged for additional verification by you.</p>
<p>At the moment, all recognized handwritten text fields require additional verification, but you may choose yourself how accurate your text needs to be.</p>
<h2>Open response questions</h2>
<p>Respondents are presented with a box to write text.</p>
<p>Unlike other data entry solutions, we ask to write the text in free text boxes.</p>
<h2>Page stamping</h2>
<p>For paper surveys with two or more pages, by default, we enable page stamping - uniquely mark each page with a barcode on the bottom-left side of the page.</p>
<p>The barcode on the bottom-right side is used to  a respondent and the other barcode is to determine survey and page.</p>
<p>This feature ensures we match the pages correctly even if all responses are scanned in a single or separate files.</p>
<p>Type a number of copies you need and we will email you a single PDF file for printing.</p>
<p>If you wish, you can also enable this feature on single page surveys.</p>]]>
            </summary>
                                    <updated>2026-04-30T14:15:48+00:00</updated>
        </entry>
            <entry>
            <title><![CDATA[Looking for FormScanner OMR Alternative?]]></title>
            <link rel="alternate" href="https://www.papersurvey.io/blog/formscanner-alternative" />
            <id>https://www.papersurvey.io/8</id>
            <author>
                <name><![CDATA[PaperSurvey.io]]></name>
            </author>
            <summary type="html">
                <![CDATA[<h1>Looking for FormScanner OMR Alternative?</h1>
<p>You’re in the right place. PaperSurvey.io offers an OMR (optical mark recognition) and HTR (handwritten text recognition) survey solution suitable for small to large businesses.</p>
<h3>Cloud-based software</h3>
<p>PaperSurvey.io is a cloud-based software. Therefore, you may create and process paper surveys on any platform (Windows, Mac or Linux) or device. You may even upload scanned files from your phone.</p>
<h4>No software upgrades and maintenance</h4>
<p>Traditional software installable in computers licensing fees are not cheap, and the IT infrastructure costs, training, and support costs and upgrade fees. This can make the total cost of software prohibitive for many businesses.</p>
<p>As PaperSurvey is a software as a service, all upgrades are managed by us.</p>
<h3>Email scanned documents</h3>
<p>You may also send the scanned documents to an email address (e.g. <strong>myaddress@upload.papersurvey.io</strong>) and get them processed automatically.</p>
<h3>Monthly/Yearly billing</h3>
<p>Only need to use the survey platform for a few months? Simply cancel when you no longer need it. </p>]]>
            </summary>
                                    <updated>2026-04-30T14:15:48+00:00</updated>
        </entry>
            <entry>
            <title><![CDATA[Automated data processing with paper-based forms]]></title>
            <link rel="alternate" href="https://www.papersurvey.io/blog/automated-form-processing-paper-forms" />
            <id>https://www.papersurvey.io/7</id>
            <author>
                <name><![CDATA[PaperSurvey.io]]></name>
            </author>
            <summary type="html">
                <![CDATA[<h1>Automated data processing with paper-based forms</h1>
<p>Are you currently collecting data on paper forms and entering data manually? There is a better way. In this post, I'll describe how you can minimize manual data entry costs by automating form capture and processing. </p>
<p><a href="https://www.papersurvey.io">papersurvey.io</a> provides an easy and cost-effective technology for creating paper-based forms with a checkmark and handwritten text recognition:</p>
<ul>
<li>Scan an unlimited number of documents.</li>
<li>Create surveys with an unlimited number of questions and pages.</li>
<li>Recognize documents from photos, deskew images and automatically rotate pages.</li>
<li>Scan duplex of simplex questionnaires.</li>
<li>Uniquely mark each paper copy to avoid duplicate scans and automatically sort the pages.</li>
</ul>
<h2>Data Entry from paper-based forms</h2>
<p>Setup your questionnaire on <a href="https://www.papersurvey.io">papersurvey.io</a> for collecting data via paper forms. Once you are ready and happy how the survey looks like, just print your survey forms and distribute them to your respondents or the data collector staff. </p>
<p>You do not need to worry about the design of the form. Our survey builder creates an optimized layout so the forms are readable by machine and do not require any adjusting.</p>
<p>The data entry is automated. You only need to scan the filled sheets and upload to our cloud platform. Within minutes of uploading, you will be able to analyze the quantitative data. </p>
<h2>Cloud-based software</h2>
<p>Unlike most of the alternatives such as ABBYY OCR or Remark Office OMR, the software is available as a web service and does not require you to install any type of software or buy compatible hardware to scan the surveys. 
This allows you to start creating the survey for your research immediately. </p>
<p>You never need to worry about backing up your data as we automatically back it up several times a day and store in encrypted storage. Read our <a href="https://www.papersurvey.io/security">security statement</a> to learn more about it.</p>
<p>Our advanced image processing allows capturing responses from forms scanned </p>
<p>Getting started is easy as you only need to register and create a survey form online and print it. Once you have several responses collected just scan the pages and upload the scanned documents. </p>
<h2>Easy to use survey designer</h2>
<p>We built the survey designer to be as simple as possible for users setup their first paper survey. The generated paper layout is automatically optimized for the automatic form processing and includes all required marks to help with image processing and field recognition.</p>
<h2>Scanning paper-based forms</h2>
<p>You may use any type of scanner to scan the completed documents. You may as well capture paper forms using your mobile phone. Generally, scanning with a document feeder is much more efficient. However, our software is designed to recognize documents from the photos as well.</p>
<h2>Handle any scale</h2>
<p>Our data processing software is designed to handle a large number of documents and can scale dynamically. Therefore, we are able to process thousands of scans per hour. </p>
<h2>Accurate optical mark recognition</h2>
<p>Our software correctly identifies 99.99% of the checkmarks. If the calculated accuracy is lower than a certain threshold, a response will be flagged for you to review and manually verify the answer.</p>
<p>You may choose between two recognition modes to suit your requirements:</p>
<ul>
<li>Check or fill the box to respond (default mode)</li>
<li>Check to respond, fill to unmark</li>
</ul>
<h2>Online survey collector</h2>
<p>Do you need to collect the surveys from both paper-based forms as well as web surveys? Or would you like to enter the data into the system manually on certain occasions? Web surveys may be optionally enabled allowing you to collect data from multiple sources and store in one location.</p>
<h2>Analyzing results online</h2>
<p>You may analyze your results online as soon as you upload and data is processed. Exporting results from our database is simple and fast.</p>
<p>Are you ready to create your first form to automate your data processing? <a href="https://www.papersurvey.io/app/auth/register">Click here</a> to register and try out our data capturing software today.</p>]]>
            </summary>
                                    <updated>2026-04-30T14:15:48+00:00</updated>
        </entry>
            <entry>
            <title><![CDATA[Looking for a Moodle Quiz OMR Alternative?]]></title>
            <link rel="alternate" href="https://www.papersurvey.io/blog/moodle-quiz-omr-alternative" />
            <id>https://www.papersurvey.io/5</id>
            <author>
                <name><![CDATA[PaperSurvey.io]]></name>
            </author>
            <summary type="html">
                <![CDATA[<h1>Looking for a Moodle Quiz OMR Alternative?</h1>
<p align="center">
<img src="/images/blog/moodle.jpg" />
</p>
Moodle Quiz OMR is a Moodle (open-source learning management system) that allows us to conduct assessments on paper and synchronize results in the grading system. Unfortunately, it has not been maintained and the last update has been made in 2010.
<br />
<br />
Try PaperSurvey.io software to replace Moodle Quiz OMR in your institution.
<br />
<br />
PaperSurvey.io offers an OMR (optical mark recognition) and HTR (handwritten text recognition) quiz solution suitable for small to medium businesses and academic institutions.
<h3>Optical Mark Recognition and Handwritten text recognition</h3>
<p>PaperSurvey.io recognizes checkboxes and radio boxes automatically from scanned surveys with a 99.99% accuracy. </p>
<p>Handwritten text from open response questions is recognized using a powerful AI handwriting recognition model.</p>
<h3>A cloud-based software</h3>
<p>PaperSurvey.io is a cloud-based software. Therefore, you may create and process paper surveys on any platform. You may even upload scanned files from your phone.</p>
<p><strong>Do you not need:</strong></p>
<ul>
<li>Install any additional software</li>
<li>Be limited to a single device for recognizing scans</li>
<li>Deal with hardware and software updates</li>
<li>Renew licenses</li>
<li>Backup data</li>
<li>Think about scaling issues </li>
</ul>
<h3>Your branding</h3>
<p>Upload your branding logo and customize colors, change the font to make the survey look professional and align with your branding style.</p>
<h3>Monthly/Yearly pricing</h3>
<p>Only need to use the survey platform just for a few months? Simply cancel when you no longer need it and resubscribe when you want to use it again.</p>
<h3>Unique identifiers for multi-page surveys</h3>
<p>Each page includes a unique identifier. This reduces errors, eliminates duplicates and simplifies form scanning and processing.</p>
<p><em>You will receive a single PDF file containing a requested number of copies for printing.</em></p>
<h3>Zapier automation</h3>
<p>Automate document uploads with Zapier actions and receive recognized data with recognition triggers. </p>
<h3>View Results Online</h3>
<p>You can always check your survey results Online immediately on any device and browser and always compare recognized information with actual document images. </p>
<h3>Digitally fillable PDF Forms</h3>
<p>Survey forms can also be completed digitally, without printing and scanning. Just open PDF, fill the form and upload.</p>
<h3>Web forms</h3>
<p>As an additional collection source, collect responses on the web and have all the data in one place.</p>]]>
            </summary>
                                    <updated>2026-04-30T14:15:48+00:00</updated>
        </entry>
            <entry>
            <title><![CDATA[Non-profit sponsorships]]></title>
            <link rel="alternate" href="https://www.papersurvey.io/blog/non-profit-sponsorships" />
            <id>https://www.papersurvey.io/4</id>
            <author>
                <name><![CDATA[PaperSurvey.io]]></name>
            </author>
            <summary type="html">
                <![CDATA[<h1>Non-profit sponsorships</h1>
<p><strong><span style="color:tomato">Due to high demand, we temporarily paused accepting new organizations in our free Non-profit program. Please consider subscribing to our paid plans instead.</span></strong></p>
<p>Are you working in a non-profit organization? We provide our paper survey solution for free for non-profit organizations on a case by case basis.</p>
<h3>How can my organization get a discount?</h3>
<ol>
<li>
<p><a href="/app/auth/register">Create an account</a> and verify the email address.</p>
</li>
<li>
<p>Contact us at <a href="mailto:hello@papersurvey.io">hello@papersurvey.io</a> and describe the following information:</p>
<ul>
<li>Name of your non-profit</li>
<li>Proof of your nonprofit status with your local government</li>
<li>Describe your use case and what data you plan to collect</li>
<li>The number of responses per month (approximately) you plan to collect.</li>
</ul>
</li>
</ol>
<h3>Limitations</h3>
<ul>
<li>
<p>As the handwriting recognition is expensive for us, open-ended (e.g. Short text answer, Long text answer) questions are <strong>not</strong> going to be automatically transcribed. Thus, you will need to manually enter the text by looking at the scanned fields or you can just keep it in an image format.</p>
<p><em>Close-ended (e.g. single/multiple-choice) questions and Character/Number/Date fields will be recognized automatically</em></p>
</li>
<li>
<p>Includes Standard plan features only (plus Team Access).</p>
</li>
<li>
<p>Not valid for academic institutions.</p>
</li>
<li>
<p>In exchange for free service, we will ask to mention us on your website.</p>
</li>
</ul>]]>
            </summary>
                                    <updated>2026-04-30T14:15:48+00:00</updated>
        </entry>
            <entry>
            <title><![CDATA[How to create a paper-based survey]]></title>
            <link rel="alternate" href="https://www.papersurvey.io/blog/how-to-create-paper-based-survey" />
            <id>https://www.papersurvey.io/3</id>
            <author>
                <name><![CDATA[PaperSurvey.io]]></name>
            </author>
            <summary type="html">
                <![CDATA[<h1>How to create a paper-based survey</h1>
<p>Using the PaperSurvey.io data entry platform you may easily create and manage your paper-based questionnaires.</p>
<p>The platform provides an end-to-end solution from creating surveys to processing scanned documents and analyzing the recognized data.</p>
<p>This is a short guide on how to use PaperSurvey.io software and to set up your first survey. We are going to go through all the steps from the registration to the data export.</p>
<p>Want to speed up survey creation? You can start from an existing template and build upon it, choose a pre-built survey from our <a href="/templates">template library</a>.</p>
<h1>Table of Contents</h1>
<ol>
<li><a href="#register-an-account">Register an account</a></li>
<li><a href="#create-a-survey">Create a survey</a></li>
<li><a href="#add-questions-to-a-survey">Add questions to a survey</a><ul>
<li><a href="#question-types">Question types</a><ul>
<li><a href="#multiple-choice">Multiple choice</a></li>
<li><a href="#single-choice">Single choice</a></li>
<li><a href="#multiple-choice-grid--single-choice-grid">Multiple choice (grid) / Single choice (grid)</a></li>
<li><a href="#short-text-answer">Short text answer</a></li>
<li><a href="#range">Range</a></li>
<li><a href="#number">Number</a></li>
<li><a href="#heading">Heading</a></li>
<li><a href="#description">Description</a></li>
</ul>
</li>
<li><a href="#layout-settings">Layout settings</a></li>
</ul>
</li>
<li><a href="#print-paper-survey">Print paper survey</a></li>
<li><a href="#distribute">Distribute</a></li>
<li><a href="#scan-paper-forms">Scan paper forms</a></li>
<li><a href="#upload--process">Upload &amp; Process</a></li>
<li><a href="#verify-responses">Verify responses</a></li>
<li><a href="#analyze-results">Analyze results</a></li>
<li><a href="#export-data">Export data</a></li>
</ol>
<h2>Register an account</h2>
<p>You should first <a href="/app/auth/register">register</a> a new account if you don't have an account already. You may try the service for 14 days, no credit card details required. </p>
<p><img src="/images/blog/register.png" alt="register" /></p>
<h2>Create a survey</h2>
<p>To create a new survey, click <a href="/app/surveys/create">Create Survey</a> in the upper-right corner in your dashboard and choose the survey name and language.</p>
<p><img src="/images/blog/my-surveys.png" alt="my surveys" /></p>
<h3>Add questions to a survey</h3>
<p>Now you may add questions to the survey. To add your first question click "Add your first question" and set the question type you want</p>
<p><img src="/images/blog/add-questions.png" alt="add questions" /></p>
<h4>Question types</h4>
<p>At the time of writing this article, there were 12 question types available, there may be more right now. You may download a <a href="/templates/custom/example-paper-survey-layout">sample survey</a> to see how each question type looks like.</p>
<p>Below is a list of the question types and short descriptions of each type.
<img src="/images/blog/question-types.png" alt="question types" /></p>
<h5>Multiple choice</h5>
<p>This question type is suitable for questions where the respondent can pick more than one response:
<img src="/images/blog/multiple-choice.png" alt="medium" /></p>
<hr />
<h5>Single choice</h5>
<p>This question type is suitable for questions where the respondent can only pick a single answer. If the respondent checked multiple boxes, the response will be flagged for additional verification:
<img src="/images/blog/single-choice.png" alt="medium" /></p>
<hr />
<h5>Multiple choice (grid) / Single choice (grid)</h5>
<p>This question type is very similar to <strong>Multiple choice/Single choice</strong> question type. 
However, the layout is different allowing to fit more questions on the page and is mostly suitable when all question options are identical.</p>
<p><img src="/images/blog/grid.png" alt="small" /></p>
<hr />
<h5>Inline Text</h5>
<p>This question allows us to write a text response. You are able to set the width of the square box:</p>
<p><img src="/images/blog/text.png" alt="small" /></p>
<hr />
<h5>Number</h5>
<p>In the paper survey, the question looks similar to <em>Inline Text</em>. However, this question type only recognizes numeric responses. 
You may choose to have a free-text response box or a field with a specified number of boxes, writing each digit in separate box. We highly recommend the latter as it is much simpler accurately detect and read the numbers written such way.</p>
<p><img src="/images/blog/numbers.png" alt="small" /></p>
<hr />
<h5>Long Text</h5>
<p>Similarly, as an <em>Inline Text</em>, this question allows writing a longer text response to allow entering more text. You may set the box height as long as you want.</p>
<p><img src="/images/blog/text-block.png" alt="small" /></p>
<hr />
<h5>Range</h5>
<p>The range question type allows us to configure a question with a specified number of checkboxes, left and right labels.</p>
<p><img src="/images/blog/range.png" alt="small" /></p>
<hr />
<h4>Heading</h4>
<p>Headings allow to emphasize and separate blocks of questions. There are four different styles/sizes you can choose with an ability to customize the colors</p>
<p><img src="/images/blog/headings.png" alt="small" /></p>
<hr />
<h4>Divider</h4>
<p>Adds a simple horizontal line to separate blocks of questions.</p>
<hr />
<h4>Page break</h4>
<p>Adds a page break and shift all questions to the next page. Useful when you would like to add the following questions on the next page.</p>
<hr />
<h4>Description</h4>
<p>Using this question type you may add some informational text in any part of the survey. You may wish to <a href="/blog/markdown-survey-formatting-paper-based-surveys">view text formatting options</a> to further customize the text.</p>
<hr />
<h3>Survey settings</h3>
<p>There are several settings available that allow customizing how the layout looks like. You may click on the "Settings" tab to customize how your survey looks like.</p>
<h4>Remove informational header</h4>
<p>By default, we include information on how to respond (see below). If you would like to remove it. Just enable this setting.</p>
<p><img src="/images/blog/information.png" alt="small" /></p>
<h4>Remove default help text</h4>
<p>By default, we include default help text that you can customize or completely remove with this setting.</p>
<p><img src="/images/blog/help-text.png" alt="small" /></p>
<h2>Preview</h2>
<p>Open the "Preview" tab to instantly preview how your survey would look like. It may take several seconds to generate it, depending on how long is your survey. </p>
<h2>Print paper survey</h2>
<p><img src="/images/blog/printing.png" alt="tiny" /></p>
<p>Once you have added all the questions you need and you are happy how the survey looks like, it is time to print it. Depending on how many pages you have in the survey, one or two barcodes will be included on the footer of the survey.</p>
<p>If the survey has only <strong>one page</strong>, we will include one QR code on the bottom-right side of the page. This allows us to easily identify which survey you are uploading.</p>
<p>If there are <strong>two or more pages</strong>, an additional barcode on the bottom-left side of the page will be generated. This additional QR code ensures you are not uploading the same survey twice and simplify the uploading process.</p>
<blockquote>
<p>For instance, if you have a 3-page survey with 10 respondents, there will be 30 pages to scan. You may drop the sheets on the ground, shuffle it several times and upload the scanned documents in any order. We will still match all pages in the correct order.</p>
</blockquote>
<p><em>If you wish, you may enable the additional barcode to be included in one-page surveys too. For multiple-page surveys, you can disable the bottom-left barcode, but you will need to upload each set of pages in a separate PDF/TIFF file.</em></p>
<h2>Scan paper forms</h2>
<p><img src="/images/blog/scanner.png" alt="tiny" /></p>
<p>Once you have some responses collected you may scan them for recognition. We advise on making a few test scans to test your printer and scanner. Sometimes with budget printers, there are problems where printers crop the bottom part of the survey.</p>
<p>If you don't have a scanner already or planning to upgrade, please take a look at our <a href="/blog/recommended-scanners-for-paper-based-survey-processing">Best document scanners for paper-based surveys recognition</a> guide.</p>
<h2>Upload &amp; Process</h2>
<p><img src="/images/blog/upload.png" alt="tiny" /></p>
<p>After you have scanned the files, you may finally upload them.</p>
<p>We provide several ways to upload scanned documents:</p>
<ol>
<li><strong>Upload</strong> - go to the website and select the files to upload.</li>
<li><strong>Email</strong> - send an email and it will be automatically processed.</li>
<li><strong>Zapier</strong> - connect other applications to papersurvey.io and streamline uploads<ul>
<li>This allows optimizing the workflow in any way you want without needing to code:<ol>
<li>Send Gmail attachments to PaperSurvey.io for processing</li>
<li>Do something when uploaded documents are recognized (e.g. to send data to your database)</li>
</ol>
</li>
</ul>
</li>
<li><strong>Dropbox</strong> integrations -  upload scanned files to a selected folder and we will automatically sync it when a file is added to Dropbox.</li>
<li><strong>Android application</strong> - (coming soon) Scan and automatically crop documents using an Android app and instantly upload documents to PaperSurvey.io.</li>
<li><strong>Programmatic access (API)</strong> - (requires Enterprise Plus plan) develop custom integrations to interact and upload files to PaperSurvey.io from your CRM or app.</li>
</ol>
<h2>Verify responses</h2>
<p><img src="/images/blog/verify.png" alt="tiny" /></p>
<p>In certain cases, checkboxes may not be recognized (very rarely). We will flag these responses for you to double-check and pick the correct response. </p>
<p>Open response questions such as <em>Long text answers</em> and <em>Short text answers</em> are recognized automatically, but we ask you to double-check if it was read correctly.</p>
<h2>Analyze results</h2>
<p><img src="/images/blog/report.png" alt="tiny" /></p>
<p>Although, at the moment quite limited, you may able to see the basic statistics in word clouds and bar charts to analyze the collected data. </p>
<p>Please reach out to us if you like to see different analysis methods and we will try to add them.</p>
<h2>Export Data</h2>
<p><img src="/images/blog/folder.png" alt="tiny" /></p>
<p>The software allows exporting data to two most common formats for the additional data analysis: </p>
<ul>
<li>CSV</li>
<li>Excel</li>
<li>Excel with images - Includes text responses as images</li>
<li>SPSS</li>
</ul>
<p>Currently, we cannot export your uploaded files in bulk, but you can download the uploaded files, one by one.</p>]]>
            </summary>
                                    <updated>2026-04-30T14:15:48+00:00</updated>
        </entry>
            <entry>
            <title><![CDATA[The Best Document Scanners for Paper Survey Processing]]></title>
            <link rel="alternate" href="https://www.papersurvey.io/blog/recommended-scanners-for-paper-based-survey-processing" />
            <id>https://www.papersurvey.io/2</id>
            <author>
                <name><![CDATA[PaperSurvey.io]]></name>
            </author>
            <summary type="html">
                <![CDATA[<p><em>Last updated: April 2026. Scanner models change every few years. The features and criteria in this guide (ADF, speed, resolution) remain relevant even as specific models are replaced by newer versions. When shopping, look for the successor to any discontinued model listed here.</em></p>
<p><a href="https://www.papersurvey.io">PaperSurvey.io</a> works with scans from any device, whether that is a dedicated document scanner, a multifunction printer, or a phone with a scanning app. The platform handles image normalization, rotation correction, and quality checks regardless of the source.</p>
<p>Your choice of scanning method mainly affects speed. Scanning 500 pages on a document feeder takes 10-20 minutes. Scanning the same stack one page at a time on a flatbed takes hours.</p>
<h2>You Probably Already Have a Scanner</h2>
<p>Before buying anything, check what is already available in your office. Most offices have a multifunction copier or printer with a document feeder built in. These typically scan at 15-30 pages per minute with a 50-100 sheet ADF. That is more than enough for regular survey processing.</p>
<p>Walk over to your office copier, look for a document feeder tray on top, and try scanning a few pages to PDF. If it works, you are ready to start using <a href="https://www.papersurvey.io">PaperSurvey.io</a> today without spending anything on hardware. You only need a dedicated scanner if your office machine is too slow for your volume, or if you do not have access to one.</p>
<h2>All Scanners at a Glance</h2>
<p>The "500 pages" column estimates real-world time including scanning, reloading, and aligning pages between batches (~1 minute per reload).</p>
<table>
<thead>
<tr>
<th>Scanner</th>
<th>Category</th>
<th>Speed (pages/min)</th>
<th>ADF (sheets)</th>
<th>500 pages</th>
<th>Price</th>
</tr>
</thead>
<tbody>
<tr>
<td>Phone scanning app</td>
<td>Mobile</td>
<td>~6</td>
<td>N/A</td>
<td>~80 min</td>
<td>Free</td>
</tr>
<tr>
<td>Epson DS-530 II</td>
<td>Compact</td>
<td>35</td>
<td>50</td>
<td>~23 min</td>
<td>$300-$350</td>
</tr>
<tr>
<td>Epson WorkForce ES-580W</td>
<td>Compact</td>
<td>35</td>
<td>100</td>
<td>~19 min</td>
<td>$350-$400</td>
</tr>
<tr>
<td>Brother ADS-4300N</td>
<td>Compact</td>
<td>40</td>
<td>80</td>
<td>~19 min</td>
<td>$350-$400</td>
</tr>
<tr>
<td>Brother ADS-4700W</td>
<td>Compact</td>
<td>40</td>
<td>80</td>
<td>~19 min</td>
<td>$400-$500</td>
</tr>
<tr>
<td>Ricoh fi-8040</td>
<td>Compact</td>
<td>40</td>
<td>50</td>
<td>~22 min</td>
<td>$500-$550</td>
</tr>
<tr>
<td>Kodak Alaris E1040</td>
<td>Compact</td>
<td>40</td>
<td>80</td>
<td>~19 min</td>
<td>$500-$600</td>
</tr>
<tr>
<td>Fujitsu ScanSnap iX2500</td>
<td>Compact</td>
<td>45</td>
<td>100</td>
<td>~16 min</td>
<td>$400-$500</td>
</tr>
<tr>
<td>Canon DR-S250N</td>
<td>Compact</td>
<td>50</td>
<td>60</td>
<td>~18 min</td>
<td>$600-$650</td>
</tr>
<tr>
<td>Your office copier</td>
<td>Already owned</td>
<td>15-30</td>
<td>50-100</td>
<td>~25-40 min</td>
<td>Free</td>
</tr>
<tr>
<td>HP OfficeJet Pro</td>
<td>Multifunction</td>
<td>10-20</td>
<td>35-50</td>
<td>~48 min</td>
<td>$200-$350</td>
</tr>
<tr>
<td>Epson WorkForce Pro</td>
<td>Multifunction</td>
<td>15-25</td>
<td>35-50</td>
<td>~35 min</td>
<td>$200-$400</td>
</tr>
<tr>
<td>Epson WorkForce DS-870</td>
<td>Production</td>
<td>65</td>
<td>100</td>
<td>~12 min</td>
<td>$600-$800</td>
</tr>
<tr>
<td>Kodak Alaris S2070</td>
<td>Production</td>
<td>70</td>
<td>80</td>
<td>~13 min</td>
<td>$900-$1,000</td>
</tr>
<tr>
<td>Fujitsu fi-8170</td>
<td>Production</td>
<td>70</td>
<td>100</td>
<td>~12 min</td>
<td>$800-$1,000</td>
</tr>
<tr>
<td>Kodak Alaris S3060</td>
<td>Large capacity</td>
<td>60</td>
<td>300</td>
<td>~10 min</td>
<td>$1,500-$2,000</td>
</tr>
<tr>
<td>Fujitsu fi-7600</td>
<td>Large capacity</td>
<td>100</td>
<td>300</td>
<td>~7 min</td>
<td>$2,500-$3,000</td>
</tr>
<tr>
<td>Canon DR-G2140</td>
<td>Large capacity</td>
<td>140</td>
<td>500</td>
<td>~4 min</td>
<td>$4,000-$5,000</td>
</tr>
</tbody>
</table>
<h2>What Matters for Survey Scanning</h2>
<p><strong>Automatic Document Feeder (ADF)</strong> is the most important feature. It lets you load a stack of pages and scan them continuously. Without one, you place each page by hand. For any volume above 30 pages, an ADF is essential.</p>
<p><strong>Speed</strong> ranges from 10 to 140 pages per minute. For most survey work, 35-45 ppm is comfortable. Higher speeds matter when you process thousands of pages daily.</p>
<p><strong>Resolution</strong> of 300 DPI works well for all survey types, including handwriting recognition. Higher resolutions are unnecessary and only slow things down.</p>
<h2>Phone Scanning Apps</h2>
<p>For batches under 50 pages, a phone with a scanning app works. Use a dedicated scanning app (Apple Notes scanner, Adobe Scan, or Microsoft Lens) rather than taking regular photos. Camera photos often have uneven lighting and perspective distortion that reduce recognition accuracy. Scanning apps correct for this automatically.</p>
<h2>Compact Desktop Scanners</h2>
<p>The best option for most users. These are standalone devices built for scanning, faster and more reliable than multifunction printers.</p>
<p>The <strong>Fujitsu ScanSnap iX2500</strong> (45 ppm, 100-sheet ADF, $400-$500) is the most popular in this category, widely used in education and research. The <strong>Epson WorkForce ES-580W</strong> (35 ppm, 100-sheet ADF, $350-$400) and <strong>Brother ADS-4700W</strong> (40 ppm, 80-sheet ADF, $400-$500) are solid alternatives.</p>
<p>All three support scan-to-email, which works well with PaperSurvey.io's email upload feature.</p>
<h2>Multifunction Printers</h2>
<p>If you also need to print your surveys, a multifunction printer with an ADF handles both jobs. The <strong>HP OfficeJet Pro</strong> and <strong>Epson WorkForce Pro</strong> series both include ADFs with 35-50 sheet capacity. Scanning speed is slower (10-25 ppm), but you save desk space and cost by combining two devices. Adequate for under 200 pages per session.</p>
<h2>Production Scanners</h2>
<p>For organizations processing thousands of pages daily. The <strong>Epson WorkForce DS-870</strong> (65 ppm, $600-$800) and <strong>Fujitsu fi-8170</strong> (70 ppm, $800-$1,000) both have 100-sheet ADFs and are built for continuous operation.</p>
<h2>Large-Capacity Scanners (300+ Sheet ADF)</h2>
<p>For loading several hundred pages at once without reloading.</p>
<p>The <strong>Kodak Alaris S3060</strong> (60 ppm, 300-sheet ADF, $1,500-$2,000) is the sweet spot. You can scan a full classroom of exams in a single batch. The <strong>Fujitsu fi-7600</strong> (100 ppm, 300-sheet ADF, $2,500-$3,000) is faster and popular in universities. The <strong>Canon DR-G2140</strong> (140 ppm, 500-sheet ADF, $4,000-$5,000) is for national-scale survey programs.</p>
<h2>Scanner Settings for PaperSurvey.io</h2>
<ul>
<li><strong>Resolution:</strong> 300 DPI</li>
<li><strong>Color mode:</strong> Grayscale (smaller files) or color (both work)</li>
<li><strong>File format:</strong> PDF (multi-page PDF for batches)</li>
<li><strong>Duplex:</strong> Enable if surveys are printed double-sided</li>
<li><strong>Blank page removal:</strong> Disable. Scanners sometimes skip lightly marked pages.</li>
</ul>
<h2>Scan-to-Email</h2>
<p>Many scanners can scan directly to an email address. PaperSurvey.io provides a unique upload email for each survey. Set this address on your scanner once, and anyone can feed pages and press scan without needing access to a computer or the PaperSurvey.io dashboard.</p>
<h2>Recommendations by Use Case</h2>
<table>
<thead>
<tr>
<th>Use case</th>
<th>Recommended option</th>
<th>Why</th>
</tr>
</thead>
<tbody>
<tr>
<td>Under 10 pages, one-off</td>
<td>Phone scanning app</td>
<td>Free, no hardware needed</td>
</tr>
<tr>
<td>Under 50 pages, occasional</td>
<td>HP OfficeJet Pro or Epson WorkForce Pro</td>
<td>You likely already have one</td>
</tr>
<tr>
<td>50-500 pages, regular</td>
<td>ScanSnap iX2500 or Brother ADS-4700W</td>
<td>80-100 sheet ADF, fast, reliable</td>
</tr>
<tr>
<td>Need to print surveys too</td>
<td>HP OfficeJet Pro or Epson WorkForce Pro</td>
<td>Two devices in one</td>
</tr>
<tr>
<td>500+ pages, load and go</td>
<td>Kodak Alaris S3060</td>
<td>300-sheet ADF, no constant reloading</td>
</tr>
<tr>
<td>1,000+ pages daily</td>
<td>Fujitsu fi-7600 or Canon DR-G2140</td>
<td>Production speed and capacity</td>
</tr>
</tbody>
</table>
<p>For most survey and exam processing, a compact desktop scanner in the $350-$500 range will serve you well for years. A dedicated scanner with a document feeder will always produce better, more consistent results than a phone camera, so it is worth the investment if you plan to process surveys regularly.</p>]]>
            </summary>
                                    <updated>2026-04-30T14:15:48+00:00</updated>
        </entry>
            <entry>
            <title><![CDATA[Text formatting guide for paper-based surveys]]></title>
            <link rel="alternate" href="https://www.papersurvey.io/blog/markdown-survey-formatting-paper-based-surveys" />
            <id>https://www.papersurvey.io/1</id>
            <author>
                <name><![CDATA[PaperSurvey.io]]></name>
            </author>
            <summary type="html">
                <![CDATA[<h1>Text formatting guide for paper-based surveys</h1>
<p><a href="https://www.papersurvey.io">PaperSurvey.io</a> supports a small subset of <a href="https://en.wikipedia.org/wiki/Markdown">markdown</a> syntax for adjusting text formatting as well as some papersurvey.io specific commands. These may be beneficial for emphasizing certain words in the survey or changing the layout.</p>
<h2>Text formatting</h2>
<h3>Color</h3>
<p>To change color you just need to use <code>[color=color_code]text[/color]</code> shortcode. <code>color_code</code> is a HEX color code. You may use <a rel="nofollow" target="_blank" href="https://htmlcolorcodes.com/color-picker/">this color picker</a> to find a color you want to use.</p>
<p>You may also use <code>[color=primary]</code> and <code>[color=secondary]</code>, which will be "Heading/Divider color" and "Secondary color" accordingly configured in your survey settings.</p>
<div class="text--formatting">
    <div>
        <b>EXAMPLE</b>
        <code>
        [color=ffbc06]Text in yellow[/color]<br />
        [color=3AE50C]Text in green[/color]<br />
        [color=FF0C00]Text in red[/color]<br />
        </code>
    </div>
    <div>
        <b>RESULT</b>
        <code>
        <span style="color:#ffbc06;">Text in yellow</span><br />
        <span style="color:#3AE50C;">Text in green</span><br />
        <span style="color:#FF0C00;">Text in red</span>
        </code>
    </div>
</div>
<h3>Highlight background</h3>
<p>To change background color you just need to use <code>[highlight=color_code]text[/highlight]</code> shortcode. <code>color_code</code> is a HEX color code. You may use <a rel="nofollow" target="_blank" href="https://htmlcolorcodes.com/color-picker/">this color picker</a> to find a color you want to use.</p>
<p>You may also use <code>[highlight=primary]</code> and <code>[highlight=secondary]</code>, which will be "Heading/Divider color" and "Secondary color" accordingly configured in your survey settings.</p>
<div class="text--formatting">
    <div>
        <b>EXAMPLE</b>
        <code>
        [highlight=ffbc06][color=black]Background in yellow, text in black[/color][/highlight]<br />
        [highlight=3AE50C][color=white]Background in black, text in white[/color][/highlight]<br />
        [highlight=FF0C00][color=yellow]Background in red, text in yellow[/color][/highlight]<br />
        </code>
    </div>
    <div>
        <b>RESULT</b>
        <code>
        <span style="background-color:#ffbc06;color: black;">Background in yellow, text in black</span><br />
        <span style="background-color:black; color: white;">Background in black, text in white</span><br />
        <span style="background-color:#FF0C00;color: yellow;">Background in red, text in yellow</span>
        </code>
    </div>
</div>
<h3>Bold</h3>
<p>To make the text bolder you may wrap the text in two <strong>asterisks</strong>.</p>
<div class="text--formatting">
    <div>
        <b>EXAMPLE</b>
        <code>
        Bold text with **asterisks**.
        </code>
    </div>
    <div>
        <b>RESULT</b>
        <code>
        Bold text with <b>asterisks</b>.
        </code>
    </div>
</div>
<h3>Italics</h3>
<p>To make the text written in italics you may wrap the text in one <em>asterisk</em> or <em>underscore</em>:</p>
<div class="text--formatting">
    <div>
        <b>EXAMPLE</b>
        <code>
            italicize text with *asterisks* or _underscores_.
        </code>
    </div>
    <div>
        <b>RESULT</b>
        <code>
            italicize text with <i>asterisks</i> or <i>underscores</i>
        </code>
    </div>
</div>
<h3>Strikethrough</h3>
<p>To add strike-through you may wrap the text in two <del>tildes.</del></p>
<div class="text--formatting">
    <div>
        <b>EXAMPLE</b>
        <code>
            Strikethrough text with ~~tildes.~~.
        </code>
    </div>
    <div>
        <b>RESULT</b>
        <code>
            Strikethrough text with <span style="text-decoration: line-through;">tildes</span>.
        </code>
    </div>
</div>
<h3>Underline</h3>
<p>To add the underline below the text, use two <strong>underscores</strong>.</p>
<div class="text--formatting">
    <div>
        <b>EXAMPLE</b>
        <code>
            Underline text with two __underscores__.
        </code>
    </div>
    <div>
        <b>RESULT</b>
        <code>
            Underline text with two <u>underscores</u>.
        </code>
    </div>
</div>
<h3>Headings</h3>
<p>To add headings, start the line with one or more <code>#</code> characters followed by a space.</p>
<div class="text--formatting">
    <div>
        <b>EXAMPLE</b>
        <code>
        # Heading 1<br />
        ## Heading 2<br />
        ### Heading 3
        </code>
    </div>
    <div>
        <b>RESULT</b>
        <code>
        <h1 style="margin:0">Heading 1</h1>
        <h2 style="margin:0">Heading 2</h2>
        <h3 style="margin:0">Heading 3</h3>
        </code>
    </div>
</div>
<h3>Unformatted text</h3>
<p>In some cases you may want to unbold or remove italics from a block of text, you may do with a [unformatted] tag.</p>
<div class="text--formatting">
    <div>
        <b>EXAMPLE</b>
        <code>
            **We see bolded text here but [unformatted]here[/unformatted] it isn't**
        </code>
    </div>
    <div>
        <b>RESULT</b>
        <code>
            <b>Bolded text here but</b> here <b>it isn't</b>
        </code>
    </div>
</div>
<h2>Font sizes</h2>
<p>If you would like to change the font size in your text, you may use following short codes:</p>
<div class="text--formatting">
    <div>
        <b>EXAMPLE</b>
        <code>
            [tiny]Text[/tiny]<br/>
            [small]Text[/small]<br/>
            [s]Text[/s]<br/>
            [normal]Text[/normal]<br/>
            [large]Text[/large]<br/>
            [larger]Text[/larger]<br/>
            [xl]Text[/xl]<br/>
            [xxl]Text[/xxl]
        </code>
    </div>
    <div>
        <b>RESULT</b>
        <code>
            <div style="font-size: 8px;">Text</div>
            <div style="font-size: 10px;">Text</div>
            <div style="font-size: 12px;">Text</div>
            <div style="font-size: 14px;">Text</div>
            <div style="font-size: 16px;">Text</div>
            <div style="font-size: 18px;">Text</div>
            <div style="font-size: 20px;">Text</div>
            <div style="font-size: 24px;">Text</div>
        </code>
    </div>
</div>
<h2>Text rotation</h2>
<p>In some cases you would want to rotate the text to fit. You may use the following command to achieve it.</p>
<div class="text--formatting">
    <div>
        <b>EXAMPLE</b>
        <code>
            [rotate=90]Text[/rotate]<br/>
            [rotate=60]Text[/rotate]<br/>
            [rotate=-90]Text[/rotate]<br/>
            [rotate=180]Text[/rotate]
        </code>
    </div>
    <div>
        <b>RESULT</b>
        <code style="flex-direction: row;display: flex;">
            <div style="-webkit-transform: rotate(90deg); -moz-transform: rotate(90deg); width: 40px; height: 40px;">Text</div>
            <div style="-webkit-transform: rotate(60deg); -moz-transform: rotate(60deg); width: 40px; height: 40px;">Text</div>
            <div style="-webkit-transform: rotate(-90deg); -moz-transform: rotate(-90deg); width: 40px; height: 40px;">Text</div>
            <div style="-webkit-transform: rotate(180deg); -moz-transform: rotate(180deg); width: 40px; height: 40px;">Text</div>
        </code>
    </div>
</div>
<h2>Lists</h2>
<p>To display text as a list, just start the line with an asterisk. Currently, only one-level ordered and unordered lists are supported.</p>
<h5>Lists only work in <em>Description</em> type questions!</h5>
<h3>Unordered</h3>
<div class="text--formatting">
    <div>
        <b>EXAMPLE</b>
        <code>
            * One <br />
            * Two  <br />
            * Three <br />
            *this is not in list*           
        </code>
    </div>
    <div>
        <b>RESULT</b>
        <code>
            <ul>
                <li>One</li>
                <li>Two</li>
                <li>Three</li>
            </ul>
            <i>this is not in list</i>
        </code>
    </div>
</div>
<h3>Ordered</h3>
<div class="text--formatting">
    <div>
        <b>EXAMPLE</b>
        <code>
            1. One <br />
            2. Two <br />
            3. Three <br />
            1 this is not in list        
        </code>
    </div>
    <div>
        <b>RESULT</b>
        <code>
            <ol>
                <li>One</li>
                <li>Two</li>
                <li>Three</li>
            </ol>
            this is not in list
        </code>
    </div>
</div>
<h2>Tables</h2>
<p>You can create tables using the pipe (<code>|</code>) character to separate columns. Tables are supported only in <em>Description</em> type questions.</p>
<h3>Basic Table</h3>
<div class="text--formatting">
    <div>
        <b>EXAMPLE</b>
        <code>
| Header 1 | Header 2 | Header 3 |<br/>
|----------|----------|----------|<br/>
| Cell 1   | Cell 2   | Cell 3   |<br/>
| Cell 4   | Cell 5   | Cell 6   |
        </code>
    </div>
    <div>
        <b>RESULT</b>
        <table style="border-collapse: collapse; border: 1px solid black;">
            <thead>
                <tr>
                    <th style="border: 1px solid black; padding: 5px;">Header 1</th>
                    <th style="border: 1px solid black; padding: 5px;">Header 2</th>
                    <th style="border: 1px solid black; padding: 5px;">Header 3</th>
                </tr>
            </thead>
            <tbody>
                <tr>
                    <td style="border: 1px solid black; padding: 5px;">Cell 1</td>
                    <td style="border: 1px solid black; padding: 5px;">Cell 2</td>
                    <td style="border: 1px solid black; padding: 5px;">Cell 3</td>
                </tr>
                <tr>
                    <td style="border: 1px solid black; padding: 5px;">Cell 4</td>
                    <td style="border: 1px solid black; padding: 5px;">Cell 5</td>
                    <td style="border: 1px solid black; padding: 5px;">Cell 6</td>
                </tr>
            </tbody>
        </table>
    </div>
</div>
<h3>Column Alignment</h3>
<p>You can align columns by adding colons (<code>:</code>) to the separator row:</p>
<ul>
<li><code>:---</code> for left alignment (default)</li>
<li><code>:---:</code> for center alignment</li>
<li><code>---:</code> for right alignment</li>
</ul>
<div class="text--formatting">
    <div>
        <b>EXAMPLE</b>
        <code>
| Left | Center | Right |<br/>
|:-----|:------:|------:|<br/>
| A    | B      | C     |<br/>
| 100  | 200    | 300   |
        </code>
    </div>
    <div>
        <b>RESULT</b>
        <table style="border-collapse: collapse; border: 1px solid black;">
            <thead>
                <tr>
                    <th style="border: 1px solid black; padding: 5px; text-align: left;">Left</th>
                    <th style="border: 1px solid black; padding: 5px; text-align: center;">Center</th>
                    <th style="border: 1px solid black; padding: 5px; text-align: right;">Right</th>
                </tr>
            </thead>
            <tbody>
                <tr>
                    <td style="border: 1px solid black; padding: 5px; text-align: left;">A</td>
                    <td style="border: 1px solid black; padding: 5px; text-align: center;">B</td>
                    <td style="border: 1px solid black; padding: 5px; text-align: right;">C</td>
                </tr>
                <tr>
                    <td style="border: 1px solid black; padding: 5px; text-align: left;">100</td>
                    <td style="border: 1px solid black; padding: 5px; text-align: center;">200</td>
                    <td style="border: 1px solid black; padding: 5px; text-align: right;">300</td>
                </tr>
            </tbody>
        </table>
    </div>
</div>
<h3>Example: Pricing Table</h3>
<div class="text--formatting">
    <div>
        <b>EXAMPLE</b>
        <code>
| Monthly Pages | Plans Needed | Monthly Cost | Annual Cost (~20% off) |<br/>
|--------------|--------------|--------------|------------------------|<br/>
| 10,000       | 1 plan       | $125         | $1,250                 |<br/>
| 20,000       | 2 plans      | $250         | $2,500                 |<br/>
| 30,000       | 3 plans      | $375         | $3,750                 |<br/>
| 50,000       | 5 plans      | $625         | $6,250                 |<br/>
| 100,000      | 10 plans     | $1,250       | $12,500                |
        </code>
    </div>
    <div>
        <b>RESULT</b>
        <table style="border-collapse: collapse; border: 1px solid black;">
            <thead>
                <tr>
                    <th style="border: 1px solid black; padding: 5px;">Monthly Pages</th>
                    <th style="border: 1px solid black; padding: 5px;">Plans Needed</th>
                    <th style="border: 1px solid black; padding: 5px;">Monthly Cost</th>
                    <th style="border: 1px solid black; padding: 5px;">Annual Cost (~20% off)</th>
                </tr>
            </thead>
            <tbody>
                <tr>
                    <td style="border: 1px solid black; padding: 5px;">10,000</td>
                    <td style="border: 1px solid black; padding: 5px;">1 plan</td>
                    <td style="border: 1px solid black; padding: 5px;">$125</td>
                    <td style="border: 1px solid black; padding: 5px;">$1,250</td>
                </tr>
                <tr>
                    <td style="border: 1px solid black; padding: 5px;">20,000</td>
                    <td style="border: 1px solid black; padding: 5px;">2 plans</td>
                    <td style="border: 1px solid black; padding: 5px;">$250</td>
                    <td style="border: 1px solid black; padding: 5px;">$2,500</td>
                </tr>
                <tr>
                    <td style="border: 1px solid black; padding: 5px;">30,000</td>
                    <td style="border: 1px solid black; padding: 5px;">3 plans</td>
                    <td style="border: 1px solid black; padding: 5px;">$375</td>
                    <td style="border: 1px solid black; padding: 5px;">$3,750</td>
                </tr>
                <tr>
                    <td style="border: 1px solid black; padding: 5px;">50,000</td>
                    <td style="border: 1px solid black; padding: 5px;">5 plans</td>
                    <td style="border: 1px solid black; padding: 5px;">$625</td>
                    <td style="border: 1px solid black; padding: 5px;">$6,250</td>
                </tr>
                <tr>
                    <td style="border: 1px solid black; padding: 5px;">100,000</td>
                    <td style="border: 1px solid black; padding: 5px;">10 plans</td>
                    <td style="border: 1px solid black; padding: 5px;">$1,250</td>
                    <td style="border: 1px solid black; padding: 5px;">$12,500</td>
                </tr>
            </tbody>
        </table>
    </div>
</div>
<h5>Tables only work in <em>Description</em> type questions!</h5>
<h2>Spacings and alignment</h2>
<h3>Centered text</h3>
<p>You may align text to the center by using <code>[center]my text[/center]</code> tags.</p>
<div class="text--formatting">
    <div>
        <b>EXAMPLE</b>
        <code>
            [center]my centered text[/center] <br/>
            [center]next centered line[/center]
        </code>
    </div>
    <div>
        <b>RESULT</b>
        <code>
            <p style="text-align:center;margin:0">my centered text</p>
            <p style="text-align:center;margin:0">next line</p>
        </code>
    </div>
</div>
<p>Please note that <code>[center]</code> tag may need to be placed on each line if you have line breaks.</p>
<h3>Right-aligned text</h3>
<p>You may align text to the right by using <code>[right]my text[/right]</code> tags.</p>
<div class="text--formatting">
    <div>
        <b>EXAMPLE</b>
        <code>
            [right]my right-aligned text[/right] <br/>
            [right]next right-aligned line[/right]
        </code>
    </div>
    <div>
        <b>RESULT</b>
        <code>
            <p style="text-align:right;margin:0">my right-aligned text</p>
            <p style="text-align:right;margin:0">next right-aligned line</p>
        </code>
    </div>
</div>
<p>Please note that <code>[right]</code> tag may need to be placed on each line if you have line breaks.</p>
<h3>Horizontal &amp; Vertical spacing</h3>
<p>You can use <code>[verticalspace=0.5]</code> and <code>[horizontalspace=0.5]</code> short codes to adjust the spacings. <code>0.5</code> is the length in centimeters (cm) which you can adjust. The length may also be negative if you would like to reduce the spacings instead. Please do not make space between the question name and text box very small - this could impact the recognition as question name could be recognized as text/number as well.</p>
<p>Also, <code>[smallspace]</code>, <code>[space]</code>, <code>[midspace]</code>, <code>[bigspace]</code> will add <strong>0.1cm</strong>, <strong>0.5cm</strong>, <strong>1.5cm</strong> and <strong>3cm</strong> horizontal spacing accordingly. You can also use shorter versions <code>[vspace=0.5]</code> and <code>[hspace=0.5]</code></p>
<div class="text--formatting">
    <div>
        <b>EXAMPLE</b>
        <code>
            My text [space] with [horizontalspace=2.5] is here.
        </code>
    </div>
    <div>
        <b>RESULT</b>
        <code>
            My text &nbsp;&nbsp;&nbsp;&nbsp;&nbsp; with &nbsp;&nbsp;&nbsp;&nbsp;&nbsp; &nbsp;&nbsp;&nbsp;&nbsp;&nbsp;  &nbsp;&nbsp;&nbsp;&nbsp;&nbsp;  is here.
        </code>
    </div>
</div>
<p><strong>Note:</strong> <code>[smallspace]</code>, <code>[space]</code>, <code>[midspace]</code>, <code>[bigspace]</code> will be hidden in web surveys. Where <code>[verticalspace=0.5]</code>, <code>[horizontalspace=0.5]</code>, <code>[vspace=0.5]</code> and <code>[hspace=0.5]</code> short codes functions the same as in paper surveys.</p>
<h3>Align text to right</h3>
<p>If you would like to align text to the right, just use <code>[fill]</code> tag before the start of the text.</p>
<div class="text--formatting">
    <div>
        <b>EXAMPLE</b>
        <code>
            My left-aligned text [fill] My right-aligned text.
        </code>
    </div>
    <div>
        <b>RESULT</b>
        <code>
            My left-aligned text <span style="float:right">My right-aligned text.</span>
        </code>
    </div>
</div>
<h3>Fixed width or height box</h3>
<p>For more advanced layouts you may set the height and width of the text block allowing to align text areas using <code>[width=3cm]3 cm (1.18in) width[/width]</code> or <code>[height=3cm]3 cm (1.18in) height[/height]</code> or both <code>[height=3cm][width=3cm]3 cm (1.18in) box[/width][/height]</code>.</p>
<p><code>[height]</code> should always be used with the Prefill Forms dynamic variables to prevent dynamically added text from changing the survey layout.</p>
<p><code>[width]</code> shortcode is particularly useful when aligning text with "Inline text" and "Inline checkboxes".</p>
<div class="text--formatting">
    <div>
        <b>EXAMPLE</b>
        <code>[width=3cm]3 cm (1.18in) width[/width] [width=3cm]3 cm (1.18in) width[/width] [width=3cm]3 cm (1.18in) width[/width]</code>
        <code>[width=5cm][center]centered 5cm[/center][/width] [width=5cm][center]centered 5cm[/center][/width]</code>
        <code>
            [height=3cm][width=3cm][center]3cm x 3cm[/center][/height][height=3cm][width=3cm][center]3cm x 3cm[/center][/height]<br/><br/>
            [height=3cm][width=3cm][center]3cm x 3cm[/center][/height][height=3cm][width=3cm][center]3cm x 3cm[/center][/height]
        </code>
    </div>
    <div>
        <b>RESULT</b>
        <code>
            <span style="width: 3cm;display: inline-block;">3 cm (1.18in) width</span> <span style="width: 3cm;display: inline-block;">3 cm (1.18in) width</span> <span style="width: 3cm;display: inline-block;">3 cm (1.18in) width</span>
        </code>
        <code>
            <span style="width: 5cm;height: 3cm; display: inline-block;text-align: center;">centered 5cm</span> <span style="width: 5cm;display: inline-block;text-align: center;">centered 5cm</span>
        </code>
        <code>
            <span style="width:3cm;height: 3cm; display: inline-block;text-align: center;">3cm x 3cm</span>
            <span style="width:3cm;height: 3cm; display: inline-block;text-align: center;">3cm x 3cm</span><br/>
            <span style="width:3cm;height: 3cm; display: inline-block;text-align: center;">3cm x 3cm</span>
            <span style="width:3cm;height: 3cm; display: inline-block;text-align: center;">3cm x 3cm</span>
        </code>
    </div>
</div>
<h3>Page break</h3>
<p>To move section down to the next page you could use <code>[pagebreak]</code> shortcode.  This shortcode may not work in 'Heading' type questions.
Alternatively, you may add a new question and select its type as "Page break".</p>
<div class="text--formatting">
    <div>
        <b>EXAMPLE</b>
        <code>
            My first page 
            [pagebreak] 
            This text will appear in the next page
        </code>
    </div>
    <div>
        <b>RESULT</b>
        <code>
            My first page 
            <br>
            <br>
            <br>
            <br>
            This text will appear in the next page
        </code>
    </div>
</div>
<h3>Line break</h3>
<p>To make a small line break may just press the <strong>[Enter] button</strong> in your keyboard to add as many line breaks as you need. You may also use <code>[br]</code> or  <code>[newline]</code> short codes in your text to add a line break.</p>
<div class="text--formatting">
    <div>
        <b>EXAMPLE</b>
        <code>
            My first paragraph [br] Another paragraph
        </code>
    </div>
    <div>
        <b>RESULT</b>
        <code>
            My first paragraph
            <br>
            Another paragraph
        </code>
    </div>
</div>
<h3>Large Line break</h3>
<p>If you wish to make a large line break you may insert <code>[linebreak]</code> tag in your text.</p>
<div class="text--formatting">
    <div>
        <b>EXAMPLE</b>
        <code>
            My first paragraph
            [linebreak]
            Another paragraph
        </code>
    </div>
    <div>
        <b>RESULT</b>
        <code>
            My paragraph
            <br>
            <br>
            <br>
            Another paragraph
        </code>
    </div>
</div>
<h3>Horizontal line</h3>
<p>If you would like to add a horizontal line, just use <code>[hr]</code> in your text</p>
<div class="text--formatting">
    <div>
        <b>EXAMPLE</b>
        <code>
            My first paragraph
            [hr]
            Another paragraph
        </code>
    </div>
    <div>
        <b>RESULT</b>
        <code>
            My paragraph
            <hr /> 
            Another paragraph 
        </code>
    </div>
</div>
<h3>Line</h3>
<p>If you would like to add a  line, just type six underscores <code>______</code> in your text. Line will be extended to automatically fit in paragraph.</p>
<div class="text--formatting">
    <div>
        <b>EXAMPLE</b>
        <code>
            ______
        </code>
    </div>
    <div>
        <b>RESULT</b>
        <code>
            <div style="border-bottom: 1px solid #000;"></div>
        </code>
    </div>
</div>
<h3>Dotted line</h3>
<p>If you would like to add a dotted line, just type six dots <code>......</code> in your text. Line will be extended to automatically fit in paragraph.</p>
<div class="text--formatting">
    <div>
        <b>EXAMPLE</b>
        <code>
            ......
        </code>
    </div>
    <div>
        <b>RESULT</b>
        <code>
            <div style="border-bottom: 1px dotted #000;"></div>
        </code>
    </div>
</div>
<h3>Pagination</h3>
<p>There are several shortcodes for displaying page numbers.</p>
<p><code>[currentpage]</code> - shows current page number.
<code>[lastpage]</code> - shows the last page.</p>
<p>For example, you may use the above shortcodes to get a dynamically changing text of "This is a page 1 of 5" ("This is a page [currentpage] of [lastpage]).</p>
<p>Additionally, if you only want to display certain text on a specific page only, you may use this shortcode: <code>[page=PAGE]My text[/page]</code>. Replace <code>PAGE</code> with the page number you want the 'My text' to de displayed.</p>
<h3>Other short-codes</h3>
<p>Fixed paragraph height: <code>[height=3cm]my paragraph has max height of 3cm[/height]</code>. <strong>NOTE</strong>: This is extremely useful with Prefill Forms to prevent dynamically added text to change the survey layout.</p>
<p>Fixed paragraph width: <code>[width=3cm]my paragraph has max width of 3cm[/width]</code>. <strong>NOTE</strong>: This command is particularly useful when aligning text with "Inline text" and "Inline checkboxes".</p>
<p>This is a list of other short-codes that are available to use.</p>
<p>Unique identifier: <code>[id]</code></p>
<p>Link to web survey: <code>[link]</code></p>
<p>QR code to web survey: <code>[websurvey_qrcode height=2cm]</code>. <strong>IMPORTANT</strong>: DO NOT place this code at the top-left and bottom-right of the survey.</p>
<p>Smiles: <code>[sad]</code>, <code>[neutral]</code>, <code>[smile]</code></p>
<p>Checked checkbox: <code>[check]</code>, <code>[multicheck]</code>, <code>[singlecheck]</code></p>
<p>Filled checkbox: <code>[filled]</code>, <code>[multifilled]</code>, <code>[singlefilled]</code></p>
<p>Corrected checkbox: <code>[correct]</code></p>
<p>Math equations: <code>[equation]100+999[/equation]</code> <code>[equation]100-10[/equation]</code></p>
<p>For multilingual surveys, if a letter is displayed as a square box, it means the font in use doesn't contain the glyph for that character. In these cases you could use <code>[latin]</code> and <code>[arabic]</code> shortcodes.
Arabic typesetting (Allows using Arabic script, where the primary language is e.g., English): <code>Sentence in English language [arabic]استطلاع رأي[/arabic]</code>
Latin typesetting (Allows using Latin script when the primary language is e.g., Arabic): <code>[latin]Sentence in English language[/latin]استطلاع رأي</code></p>
<h2>Images</h2>
<p>You may upload your images to be included in the paper survey. This feature is only available in  the <strong>Enterprise</strong> plan.</p>
<p>However, you may try it out in your demo survey, by inserting the image of our logo: <code>[img]logo[/img]</code></p>
<div>
<ul>
    <li>If you would like to <b>center the image</b>, additionally provide center parameter, (e.g. <span>[img width=5 height=3 center]logo[/img]</span>)</li>
    <li>If you would like to include a <b>full-width</b> image, do not provide any parameters, (e.g. <span>[img]logo[/img]</span>)</li>
    <li>If you would like to set image to <b>half page width</b>, set width parameter to half (e.g. <span>[img width=half]logo[/img]</span>)</li>
    <li>If you would like to set image to <b>third page width</b>, set width parameter to third (e.g. <span>[img width=third]logo[/img]</span>)</li>
</ul>
</div>]]>
            </summary>
                                    <updated>2026-04-30T14:15:48+00:00</updated>
        </entry>
    </feed>
